Christian Yelich Is Raising His Game
It would not have been a surprise if Christian Yelich had leveled off after coming out of Baseball Nowhere (a.k.a. Miami), joining the Brewers, and winning the NL MVP award. He may yet do that, because nobody makes baseball look so easy for very long. Thus far this season, however, the 27-year-old slugger appears to be improving in several areas, and despite Monday night’s 0-for-4 against the Cardinals — just the third time in 24 games that he had failed to get on base this year — he’s been as hot as any hitter in baseball, batting .337/.439/.820 with a 210 wRC+.
Yelich began his 2019 season with an Opening Day home run off the Cardinals’ Miles Mikolas, and proceeded to go yard again in each of the next three games, thus joining Willie Mays (1971), Mark McGwire (1998), Nelson Cruz (2011), Chris Davis (2013), and Trevor Story (2016) as the only players to homer in each of his team’s first four games. After a relatively quiet 12-game stretch in which he homered just once, he broke out with a three-homer game against the Cardinals on April 15, the first hat trick of his career. Thus began an eight-homers-in-six-games binge that, if not for a bit of highway robbery by the Dodgers’ Cody Bellinger on Sunday, would have been nine homers in seven games.
Even with his two-game drought, Yelich’s 13 homers in his team’s first 24 games put him in select company.
| Player | Year | Team | HR Through 24 | Tot HR |
|---|---|---|---|---|
| Alex Rodriguez | 2007 | Yankees | 14 | 54 |
| Cy Williams | 1923 | Phillies | 13 | 41 |
| Willie Mays | 1964 | Giants | 13 | 47 |
| Mike Schmidt | 1976 | Phillies | 13 | 38 |
| Ken Griffey Jr. | 1997 | Mariners | 13 | 56 |
| Luis Gonzalez | 2001 | Diamondbacks | 13 | 57 |
| Albert Pujols | 2006 | Cardinals | 13 | 49 |
| Nelson Cruz | 2015 | Mariners | 13 | 44 |
| Christian Yelich | 2019 | Brewers | 13 | N/A |
The average player from that group finished the season with 48 homers, and most of them wound up leading their respective leagues, with Gonzalez (who was overshadowed by Barry Bonds’ record-setting 73 homers), Pujols (who finished second to Ryan Howard’s 58) and Cruz (who finished second to Davis’ 47) the exceptions. The only player here who might be unfamiliar to most readers is Williams, a heavy-hitting center fielder for the Cubs (1912-17) and Phillies (1918-30), who led the NL in homers four times, mainly by taking advantage of home cooking. Of his 90 homers in those four seasons, 61 of them (68%) came at home (1916 at Wrigley Field, 1920, ’23, and ’27 at the notoriously hitter-friendly Baker Bowl). For his career, 165 of his 251 homers (65.7%) came at home, and his 199-point home/road OPS differential is the fourth-largest among players with at least 7,000 PA. There’s another connection here: in his 1923 season, Williams homered 10 times against the Cardinals, the most by any opposing player; Yelich already has eight homers against them, with nine games between the two teams still to come.
As for home cooking, Yelich has enjoyed more than his share:
| Year | Home PA | Home HR | AVG/OBP/SLG | wRC+ | Road PA | Road HR | AVG/OBP/SLG | wRC+ |
|---|---|---|---|---|---|---|---|---|
| 2018 | 315 | 22 | .324/.406/.655 | 178 | 336 | 14 | .328/.399/.545 | 155 |
| 2019 | 67 | 13 | .417/.540/1.271 | 323 | 40 | 0 | .270/.325/.324 | 76 |
| Total | 382 | 35 | .337/.429/.746 | 202 | 376 | 14 | .321/.391/.521 | 147 |
The dude is simply wearing out Bernie Brewer. A honking 71.4% of his homers since joining the team last year have come at Miller Park — a homer-conducive park, with a 112 park factor for lefties in 2018 (second in the majors) compared to just 103 for righties — including all 13 from this year. Since the start of last season, he leads the majors in homers at home (35), with five more than second-ranked Trevor Story has hit at Coors Field, and seven more than the two players tied for third, Khris Davis and Joey Gallo, have hit at their respective ballparks. His 202 wRC+ at Miller Park in that span leads Mike Trout by three points, and Aaron Judge by six.
Obviously, these are ridiculous numbers of the type that could have made my extreme hitters’ stats piece if I had timed it differently. I’m not going to suggest that Yelich’s sizzling production is sustainable at this level, but a few under-the-hood things do stand out even given the relatively small sample sizes, because they’re in areas where we’ve either reached the point of stabilization or are at least approaching it.
Given that strikeout rate stabilizes at 60 PA, it’s worth noting that Yelich has cut his K’s from 20.7% last year to 15.0% this year, doing so while both his swing rate (which stabilizes at 50 PA) and swinging strike rate have risen slightly, the former form 44.0% last year to 45.2% this year, the latter from 9.2% to 10.6%. With two strikes, he’s swinging slightly more frequently (from 15.8% to 17.1%), missing less (from 4.1% to 3.2%), and hitting a ridiculous .267/.353/.511 with three homers in 51 PA; his 125 wRC+ under such circumstances is in the 88th percentile among the 154 players with at least 40 PA that have gone to two strikes. By comparison, last year, he hit .197/.289/.317 (66 wRC+) in 329 PA with two strikes, which still put him in the 67th percentile. The two-strike results may well be fluky given the sample sizes, but overall, this appears to be an area where Yelich is improving. Meanwhile, though his walk rate (a stat that doesn’t stabilize until 120 PA) has risen substantially (from 10.4% to 15.0%), that owes something to him matching his career high with four intentional passes (he had two last year); his rate of unintentional walks has only moved from 10.1% to 11.2%.
The other thing that stands out thus far is Yelich’s batted ball profile. First, some background is in order. Until this year, he’d always been a groundball machine, ranking among the top six annually from 2014-17, including first with a 62.5% rate in 2015. He entered this season with a 57.7% career rate, and last year’s 51.8% mark, which ranked 12th among 140 qualifiers, was his lowest — yet it still stood out among sluggers. Only one of the other 18 qualifiers with a groundball rate of at least 50% hit more than 24 homers (David Peralta, 30 homers, 50.7% groundball rate), and only three finished with a wRC+ of 115 or better (Peralta at 130, Lorenzo Cain at 124, Shin-Soo Choo at 118). Those 18 players as a group homered in 2.3% of their plate appearances, and combined for a 102 wRC+, compared to Yelich’s 5.5% home run rate and 166 wRC+. Here’s a scatter plot of all qualified hitters:
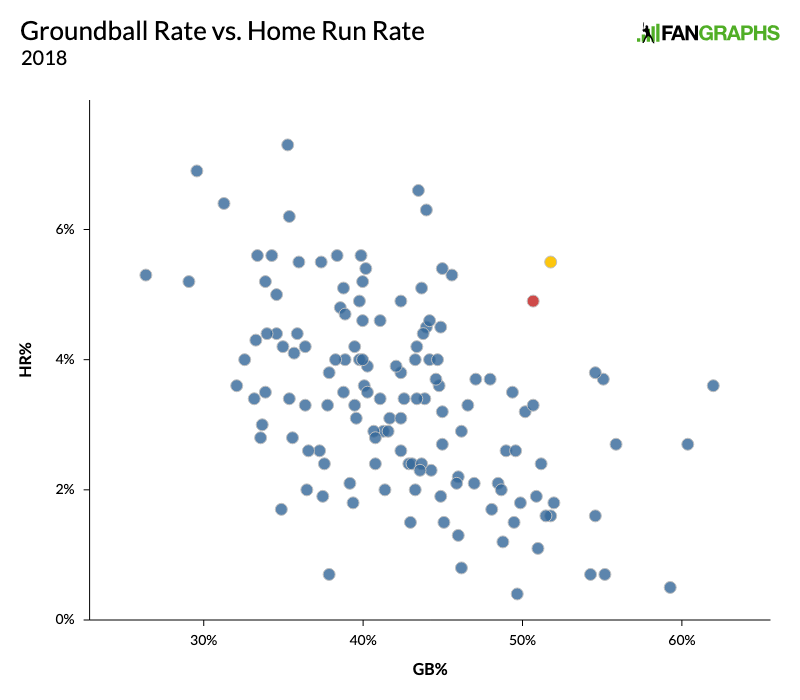
Yellich is the yellow dot, with Peralta, the red one, the only other player in his vicinity in terms of home run rate (4.9%) and groundball rate. They’re the odd ducks in this context, which bears some connection to the fact that Yelich had the highest rate of home runs per flyball in the majors (35.0%), with Peralta 13th (23.4%)
As for this year, with 74 balls in play, Yelich has produced just a 40.5% groundball rate and a 43.2% flyball rate (up from 23.5%). Those numbers stabilize at 80 balls in play, so we’re technically in small-sample territory, but since a player’s groundball-to-flyball ratio stabilizes at 100 PA, his flipping from 2.20 (93rd percentile) to 0.94 (35th percentile) is significant.
Of course, we could have taken a shortcut through the last few paragraphs by noting that Yelich’s average launch angle (which stabilizes at 40 balls in play) has increased dramatically year over year, from 4.7 degrees to 16.1. Here it’s worth noting that although Yelich has been vocal in his resistance to joining the bandwagon of players who are explicitly in pursuit of greater launch angles, even last year’s performance reflected some evolution. Through July, he had averaged just 2.7 degrees, while in August and September, that rose to 8.3 degrees; over that two-month span, he hit 335/.434/.728 with 21 homers and a 205 wRC+, leaving the rest of the NL field in the dust when it came to the MVP race.
With the caveat that the concentration of Cardinals pitching he’s faced (33.6% of his PA) might be clouding these early season trends, what Yelich has done over the season’s first month is impressive. While he obviously isn’t going to slug .820 all year, his reduced strikeout and groundball rates and increased launch angle suggest that he’s hardly done terrorizing pitchers. In fact, he may be en route to a superlative follow up to last year’s MVP season. Opposing pitchers, consider yourselves warned.
Brooklyn-based Jay Jaffe is a senior writer for FanGraphs, the author of The Cooperstown Casebook (Thomas Dunne Books, 2017) and the creator of the JAWS (Jaffe WAR Score) metric for Hall of Fame analysis. He founded the Futility Infielder website (2001), was a columnist for Baseball Prospectus (2005-2012) and a contributing writer for Sports Illustrated (2012-2018). He has been a recurring guest on MLB Network and a member of the BBWAA since 2011, and a Hall of Fame voter since 2021. Follow him on BlueSky @jayjaffe.bsky.social.
I was shocked yesterday to find that Yelich has a batted ball profile this year identical to Aaron Judge’s career. The only difference is he’s doing it with a 10 percentage point lower whiff rate.