
FanGraphs Weekly Mailbag: December 13, 2025
Compared to last year, when we saw multiple players sign record-setting contracts, this week’s Winter Meetings were rather tame. That’s not to say it was dull or that nothing happened. Edwin Díaz rejected an offer to re-sign with the Mets for more money because he wanted to pitch for the Dodgers. Kyle Schwarber returned to the Phillies on a five-year, $150 million contract, a massive deal considering he’s a DH who turns 33 in March. Pete Alonso drove from his home in Tampa up to Orlando to meet with several suitors, then signed a five-year, $155 million deal with the Orioles; the Mets, the team for whom he spent his first seven seasons and set the franchise home run record, did not extend him a contract offer. Several smaller moves happened, too. Michael Soroka joined the Diamondbacks on a one-year deal, and Steven Matz signed with the Rays for two years. The Tigers brought back Kyle Finnegan on a two-year, $19 million contract, and the Pirates became the latest team to believe they can fix Gregory Soto, signing him for one year and $7.75 million. The Braves added outfielder Mike Yastrzemski on Wednesday night.
The fun didn’t stop when the Winter Meetings did, though. On Thursday, while most of us at FanGraphs were flying home, the Braves signed reliever Robert Suarez for three years and $45 million. And then on Friday, the Blue Jays and Tyler Rogers agreed to a three-year, $37 million deal, with a vesting option for a fourth year.
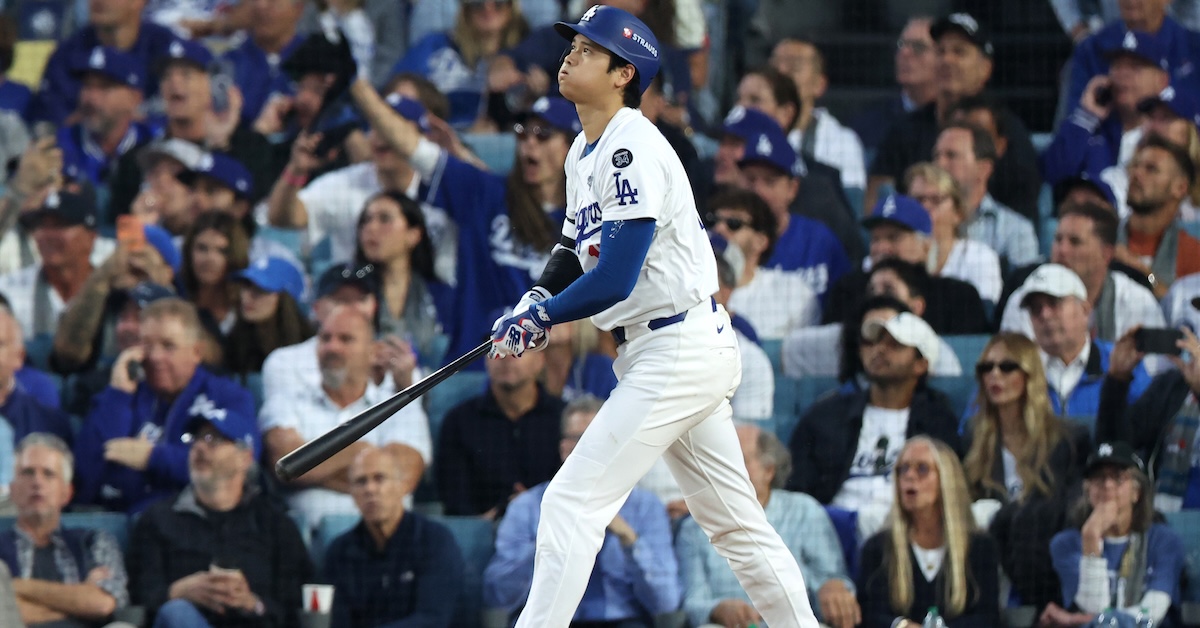
We won’t cover those moves, or any of the others that went down this week, in this column. You can find them in Jon Becker’s latest Matrix Reloaded. Instead, today we’ll be answering your questions about players with more All-Star appearances than career WAR, the ABS challenge system, Shohei Ohtani’s World Series Game 3 performance, and more. Before we do, though, I’d like to remind you that this mailbag is exclusive to FanGraphs Members. If you aren’t yet a Member and would like to keep reading, you can sign up for a Membership here. It’s the best way to both experience the site and support our staff, and it comes with a bunch of other great benefits. Also, if you’d like to ask a question for an upcoming mailbag, send me an email at mailbag@fangraphs.com.
Matt is the associate editor of FanGraphs. Previously, he was the baseball editor at Sports Illustrated. His work has appeared in The New York Times, Men’s Health, Baseball Prospectus, and Lindy’s Sports Magazine. Follow him on Twitter @ByMattMartell and Blue Sky @mattmartell.bsky.social.
John asked if there WERE any unforeseen consequences of the ABS system in the minors, not whether there WOULD BE unforeseen consequences in the majors. Seems like every few weeks there’s something that gets ignored in one of these questions because the responder misinterpreted or misread it.
As the author of that question, that is exactly what I meant, about if there had been anything that came up that was unexpected or counterintuitive. Nonetheless, I am grateful for the answer provided.
Right, my intent isn’t to disparage the mailbag as a whole; I’m here to read it after all. It’s just frustrating when the part of the question I find most interesting gets waved off in the first sentence because the author read the question wrong.
Appreciate the feedback here, and apologies for our misreading the question. We will look into whether there were unforeseen consequences in ABS testing in the minors and provide an answer in next week’s mailbag.
I have two responses. 1. You’re right that this is skill-able at lower velocities. Hell, I still intentionally foul balls off in 35+ mens league (Average velo ~70 mph). You can’t trust those umpires with two strikes. If you can reach the ball, better to tap it foul and take the decision away from the ump. Maybe the next pitch will be a meatball. Or a more obvious ball.
2. The Moneyball era had one particularly important lesson to teach us data nerds–not everything can be cleanly observed in our data sets. Take “clutch.” Find a baseball player who doesn’t believe this is real. I’ll wait. There’s a reason for that. Now, find a data scientist who believes it IS real. I’ll wait. There’s a reason for that too: clutch wanders. It’s a juxtaposition of state of mind, mechanics, health, and other factors. It is, defined simplistically, a player’s ability to access another level when the game is on the line. These guys absolutely exist in pro ball (and all levels), but the data will never hold still long enough for us to prove it. To me, this “foul ball skill” is a sort of mini-clutch. I have no doubt some players are better at this than others…some of the time.
There is still room for belief in baseball. The biggest discoveries from Statcast have been things we already knew then threw away because our data couldn’t capture them. Tunnels, barrels, swing speed/path, etc.
Clutch is like free will. A lot of philosophers and neuroscientists do not believe it exists. But when I am picking something off a restaurant menu it sure feels real.
Both clutchness and free will are existential in nature. But because they are inherent to humanity and by nature unexpected there’s not a lot we can do by knowing it exists.
My understanding is that wOBA and its correlates handle IBBs by crediting those PAs with the player’s average result across their non-IBB PAs.
So for our purposes, Ohtani’s line isn’t just 4-4 with all those walks – it’s equivalent to going 7.2 for 7.2 with 1.8 BBs, 3.6 HRs and 3.6 2Bs.
Are we sure that isn’t the greatest line ever?
Isn’t the point of doing that to make sure that IBBs don’t skew a player’s wOBA? Like, it makes sense to make IBBs a neutral outcome for the purposes of a rate stat like wOBA, but when you start trying to apply wOBA like a counting stat things get weird. You’re essentially saying that he should get credit for the weighted average of 2 HRs and 2 doubles for each of those IBBs, when I don’t think there’s any rational defense that any individual IBB would ever be that valuable.
I agree that, in edge cases like this, the simplifying heuristic used to compute wOBA can generate somewhat absurd results.
But a silly fun questions like this one is hardly the place to revamp FG’s formulas and methods. And the way that these stats are normally computed includes imputed production from the IBB plate appearances. So I believe that’s what should have been done here.
And to be clear – the simplifying heuristic is not merely IBBs shouldn’t skew a players wOBA, it’s that plate appearances are i.i.d with respect to sequencing and game state. The fact that this is true to a first approximation is why wOBA is such a good proxy, but it is absolutely not actually true. And IBBs are one aspect where that assumption fails pretty miserably. Game state is hugely predictive of intentional walks, and that’s why linear weights finds de minimus runs created from IBBs in aggregate. But no one would argue that Ohtani was intentionally walked at a replacement-level or that having Ohtani on base those 4 times didn’t generate any additional run expectancy.
(One analysis I’d like to see is to run linear weights on the subset of IBBs issued to players with more than 20 IBBs – I have a suspicion that you’d find a significant coefficient, if still quite a bit lower than those for unintentional walks.)
I don’t disagree with the notion that an IBB should not be a replacement level outcome, but if we’re taking a counting stats approach here, I would much prefer that than the alternative you chose in your original comment, which was to weight those IBBs as if they were bases-clearing hits. The former case is a defensible choice in light of a lack of a way to account for game state; the latter is just pure Bad Math.
It may be Bad Math, but it is literally the math that FG uses to compute their official estimates of wRAA, WAR, etc.
Look, don’t take my word for it. Here’s a link to the leaderboard for game 3 of the world series. It gives Ohtani a wRAAof 8.3, not the 5.9 computed in Ben’s answer.
My point is simply that the response should have reckoned with this, especially since I’m pretty sure that it changes the overall answer from “no” to “yes”.
It’s fine if Ben believes that the IBB heuristic breaks down in this instance – you seem to agree and maybe I would too – but not speaking to it and pretending the usual wRAA formula is something different is bonkers.
My first baseball glove was Bobby Richardson autographed (yes, I’m old), so he holds soft spot in my heart but an average of 0.5 WAR a season is not a description of a “good” player. He had two seasons of more than 2 WAR and only one other with more than 1 WAR. In his best season, he was seventh is position player WAR on the Yankees (!!!) and 23rd in the AL. That season. the player with the highest WAR was Brooks Robinson but, even ignoring advanced statistics, Robinson had a higher batting average (by one point) and defensively he was Brooks Robinson.
It’s still kind of baffling to me that Maz wasn’t the mvp of that series. Like, I get that Richardson was great, but THE walk off?
I remember that Shawn Green performance. I don’t think I have *ever* seen a player hit like that.
But the Brewers only won 56 games that year. Brewers pitchers gave up 8 homers that game, including Jose Cabrera giving up 4 in under two innings. But since the game was already lost at that point his WPA was only -0.001.
If we’re going for postseason heroics it’s hard to beat Reggie Jackson’s Game 6 in 1977. I know Ohtani was great that game but that game was like a thousand innings. Reggie Jackson clubbed 3 homers in a regular 9 inning game. Burt Hooton was a 5 win pitcher that year, and Elias Sosa had a 1.98 ERA in relief in 1977. That was really something.
Fun fact: Davy Lopes was involved in the losing side of both the Green and Jackson games. Lopes played second base for the Dodgers in 1977 and managed the Brewers in 2002. I guess if you’re around the game long enough you’re going to be on losing end of multiple beatings no matter how good you are.
The game was a thousand innings but Ohtani did all his great stuff in the first 9. I don’t see a reason to ding him because of the following 9 innings where he wasn’t allowed to hit.
Looking at Don Mueller, another factor is that he got to play through four seasons of absolutely catastrophic decline. From 1951-4 he had an average bat and good-to-average grades in right field, for a respectable if slightly below average 6.4 fWAR. From 1955-7 his bat and glove both went way downhill, but he still was mostly full time for -4.6 fWAR, plus another -1.0 fWAR in 180 PA for the White Sox in 1958. So his career fWAR went back below his number of All-Star appearances even though he’d been a respectable player for four years.
Also the first year of his decline was one of his two All-Star years. Go figure.
Unfortunately for us stats trivia nerds, this seems highly dependent on WAR measure. The only one of these players with more All-Star berths than bWAR is Helmsley.
A small correction on the Bobby Richardson segment. You say he had his only positive offensive WAR and his best defensive WAR in 1962, but the defensive stat you shared (+18.7 runs) was from 1963 (the only other year he earned at least 2 WAR)
Hi Jon, thanks for pointing this out. I looked at the wrong line on his stat page while writing my response. Whoops. I’ve issued a correction and updated the piece accordingly.
He was often a good player when he actually played, but looking back on it I can’t believe Sandy Alomar Jr made six all star games. I think he was hurt a lot and wore down over the course of the season pretty quickly. Finished his career with 13.3 fWAR and it’s not like his all-star games were always his good seasons. He made the all-star game in a year where he slashed .217 / .264 / .266. In that year, he was outplayed in the first half by Joel Skinner, a catcher *on his own team* who only had about 15 fewer PAs than him.
He made more all-star games than Thurman Munson, Buster Posey, Joe Mauer, Jorge Posada, JT Realmuto, Javy Lopez, Jonathan Lucroy, Russell Martin, or Jim Sundberg. And those are just the catchers!
In his six all star years he put up fWARs of 2.4, -0.6, 1.0, 4.2, and 0.0. But maybe he was really good in the first half? In those six years if we go through July 1, here was his fWAR rank among AL catchers only: 9th, 27th, 12th, 7th, 2nd, 7th. And that is just among AL catchers.
And worth noting that the in three of Sandy’s All-Star seasons the Indians finished in first place, so it’s not like Sandy got the “well, somebody has to be the All-Star on this crappy team” those years. As I’m sure you know, those late 90s Indians were stacked.
And in the other three years, he was not in the top 5 of position player WAR even once.
I think he kept getting voted in as the starter, and I don’t remember how it got out that he was better than Carlton Fisk, Ivan Rodriguez, Mickey Tettleton, Lance Parrish, and Terry Steinbach. Because he pretty clearly wasn’t even close to those guys most years he got voted in. But I remember thinking he was good too! And sometimes he was, but not like Ivan Rodriguez.
To clarify – I meant he wasn’t even in the top 5 of Indians position player WAR.
Maybe he got a lot of fan votes? Indians fans were very enthusiastic in the late 90s after 4 decades of terrible baseball. And Sandy was very popular in Cleveland, still is as a long-time base coach. At this point he’s kind of the Johnny Pesky of Cleveland in a “beloved in this city only” sense.
All-star selections continue to be wonky. Francisco Lindor’s first three seasons with the Mets, in which he compiled 18.4 bWar, 3 top-ten MVP results (including second to Ohtani!) and two siver sluggers – resulted in ZERO all-star selections.
and, sadly these things matter(ed) for things like the HOF. If 6 of Lou Whitaker’s 8 seasons in which he complied 4+ war but did not make the all-star team became all-star seasons, he probably would have been deservedly voted in.
Lindor wasn’t particularly good the first season with the Mets. The second season the SS position in the NL was stacked and he lost out to Trea Turner and Dansby Swanson (who had equivalent years). The third season Braves fans stormed the vote because Orlando Arcia won the fan vote, and he and Dansby Swanson were in about the same place in the first half.
Year 4 is where things became unforgivable. Trea Turner had a monster first half so he was voted in as the starter. Ok, fine. They put Elly de La Cruz in because he was exciting. Ok, fine. But then they also decided to put CJ Abrams in as a reserve instead of Lindor. And they didn’t have to because they also put Kyle Finnegan on.
Richardson’s low career WAR is interesting in contrast to the opponent’s second baseman in that 1960 World Series. Mazaeroski, too, was a great defender, good enough that his career 30.9 fWAR was deemed HOF worthy. Since WAR presumably captures defense, how were their fWAR numbers so comparatively low?
Of course, one reason RIchardson’s career WAR was so low was his career was so short. His first four years he lost playing time to Gil McDougald (whose 39.7 fWAR in only ten seasons probably merits some HOF consideration). And Richardson retired when he was 30, wanting to spend more time with his family.
While alien stats perhaps don’t belong on this site, Richardson’s career bWAR is 8.1, slightly more than his All-Star appearances.
Shouldn’t we acknowledge that the strike zone is actually more than 5.5″ wider than 17″. IIRC, most of the ABS decisions involved the width of the ball.
So with the height of the strike zone being percentage of the batter’s listed height couldn’t that mean that their strike zones are getting larger particularly hitters with larger crouches? Also what about players with longer legs and a shorter torso?