
How Productive Were Those Outs?
I’ve long been interested in measuring the value of making an out. Different outs count differently, and yet pretty much every baseball statistic you can imagine ignores that fact. I’m not just talking about advanced ones like wRC+ or wOBA, though those do indeed treat all outs as equal. I’m talking about basic things like batting average, on-base percentage, and slugging percentage. No one says, “Well, he batted .320, but some of those outs were in bad situations, so it was more like batting .313.” That’s not how we think about offensive statistics.
But just because we don’t count outs differently doesn’t mean that they all have the same value. This is obviously true. Striking out with a runner on third and fewer than two outs is a tragedy. Hitting a run-scoring groundout in the same situation gets the batter a long series of fist bumps back in the dugout. But when it comes to wRC+ or batting average, that distinction doesn’t show up.
There are good reasons for existing statistics to work the way that they do. Batters don’t control who’s on base and how many outs there are when they come to the plate. They don’t control whether there are fast runners on base, or whether the outfield has arms so weak that anyone could score from third base on a fly ball. In the same way that a home run is a home run is a home run, statistics that try to measure batter skill treat all outs the same. But still… I wanted to know more.
At the beginning of this year, I tested out a method for measuring the differing value of outs based on situation. The idea was simple: compare each out a hitter made to the average run value of making an out in that situation. Imagine our situation from above, a runner on third with only one out. The average out in this situation costs a team 0.28 runs in expectation. A strikeout, meanwhile, costs nearly 0.6 runs; with a runner on third and one out, teams score about one run the rest of the inning on average, but they only score around 0.4 runs after reaching two outs with a runner on third. On the other hand, a sacrifice fly increases run expectancy by around a tenth of a run. A run scored, after all, and there are still more chances to score in the inning, even if having the bases empty with two outs isn’t that attractive of a spot.
I applied this logic to every single out from the 2025 season. In our example above, a player who hit a sacrifice fly would get credited with +0.38 runs; the average out costs 0.28 runs, and theirs instead added 0.1. A player who struck out in that situation would get debited 0.32 runs; his out was worse than a random out when it comes to run scoring.
I had to make a few decisions about how to handle corner cases, like whether you should credit some portion of a sacrifice fly for every fly ball or look at the specific outcomes, and I made some changes to the methodology with more time to look at it. I mostly tried to stick to exactly what happened on the field. I did have one exception, though: TOOTBLANs. I scraped the database for situations where a baserunner made an out that was unconnected to the batter’s action; think a runner thrown out trying to go first-to-third, or the equivalent. It feels unfair to dock the runner for that one when it’s really the baserunner’s fault, so I specifically excluded action that happened after the fact. I also ended up including plays where a batter reached on error, though I could imagine removing those. My logic was that since we’re excluding those in our calculation of wOBA, hitters need to get credit for being fast enough to reach base somewhere. It’s an out in their batting line, so I think it qualifies for inclusion here.
The whole point of this analysis, more or less, is to account for double plays. Hitting into a double play is so much worse than an average out that it makes every other out look good by comparison. And avoiding hitting into double plays is definitely a skill. If you don’t measure that specific skill, you’re missing something about baserunning, so I was very focused on making sure that the accounting there worked right.
With this methodology in hand, a few things should be true. First, the total OAR (out advancement runs, my clunky attempt at a backronym) should be zero. Second, there should be a ton of variation in this statistic from one year to the next. Third, strikeouts should be really bad. When we’re including the chance of reaching on an error, they’re much worse than other types of out. You could imagine a different accounting of this metric where we put reaching on error into wOBA and then exclude it from this calculation, but I wanted to include it here. All of those things were true, so I declared it ready to put in an article.
With that introduction out of the way, let’s get to the data. I think you’ll be absolutely stunned to see the top of this leaderboard:
| Player | OAR | Outs Made |
|---|---|---|
| Julio Rodríguez | 8.83 | 455 |
| Juan Soto | 8.70 | 420 |
| Jose Iglesias | 8.56 | 229 |
| Pete Crow-Armstrong | 7.84 | 453 |
| Kyle Isbel | 7.53 | 281 |
| Ramón Urías | 7.39 | 270 |
| José Caballero | 7.14 | 236 |
| Trent Grisham | 7.02 | 374 |
| Fernando Tatis Jr. | 6.76 | 427 |
| Taylor Walls | 6.51 | 218 |
| Adolis García | 6.26 | 390 |
| Luis Arraez | 5.99 | 444 |
| Bo Naylor | 5.77 | 294 |
| Geraldo Perdomo | 5.70 | 433 |
| Abraham Toro | 5.62 | 190 |
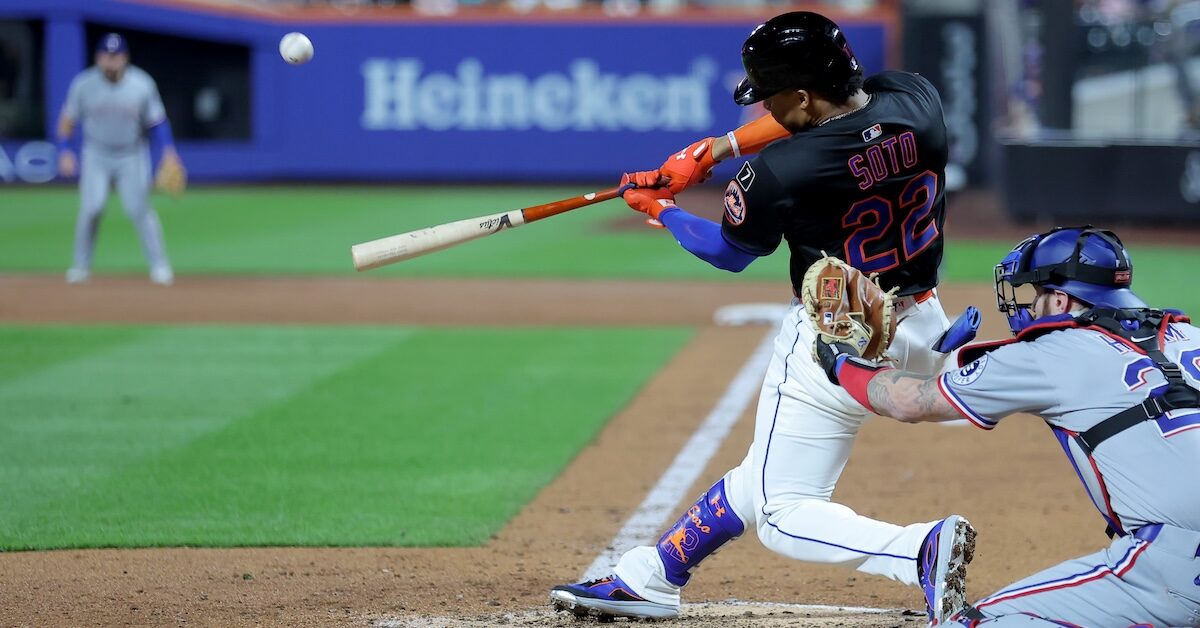
We’ll get back to the actual leader in a minute, but the guy ranked second caught my eye first. Ah yes, Juan Soto, master of the productive out. But it’s true! Soto’s outs were pretty dang good for the Mets in 2025. The real key to Soto’s success is what he did with a runner on third and fewer than two outs. In that situation, you know what’s coming: The pitcher is going to try his hardest to record a strikeout. Soto made 20 outs with a runner on third base and fewer than two outs. Exactly three of those outs were strikeouts. That’s roughly half the league average rate. That’s a big tailwind right from the jump. In fact, getting the runner home from third, which Soto did 14 times out of 20 outs, accounted for more than half of his positive OAR value. Soto really was adept at driving in the runner from third this year.
You might expect Soto to give a lot of that value back by hitting into double plays. He’s slow and he doesn’t strike out all that often, so surely he’s a disaster with a runner on first base. He did hit into 17 double plays, it’s true. But Soto also batted in a ton of double play situations, and his double play rate is roughly average; he hit into a lot because he had a lot of chances. Meanwhile, he reached on several errors in those situations, and advanced plenty of runners with fly balls, what with him rarely striking out and all. His out value with a runner on first and fewer than two outs was actually slightly above average after blending all of those together.
With that oddball leaderboard placement out of the way, we can talk about the actual leader, Julio Rodríguez. He does a lot of things that scream productive out to me. When he puts the ball in play, he’s so fast and hits it so hard that he frequently reaches on errors. He struck out a bit with runners on, but not at a ghastly rate. He cashed in plenty of sacrifice flies, which I attribute partly to his power; the average Rodríguez fly ball is deep enough to score a lot of runners.
In fact, we can break down the run value we’ve been looking at into groundouts, fly outs, and strikeouts. There aren’t a ton of players who have positive strikeout value, which makes sense, but the best hitters of 2025 consistently did better than league average when they made outs on the ground:
| Player | OAR | OAR (Fly) | OAR (Ground) | OAR (K) |
|---|---|---|---|---|
| Julio Rodríguez | 8.83 | 2.76 | 6.26 | -0.20 |
| Juan Soto | 8.70 | 3.88 | 5.53 | -0.71 |
| Jose Iglesias | 8.56 | 0.88 | 7.98 | -0.29 |
| Pete Crow-Armstrong | 7.84 | 2.99 | 6.90 | -2.05 |
| Kyle Isbel | 7.53 | -1.16 | 9.06 | -0.37 |
| Ramón Urías | 7.39 | 4.30 | 3.20 | -0.12 |
| José Caballero | 7.14 | 0.39 | 8.46 | -1.71 |
| Trent Grisham | 7.02 | -0.21 | 8.62 | -1.40 |
| Fernando Tatis Jr. | 6.76 | 0.89 | 6.41 | -0.54 |
| Taylor Walls | 6.51 | 1.74 | 6.03 | -1.25 |
| Adolis García | 6.26 | 3.69 | 2.91 | -0.34 |
| Luis Arraez | 5.99 | 2.08 | 3.88 | 0.02 |
| Bo Naylor | 5.77 | 2.20 | 4.25 | -0.68 |
| Geraldo Perdomo | 5.70 | 2.90 | 3.52 | -0.72 |
| Abraham Toro | 5.62 | 1.14 | 4.91 | -0.43 |
Meanwhile, the bottom half of the leaderboard made me run my numbers a few times to make sure that I wasn’t putting my thumb on the scale to disadvantage the Rockies:
| Player | OAR | OAR (Fly) | OAR (Ground) | OAR (K) |
|---|---|---|---|---|
| Hunter Goodman | -13.30 | -3.52 | -4.55 | -5.23 |
| Jordan Beck | -13.20 | -2.96 | -4.18 | -6.06 |
| Spencer Steer | -10.87 | -2.26 | -3.85 | -4.75 |
| Brenton Doyle | -10.21 | -1.17 | -3.77 | -5.27 |
| Ryan McMahon | -9.86 | -1.81 | -3.29 | -4.77 |
| Elly De La Cruz | -9.48 | -1.78 | -3.67 | -4.03 |
| Tyler Freeman | -9.42 | -2.09 | -5.73 | -1.60 |
| Mickey Moniak | -9.14 | -2.96 | -3.10 | -3.09 |
| Salvador Perez | -7.98 | -1.30 | -3.82 | -2.85 |
| Michael Conforto | -7.33 | 0.34 | -6.49 | -1.18 |
| Kyle Farmer | -7.27 | -1.29 | -4.20 | -1.78 |
| Bryan Reynolds | -7.26 | -0.23 | -4.42 | -2.62 |
| Michael Toglia | -7.20 | -0.36 | -3.16 | -3.67 |
| Tyler Soderstrom | -7.16 | -0.73 | -4.82 | -1.62 |
| Dane Myers | -6.90 | -0.95 | -4.93 | -1.02 |
Goodman was a fun success story this year. He also grounded into about as many double plays as Soto, but in 33% fewer chances. With a runner on third base and fewer than two outs, he made 20 outs, and the runner only scored seven times. One of those was even a run-scoring double play. If you’ll recall, Soto cashed in 14 of his 20 opportunities. In other words, Goodman’s offensive game is weak in two ways that wRC+ doesn’t measure but that definitely correlate with scoring runs. Beck’s outs with a runner on third were even less productive; he made 11 outs in those situations, and the runner only scored twice. One of those was even a double play.
I’m not here to tell you that these leaderboards are perfect encapsulations of skill. In fact, I very much want to caution against that interpretation. There’s a lot of variation from year to year. The r-squared of this metric is about 0.09, meaning 9% of variation in year two can be explained by variation in year one.
On the other hand, it’s pretty clearly measuring something. With my new methodology, Rodríguez has finished first in baseball for two years running (Corbin Carroll was first last year under the old method of calculating OAR, dropping to sixth using the new method). Ryan McMahon made very unproductive outs in Colorado in 2024, made very unproductive outs in Colorado in 2025, and then went to New York and made yet more unproductive outs. There’s a ton of noise here, but there seems to be signal too.
Here, as usual, is a full leaderboard for 2025. I’m curious to hear what you, the reader, make of this statistic. I myself am unsure about how to use it. On the one hand, it definitely measures something that happened in the game. On the other hand, I’m not sure how much of it is actually skill-based and how much of it is just noise. We ignore a lot of things that happen on a baseball field that we all agree don’t really matter when it comes to measuring player skill. I’m unsure whether this is one of those things. It’s undoubtedly interesting, though, and I hope you’re as fascinated by the list as I was.
Ben is a writer at FanGraphs. He can be found on Bluesky @benclemens.
This is an incredible tool to use for narrativeball, though I can’t say I think there’s much actual utility here.
The repeat leaders suggest there’s utility.
It is narrative, but I’ll say this leaderboard’s suggestion towards ‘knows ball’ is strong. You need the awareness to know the assignment in the situations laid out and the physical ability to execute. Juan Soto (almost) leading a stat meant to measure hit tool is not surprising.
I have to comment Ben. I love your analysis. I am definitely showing my age, but the one common denominator that bothers me in the current game is giving up productive outs for what seems to be three outcomes. Unless you are Aaron Judge or another player at the top of your game, it often seems counterproductive to me. “Small ball” has to a large extent disappeared … trying to hit to the opposite field for example with a right handed hitter, The player should want a hit, but at least make contact and move the runners along with less than two outs. (So laments this old guy! 🙂 _
It’s going to be hard to accumulate any positive value if no one is on base — the best you reasonably can hope for is a wash (there’s going to be some ROE in there, but otherwise, 0). So you don’t really have anything balancing out the negatives when the team OBP is .293. (This is especially true of the better hitters the Rockies have — if they’re the ones dragging the OBP up…) Hence, all the Rockies.
Team OBP can’t explain all of it. The Angels and Guards also had a team OBP under .300 and they don’t have any players on the list. The Rockies had 8!
The Colorado 8
Their names and portraits should be put up in every shop like writers of bad checks.
Clearly the Rockies should sign Luis Arraez this winter. All those balls in play and productive outs are exactly what the team needs.
He should DH and bat second.
tbf they probably should. not sure he should get a guaranteed contract, but if his skillset will play up anywhere it is at coors
It’s also hard to accumulate the really bad negatives (double plays, Ks with men on 3rd, etc…) when no one is on base.
I would be curious to see some of these normalized on a per-opportunity basis to clear up some of that context dependency.
It would be great to have the team listed for each player in the spreadsheet. Which makes me wonder what aggregate scores for each team would show. Does it just show you which teams are good? Could at least highlight which players deviate most from their team’s avg.
I really like this idea, because I hate that all outs are treated equal by advanced metrics. I get that a batter does not control who, if anyone is on base, but a strikeout still offers nearly no possibility of positive value. The low year-to-year r^2 probably speaks to the lack of control the batter has on some of this. I wonder if there is a way to correct this statistic to control for the opportunities a batter had? I imagine this being a cumulative stat and different teams being better or worse contributes to the low r^2. A Rockies hitter could be the best productive out guy around, but score poorly on this metric because he did not have the opportunities due to the Rockies being last in OBP.
I would expect that normalizing for opportunities might bring up the r^2. 0.09 is pretty low, though, so probably not enough.
A lot of this is probably like RBI conversion rate or clutchiness, and not really anything but descriptive.
I’d be very interested to see what this looks like at the team level
Two responses. (1) Could you edit the charts so that the columns are sortable? I’d love to be able to see who the leaders and laggards are in each of the three OAR categories, not just the total. (2) If I understand your methodology, these OAR runs would not be reflected in wRC+ or WAR statistics. What if they were? Is there a case to be made to adjust wRC+ and WAR to include “productive out” runs to get a better sense of a player’s (or team’s) “true” offensive production and “true” win value? What would those leaderboards look like?
Well, the immediate problem you’d have is that wRC+ (and rBat+, which is part of B-Ref’s WAR calculation) aren’t context dependent, so it’s a bit awkward there.
That having been said, there’s a parallel in how reliever WAR is adjusted by LI, but I don’t think it makes sense in this context. If you were using something akin to RE24 as your basis, including the out values makes more sense.
Arraez being the guy with positive OAR on Ks made me laugh out loud.
Looking at the leaderboard, there’s a few dozen others with positive value on strikeouts (68 in total, with a few more at exactly 0 because they got very few plate appearances and didn’t strike out it any of them), led by Victor Robles at 0.54 (in a fairly small sample of outs). I assume to get there you have to really disproportionately not strike out in situations where a K is really bad and strike out more in situations where it’s less bad than an average non-K out, which presumably means striking out a lot in double play situations, especially if there’s a runner on only first base, in which case the other types of out are less likely to advance a runner and certainly won’t score a run.
Also, I don’t know how meaningful this, but the top of the K-OAR leaderboard is as overpopulated with Mariners as the bottom of the overall leaderboard is with Rockies. They make up 4 of the top 5, 8 of the top 11 (in addition to Robles, there’s Young, Raleigh, Polanco, Arozarena, Bliss, Canzone, and Mastrobuoni), and have an a total of 12 batters who managed positive run value on their K’s, often over fairly small sample sizes (Samad Taylor for instance, who had 9 PA’s on the year and only one strikeout, gets .075 runs of value for that strikeout because it happened with one out and runners on first and second).
The funniest name to show up in the positive section of the K-OAR leaderboard is Shinnosuke Ogasawara, and if you’re wondering how a relief pitcher ended up there, it’s because he had to bat one time after the Nationals lost the DH, left the bat on his shoulder for three pitches, and got positive value for the strikeout because it was a double play situation. He’s not the only pitcher that happened to because Trevor Rogers also has positive run value for similar reasons (he actually got it for two strikeouts, both of which happened with the bases empty, which… actually leaves me slightly confused about how he could get positive value for that), but he’s the only reliever it happened to.
So Michael Conforto was even worse than his statistics would seem to indicate.
I love this stat because it finally gives credit to guys getting on base due to error. IMHO OBP should include getting on base due to error.
Fantastic work Ben! Love an attempt to quantify these skills.
There’s still some undiscovered terrain currently held under the ‘we can’t measure it so we’re not sure it exists’ banner.
Pitchers can influence quality of contact and batters can adjust their approach for “productive” outs.
Yet more evidence to argue against the Padres deployment of Arraez. Of the 154 games he played this season, this was his place in the batting order:
9th — 1x
7th — 3x
4th — 9x
1st — 11x
2nd — 130x
“Slappy hitter in the 2-hole” is retrograde lineup construction at its most egregious. Maybe Shildt would have had Arraez hit third if he had a proper Cristian Guzman to hit second.
This is giving me “royals bat alcoves Escobar lead off and Omar infante second for two years of actual contention” flashbacks
It makes sense to me that Rockies would come up a lot on the low end. A hit ball travels slightly faster there. That increases hits and errors on caught balls, but gives the fielders more time once the ball is caught.
Loved this article. So fun. Great work.
This is really interesting (hadn’t realized Soto was so effective with his batting outs, or that Luis Arraez’s rare strikeouts actually help the offense), but I got stuck on one detail:
“Corbin Carroll was first last year under the old method of calculating OAR, dropping to sixth using the new method”
I hadn’t noticed Carroll on the list, and sure enough, he’s not there. Looks like your spreadsheet has him 86th? Or else I’m missing something…
Meg and I went back and forth on how to say this, but I was trying to say that when I did this exercise last year, Carroll had the top OAR. I’ve changed the method a bit, so now his 2024 season shows up as sixth, not first. But in 2025, he was a lot worse, yeah
Team Leaderboard would definitely be interesting. Have to imagine the Brewers would be up near the top. They were 7th in sac flies, 6th in sacrifice hits, and 3rd in reach on error with the 8th fewest GDP.
Individual players’ OAR…Contreras (+5.29), Turang (+5.22), Durbin (+4.32), Collins (+4.32), Chourio (+4.26), Yelich (+3.95), Frelick (+3.49), Ortiz (+3.32), Perkins (+2.37), Rhys (+1.48), Bauers (+0.08), Monasterio (-0.13), Vaughn (-1.80).
As a Brewers fan, I was curious how they did as a team; I anticipated that they would show up as pretty good because they are fast and tend to put the ball into play. Sure enough, not a single Brewer had a negative number! Explains somewhat how they scored the 3rd most runs while having something like the 22nd most home runs.
Great article, Ben!
I’m very curious about how players performed compared to a baseline of average value for the kind of out they made. That is, calculate average OAR for fly balls, ground balls, and Ks; for each batter figure out what their xOAR would be based on their fly ball/ground ball/K distribution; and see who underperformed or overperformed. If someone is managing to make more contact when contact is good, that might show up here.
(For the purposes of this exercise maybe foul outs should go in with Ks, since they can never be productive except for the rare deep foul flies that advance runners.)
It does make sense that Taylor Walls is on this list. He makes so many outs at the plate that at least some of them have to end up being productive.
Some should let him know that there’s no such thing as a productive out when there’s already two outs in the ninth inning, though.
Super interesting!
My main question would be the relationship between this stat and RE24-wRAA – I’d guess this measures a specific component of that total?
LOVE this and think it’s a reasonable way to assign value. Soto and Julio are worth almost a win more when considering these things!