Saber Seminar Tickets Now on Sale

This is my favorite nerd-conference event of the year, and I’m looking forward to participating once again. If you’re in the Boston area that weekend, this is a must-attend conference, and if you’re not in the Boston area, you should think about coming anyway. It’s a blast, and raises tens of thousands of dollars for cancer research at the same time. I give it my full endorsement. Come hang out with us.

Tickets are now on sale for Sabermetrics, Scouting, and the Science of Baseball 2015.
They can be purchased through Ticketleap by following the link.

This year’s conference will happen August 22nd-23rd in Boston, MA, at Boston University’s Jacob Sleeper Auditorium. Our keynote sponsors are FanGraphs and Baseball Prospectus.

We’ve assembled a stellar cast of speakers from across MLB and the baseball research community. We’ll have demonstrations from the bleeding edge of performance-enhancing technology. And we’ll have a fun, friendly, community event that raises a ton of money to fight cancer.

Tickets are only $140, with special prices of $65 for full time students. The best part of this exceptionally well valued ticket is that 100% of our ticket proceeds go directly to the Jimmy Fund, a Boston area charity that funds cancer research and patient wellbeing.

For more information including a growing list of speakers, directions to the event, and full pricing information, please visit our website at saberseminar.com.

We work very hard to make Saberseminar the most entertaining, thought-provoking, and charitable baseball event of the year. Come join us in Boston this summer!


A Fun Fact Illustrative of the Marlins’ Plight

On Sunday, the Miami Marlins fired their manager, Mike Redmond, barely half a year after he received votes for the 2014 NL Manager of the Year. Coupled with the cut and forthcoming salary-eating of Jarrod Saltalamacchia and his contract, and now the, uh — promotion? demotion? — of general manager Dan Jennings to manager, it’s been a mighty volatile season in Miami. This is a lot of action before Memorial Day: what this team will do in July is anybody’s guess.

During last Friday’s game at home against the Atlanta Braves, which the Marlins would lose, the Miami broadcast team shared a fun fact that rather unwittingly illustrated the team’s lack of continuity and talent. After Giancarlo Stanton hit two home runs earlier in the game, the broadcast team reported that Stanton was the leader in home runs hit in beautiful Marlins Park, established 2012, with 59 — a number that Stanton has since increased to 60, since he is a mighty man.

All’s good so far! Where the fun fact started to unravel was when the identity of the second-most-prolific-homer-er in Marlins Park was revealed. That man is Marcell Ozuna. Which, sure, Ozuna is a promising young talent, but his total of 12 home runs hit in Marlins Park seems something like a typo and something like a piece of trivia from the Deadball Era.

What the broadcast team did not reveal, but which I very much wanted to know, was the remainder of the leaderboard for most home runs hit in Marlins Park. And, thanks to BaseballSavant, I have it.

Tied for third place, with seven homers apiece, is Garrett Jones (a Marlin in 2014), Justin Ruggiano (2012-2013), and Hanley Ramirez, who only called Marlins Park his home for the first 93 games of 2012.

Where the list gets really hairy is if we look at the three players who are tied with six homers apiece. One of them is Saltalamacchia, who is let’s say unlikely to be remembered fondly in the annals of Marlins history. The other two are Ryan Zimmerman and Evan Gattis. The presence of both of these players so high on this list is notable because — and your memory is serving you correctly here — neither of these players have ever been employed as Miami Marlins.

By playing a handful of games instead of half of their games annually at Marlins Park, Zimmerman and Gattis should, under normal circumstances, be nowhere near this close to the top of this leaderboard, especially considering that Gattis did not make his big league debut until 2013, and Zimmerman only managed five total homers in a weak 61 games in 2014. But when, of course, have the Marlins provided a set of normal circumstances?


Yankees Promote a Healthy Slade Heathcott

With Jacoby Ellsbury out of action for at least the next couple of weeks with a knee sprain, the Yankees called up former first round draft choice Slade Heathcott to help fill the void in the outfield. If it feels like you’ve been hearing about Heathcott for a while now, that’s because you have been. The Yankees took Heathcott 29th overall out of high school way back in 2009, but it’s taken him until now — at age-24 — to crack the major leagues.

Heathcott’s extended stay in the minor leagues hasn’t been due to a lack of talent, but has been almost entirely the result of injury. Slade’s spent an awful lot of time on the shelf since he was drafted back in 2009. Here’s a look at his lengthy injury history courtesy of Baseball Prospectus. Read the rest of this entry »


Nationals Promote Wilmer Difo for Some Reason

A few weeks ago, the Padres promoted one of their best remaining prospects, Austin Hedges, to join the Major League club to serve as Derek Norris‘ backup. It was a bit of an odd move, given that Hedges might have just been figuring out how to hit professional pitching, but the Padres wanted to upgrade their roster and saw more short-term value in having Hedges catch a couple of times per week in the big leagues.

Well, apparently, the Washington Nationals are going to try a similar trick, as Ken Rosenthal reports that the team is promoting infield prospect Wilmer Difo, with outfielder Jayson Werth potentially heading to the DL.

Difo spent all of last year in low-A ball, started this year in high-A, and was promoted to Double-A a few weeks ago. He’s consistently hit well, showing both contact and some power, but he has a grand total of 33 games above low-A ball in his career — even though he just turned 23 — so to say it’s been a quick rise would be an understatement. But now the question is what the Nationals are going to do with him?

Shortstop is blocked by Ian Desmond, who while struggling at the moment remains one of the best players at the position in the game. Yunel Escobar has hit well while playing both second and third base, but has primarily settled in at third in Anthony Rendon’s absence, leaving second base to Danny Espinosa, who is also hitting far better this year than he has in prior years. Neither Escobar nor Espinosa need replacing, so Difo is apparently coming up to serve as a utility infielder until Rendon returns, at which point the team won’t even need him in that role.

Difo is an interesting player, and could potentially be a starter for the Nationals as soon as next year, but he doesn’t have a clear role on the 2015 Nationals, and having him sit on the bench in the big leagues isn’t going to help speed up his development. I’m not entirely sure why promoting a prospect to sit on the bench is becoming a trend, but it probably shouldn’t be. In the end, this likely won’t matter much at all, but it’s a little weird to see another prospect promoted at a time when the big league team doesn’t need him to actually play.


Bryce Harper and Miguel Cabrera, at 22

Bryce Harper continued terrorizing Major League pitching yesterday, coming a double short of the cycle against the Padres. For the season, he’s now hitting .338/.476/.729, good for a 215 wRC+, and it seems pretty clear that we’re seeing the breakout season of a truly elite hitter. As Jeff Sullivan noted a couple of weeks ago, Harper has made some significant changes this year, and now that he’s pulling the ball and getting it into the air with regularity, he has turned his raw power into high-level production.

He won’t keep this up all year, of course, and will eventually return to human levels of production. But it’s worth noting that even when he does, Harper will have essentially replicated the first couple of years of Miguel Cabrera’s career. Here are their career numbers through age-22.

Name PA BB% K% ISO BABIP AVG OBP SLG wOBA wRC+
Bryce Harper 1659 12% 22% 0.212 0.324 0.278 0.364 0.490 0.369 134
Miguel Cabrera 1716 9% 21% 0.223 0.343 0.300 0.366 0.523 0.377 131

Miggy’s age 20-22 seasons came from 2003 to 2005, so while his unadjusted numbers are slightly better, Harper actually has been more productive at the plate when you add in today’s pitcher-friendly run environment. And, of course, Harper’s line is still predominantly made up of his data from ages 19, 20, and 21, with only six weeks of his age-22 performance mixed in.

If we add in the Depth Charts rest-of-season forecast for Harper — which calls for him to hit .287/.382/.524 for the rest of 2015 — in order to create an expected line through his complete age-22 season, Harper’s career numbers would be .280/.368/.497, with a .373 wOBA and a 136 wRC+. The full list of hitters in baseball history that stepped to the plate 2,000 times by the end of their age-22 season and put up a 136 wRC+ or better? Mike Trout (165), Ty Cobb (159), Mickey Mantle (149), and Mel Ott (147). Ken Griffey Jr was at 134. Alex Rodriguez was at 130. As noted, Cabrera was at 131, and in fewer plate appearances, which skewed his numbers more towards his more developed years.

Bryce Harper is pretty, pretty good.


WAR Diagram: Position Players

Wins Above replacement (WAR) is probably the best known composite statistic that attempts to estimates the entire value of a player to a team in a context-neutral and park-adjusted environment. It is also an incomplete model, and while we’re always trying to make it as comprehensive as possible, that does require updating the formula from time to time; just this past March we added a few more things to try and make it even better.

In an effort to increase understanding of the all the factors that go into calculating WAR, I have created the following diagram to the various player statistics and league average values which have gone into the calculation. Our goal is to always make the process as transparent as possible, and hopefully this infographic can help on that path.

DISCLAIMER: This diagram is meant to summarize the process of calculating WAR, it does NOT contain every detail necessary to accurately perform that calculation. For a full description of the formulas and equations please see the library page, which more fully explains the process.

WAR_Diagram_V03

The very left of the diagram contains the stats which are the basic building blocks of WAR. These include the familiar walks, singles, doubles, triples, and home runs along with the alphabet soup metrics: UBR, wGDP, UZR, and RPP. Most of the latter stats are built on proprietary data, so you won’t be able to calculate our version of WAR from scratch yourself, though you could substitute your own fielding and baserunning metrics.

The right side contains the finished product, a player’s WAR components. The oval shapes represent inputs, while the rectangle shapes represent calculated components which are steps along the way to get WAR.

The WAR diagram is divided into six component areas: Batting, Base Running, Replacement, League, Positional, and Fielding. Four of those six areas also fall under either the Offensive or Defensive region, which are the greatest differentiators of talent. These areas represent different WAR component stats we host on FanGraphs in our Value section on our leaderboards.

The runs from the six areas are aggregated to yield runs above replacement (RAR), which is then converted into wins using each year’s specific R/Win ratio, and that resulting value is WAR.


A Brief Report on Junior Guerra, the 30-Year-Old Prospect

Even for those readers who regard Gary Huckabay’s contention from the late 90s that there’s no such thing as a pitching prospect — even for those who regard it as perhaps an exercise in hyperbole, the notion of a 30-year-old pitching prospect likely sounds absurd. Prospectdom, first of all, implies some degree of future potential, which itself implies some degree of youth. And second of all, what information exists regarding aging curves suggests that, if a pitcher wasn’t a prospect at 20 or 25, there’s little reason to suppose that he would be at 30, with years of abuse behind him already.

And yet, in the absence of that word (i.e. prospect), there’s a shortage of appropriate terms for what White Sox right-hander Junior Guerra is. At 30 years and 118 days, he’s made zero major-league appearances. Indeed, he recorded his first Triple-A appearance* just last Thursday. His rookie eligibility, in other words, is not in question. And yet, as noted in yesterday’s edition of the Fringe Five, Guerra has produced one of the top strikeout rates among all qualified minor leaguers while also exhibiting sufficient arm speed to suggest that his success isn’t the product merely of deception or veteran wiles.

*Affiliated Triple-A appearance, that is. Guerra played for Yucatan of the Mexican League in 2012, where he produced an unambiguously poor 20:22 strikeout-to-walk ratio in 28.0 innings.

Guerra made his second Triple-A appearance ever shortly after that newest installment of the Fringe Five was published. The purpose of this post is to report the absolutely most basic information regarding that start — and, probably mostly, to provide more footage of Guerra’s repertoire.

Read the rest of this entry »


Basic wOBA Equation

Here at FanGraphs and RotoGraphs, I occasionally delve into articles that look at split-data, and have had to create a simplified version of our wOBA formula in order to generate some numbers where wOBA isn’t easily available.

wOBA is simply a rate-stat version of a linear-weights calculation, but because the relative values of events change according to the run environment, the value of the different types of outcomes that go into the formula change from season-to-season. This is why why we publish the guts of wOBA, so that you can see exactly how to calculate wOBA for any given year.

But if you’re looking at multiple years including different run environments, it can be helpful to have a basic wOBA formula that gets very close to the results for any individual year, but includes static values and a set formula. To that end, I’ve created what I call Basic wOBA, which does exactly that; follows the year-by-year wOBA shifts very closely without needing to update the variables for each season. We’re not rolling this out as an official version of wOBA, and it won’t appear on the site itself, but it will be referenced occasionally in articles, and so it is helpful to have the formula listed as a reference for when it is called upon.

After some testing, here is the equation we decided to use:

Basic wOBA = (.7* (BB + HBP) + .9*1B + 1.25*2B + 1.6*3B + 2*HR)/PA

Looking back at players with more than 200 plate appearances since 1980, the R-squared between the actual wOBA and Basic wOBA is 0.986, with a value of 1.0 being a perfect 1:1 relationship. So while not perfect, it will give a nearly equal value in almost every case.

If you see Basic wOBA referenced in an article, this is the formula that isbeing used.


Acquaint Yourself Now with Noah Syndergaard’s Curveball

Giant Dutch- and/or Danish- and/or Texan-American Noah Syndergaard is at this moment making his major-league debut for the New York Mets in Chicago. One thing he’s exhibited with considerable frequency over the course of his inaugural start is a fastball at ca. 94-98 mph. Another thing is what Branch Rickey would probably have referred to as “hella moxie” were he (a) still alive and also (b) a resident of California’s Bay Area for some reason.

The purpose of this post is to address neither of those qualities, but rather to document Syndergaard’s first memorable curveball — with which curveball he struck out Cubs shortstop Starlin Castro for the second out in the second inning.

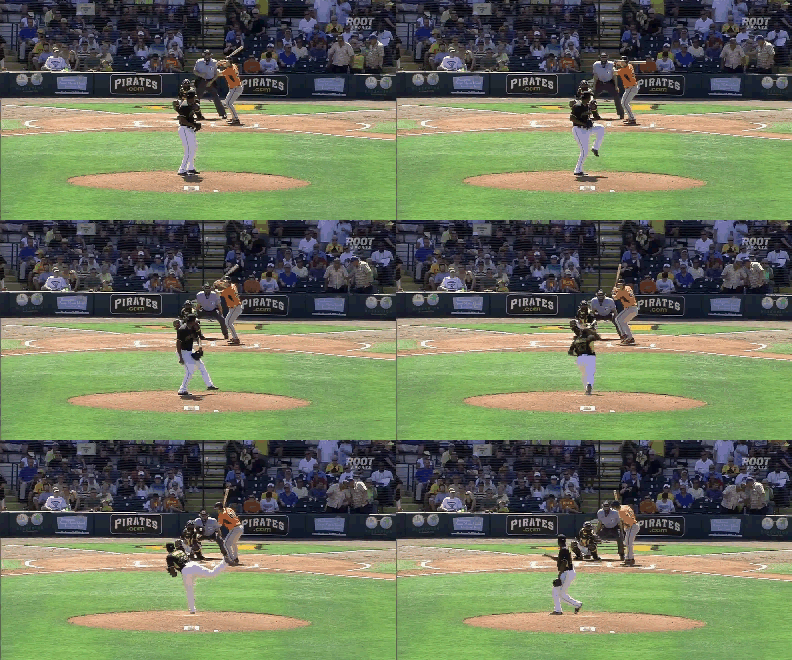
Here, for the benefit of the reader, is action footage of that curveball in real time:

NS Curve 1

Read the rest of this entry »


Job Posting: TrackMan Cape Cod Data & Operations Intern

Position: TrackMan Cape Cod Data & Operations Intern

Location: Cape Cod, Mass.

Description:
At TrackMan Baseball we measure stuff – the speed, spin and movement of pitched and hit baseballs.

We do this using proprietary 3D Doppler radar hardware and software. The majority of Major League teams use our products and services for player development and evaluation. We also work with collegiate, Japanese and Korean teams, premier amateur baseball organizations, broadcasters and equipment manufacturers. Our business is growing fast. By the start of next season we will have a network of radars installed in more than 100 stadiums on three continents, and dozens of remote systems traveling the US.
Read the rest of this entry »