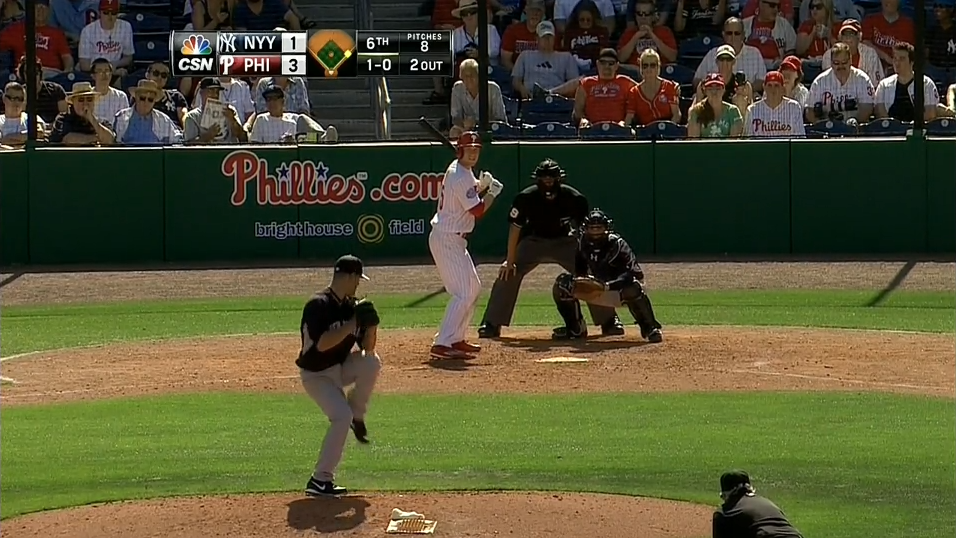
GIF: Actual Prospect Illinois Left-Hander Tyler Jay’s Changeup

On both Friday and Saturday, the author published GIFs here documenting footage from collegiate games less notable for the events captured within those GIFs and more notable for the fact that there were baseball events to be captured at all.

What separates the footage below from that recently featured here is that it depicts a potential first-round selection. According to Kiley McDaniel, Illinois left-hander Tyler Jay was a relative unknown entering the summer but pitched in relief for Team USA and exhibited a “93-97 mph [fastball] with above-average to plus curveball and changeup.” He was ranked 42nd overall by McDaniel among draft-eligible prospects.

Here’s an example of Jay’s changeup from this afternoon’s contest between Illinois and Lamar, which pitch he has utilized to strike out Lamar left fielder Kevin Santana.

Jay Santana Certainly CH SS K

Read the rest of this entry »


GIF: Rice’s John Clay Reeves Homering Unmistakably

Rice University and the University of Texas feature two of college baseball’s most talented teams, according to sources familiar with that particular situation. The two are playing each other this afternoon in Houston, Texas — a game to which, not unlike yesterday’s Villanova-NC State contest, the author has directed his attention mostly to verify that not all the world is blanketed in a crust of frozen terror.

Of some note with regard to this game is Longhorns’ starter Kacy Clemens, issue of the former major leaguer Roger. Also of some note is the home run conceded by Clemens to Rice catcher John Clay Reeves, which unmistakable home run the author has rendered into GIF form below.

JC Reeves HR

Read the rest of this entry »


GIF: NC State’s Cory Wilder Throwing a 93 mph Fastball

The collegiate baseball season has begun this afternoon, and the first of the day’s televised games — at least among those available by way of streaming video from CBS’s College Sports Live — is Villanova at North Carolina State.

What follows is a GIF from that game’s first inning of NC State starter Cory Wilder throwing a fastball at 93 mph — a pitch notable less for its quality (although that oughtn’t be ignored, as well), but more because of what it represents for our pending emergence from that waking nightmare called winter.

Wilder SS

Read the rest of this entry »


eBay’s Five Most Marvelous and Currently Available Ballcaps

It’s become a practice of the present author in recent years to purchase — before FanGraphs’ annual spring pilgrimage to the desert — to purchase a new ballcap in February, with a view towards cultivating within my colleagues a combination of jealously and respect that my actual “work” is incapable of producing.

Last year around this time, I documented the search for such a cap in a progressively more absurd series of posts. The result of that search: the acquisition of a Winston-Salem Spirits cap from 1994 with a weird red sun and melancholy eagle on it.

What follows marks the beginning of this year’s search for a replacement.

To wit:

Cubs ST

Chicago Cubs Deadstock 90’s Hat Vintage Snapback (Link)
Style: Snapback
Time Left: N/A
Cost: US $24.74 (Buy It Now)

Owing to calendar reform instituted by Julius Caesar, the year 46 BC actually lasted 446 days, roughly a third longer than the Roman years which preceded it. As someone who lived through 1997, I’m surprised to find now that the opposite phenomenon isn’t true — i.e. that all of 1997 wasn’t somehow truncated for logistical purposes. In any case, the year was long enough to allow for the production of this sad ballcap, awaiting an equally sad owner.

Read the rest of this entry »


Every Club’s Bonus Pool If Dave Cameron Were in Charge

Last week, writing for Just a Bit Outside, managing editor Dave Cameron advanced a proposal — for roughly the fourth time during his tenure at FanGraphs — advanced a proposal for abolishing the draft, which proposal he examined in greater depth during Monday’s edition of the podcast.

Summarized briefly, Cameron suggests that combining a draft and strict bonus-allocation system for amateur talent is essentially redundant. The league doesn’t need the former if it has the latter. And if it has the latter, extending it to international talent becomes rather easy — certainly easier than installing an international draft.

Summarized less briefly, Cameron suggests this:

[W]hat if there was no draft? Instead, what if we just lumped all new players — foreign or domestic — into a single acquisition system where each player was free to sigh with the team of his choice, only with firm spending caps in place to ensure that young talent flows more freely to clubs that can’t compete on major-league payroll alone? In other words, a team’s talent acquisition budget would be inversely tied to its major-league payroll; the more you spend on big leaguers, the less you get to spend on prospects, and vice versa.

Last year, Major League Baseball gave out combined domestic draft and international signing bonus allocations of $285 million, or $9.5 million per team. Instead of distributing the pools based on prior year winning percentage — which rewards failure and incentivizes teams to lose on purpose — the player acquisition budgets could be increased or decreased based on the percentage of deviation from the league average major-league payroll. Last year, the league average payroll was $115 million, so a team that ran a $150 million payroll would have a 30-percent overage, and would in turn have its new talent acquisition pool decreased by 30 percent.

Below is a table featuring each club’s bonus pools for 2015 were Cameron’s proposal employed. The total overall bonus money is the same, but is allocated according not to where each club has finished in the standings, but to the funds they’ve committed to their major-league roster.

Pay denotes 2014 opening-day payroll; O/U, the percentage of that payroll relative to league average; and xPool, the expected bonus pool amount for the relevant club according to their major-league spending.

# Team Pay O/U xPool
1 Astros $44.5 -61.3% $15.3
2 Marlins $47.6 -58.7% $15.1
3 Rays $77.1 -33.1% $12.6
4 Pirates $78.1 -32.2% $12.6
5 Indians $82.5 -28.3% $12.2
6 Athletics $83.4 -27.6% $12.1
7 Twins $85.8 -25.5% $11.9
8 Cubs $89.0 -22.7% $11.7
9 Mets $89.1 -22.7% $11.7
10 Padres $90.1 -21.7% $11.6
11 White Sox $91.2 -20.8% $11.5
12 Royals $92.0 -20.1% $11.4
13 Mariners $92.1 -20.0% $11.4
14 Rockies $95.8 -16.8% $11.1
15 Brewers $103.8 -9.8% $10.4
16 Orioles $107.4 -6.7% $10.1
17 Braves $110.9 -3.7% $9.8
18 Cardinals $111.0 -3.6% $9.8
19 Reds $112.4 -2.4% $9.7
20 D-backs $112.7 -2.1% $9.7
21 Blue Jays $132.6 15.2% $8.1
22 Nationals $134.7 17.0% $7.9
23 Rangers $136.0 18.2% $7.8
24 Giants $154.2 33.9% $6.3
25 Angels $155.7 35.2% $6.2
26 Tigers $162.2 40.9% $5.6
27 Red Sox $162.8 41.4% $5.6
28 Phillies $180.1 56.4% $4.1
29 Yankees $203.8 77.0% $2.2
30 Dodgers $235.3 104.4% -$0.4*
Average $115.1 0.0% $9.5

*Which is to say $0. Either that, or a $0.4 tax for more than slightly doubling the average league payroll.

This information is relevant today also because, with the Padres’ signing of James Shields, the order and projected pools for this year’s amateur draft are now set. Clubs such as Oakland, Pittsburgh, and Tampa Bay — because of their relative success — are all subject to more restrictive amateur spending limits than their payrolls would otherwise dictate. The Phillies and Yankees, meanwhile, benefit from having played poorly in 2014 despite considerable resources.


Ask the Audience: Cole Hamels or James Shields?

The Padres have had a pretty busy offseason, revamping their outfield around three right-handed sluggers in an attempt to bolster the team’s putrid offense. The pitching upgrades have been more muted, mostly limiting themselves to adding the two most similar sounding pitchers in baseball, in signing Brandon Morrow and trading for Brandon Maurer. Now, though, San Diego seems poised to make another big strike, with James Shields and Cole Hamels lingering as the two remaining fish in the pond.

Shields apparently has a strong preference to pitch on the west coast. Hamels is from San Diego and the Padres are not on his no-trade list. With both pitchers, the team has some leverage, as pretty much every other west coast team has publicly removed themselves from signing Shields, and Shields’ remaining availability gives the team an alternative to caving into Ruben Amaro’s demands. It’s not impossible that a team like the Cubs will swoop in to steal Shields, forcing the Padres to negotiate for Hamels without a safety net, but for today at least, it seems like San Diego could probably pick which path they want to go down.

Financially, the two pitchers probably won’t be dramatically different. Hamels is signed for $96 million over the next four years (or $109 million over five), while Shields is probably looking at a four year deal in the $80-$90 million range. Hamels will cost a little bit more in salary, but the difference is going to be minimal, especially if the Phillies are willing to pick up any part of Hamels’ contract in a trade. So, for A.J. Preller and his staff, the question is mostly whether they think the marginal difference in performance is worth surrendering the talent required to acquire Hamels versus forfeiting the draft pick if they signed Shields.

For reference, here are both pitchers numbers over the last three years.

Name IP BB% K% GB% HR/FB LOB% BABIP ERA- FIP- xFIP- WAR RA9-WAR
Cole Hamels 640 6% 24% 44% 10% 77% 0.293 81 85 87 12.3 14.1
James Shields 683 6% 21% 46% 10% 75% 0.295 84 90 89 12.0 13.2

On a per-innings basis, Hamels has been slightly better, though Shields has thrown a few more innings. Hamels is two years younger and hasn’t shown the downwards trends that Shields has displayed the last few years, and his overall career track record is stronger, especially if you evaluate pitchers by runs allowed. By RA9-WAR, Hamels has been roughly +1 WAR better per season than Shields over his career; the gap is closer by FIP-WAR, but Hamels has reached the point in his career where it’s pretty clear that he’s a bit underrated by FIP.

Hamels is likely to perform better than Shields in both 2015 and beyond, but the acquisition cost appears to be significantly higher as well. So, before A.J. Preller makes his choice, I’ll put this out to you guys: which would you pick? Older and slightly worse but retain your minor leaguers, or go for broke with the better pitcher and a diminished farm system?


Contract Crowdsourcing: Yoan Moncada

As of yesterday afternoon, Cuban defector Yoan Moncada has been cleared to sign with a major-league organization. Kiley McDaniel has provided all the relevant information concerning Moncada — including McDaniel’s own best guesses regarding Moncada’s signing bonus and the club most likely to provide it.

The purpose of this post is to harness the wisdom of the crowds with a view towards estimating the probabilities of various outcomes. Use the ballot below to submit answers regarding various aspects of Moncada’s near and slightly less-near future. Note that estimates regarding Moncada’s bonus should not include the 100% tax for which the signing club will be responsible.


Now Streaming: The 2015 Caribbean Series

Caribbean

The Caribbean Series features the championship clubs from five Latin American leagues: the Dominican Winter, Mexican Pacific, the Roberto Clemente Professional (i.e. Puerto Rican), and Venezuelan Winter — and, as of last year, also the Cuban. This year’s tournament began at Noon ET today (Monday) and extends through Sunday’s championship game.

Telecasts of all the games are available by way of ESPN Deportes and (streaming via) Watch ESPN. For those who lack a subscription to Deportes, however, the Watch ESPN feed is also unavailable. Fortunately, the probably legal stream of CDN Sport Max from the Dominican carries the games, as well, it seems and offers strong video quality.

The champions of Cuba and Mexico are currently playing (box), while Puerto Rico and Venezuela are scheduled for 6:30pm ET this evening. All box scores are available here.


Proposed Pace-of-Play Rule Changes, by the Numbers

When Rob Manfred officially took over as MLB commissioner, he went on a bit of a media tour, explaining his plans to better the game of baseball. Among the things discussed were pace of play and possibly banning the defensive shifts. The latter has been discussed on these pages already, so I won’t get into that. But I do want to dive into pace of play for a bit.

One of the proposed changes involves installing a pitch clock. In fact, the Arizona Fall League was used as a bit of a test case already. The idea seems simple enough. The time between every pitch should last no more than 20 seconds. So, taking what we know about pace numbers and applying that restraint, what kind of change can we expect?

Looking at FanGraphs data from 2014 alone, I took the total pitches and pace data from every pitcher (minimum 10 IP). I took a weighted average of the pace numbers, to try and get as accurate of a number as I could (more weight to the time taken by the guys who throw the most pitches).

Here’s what was discovered:

  • Weighted average of time between pitches: 23 seconds
  • Total pitches logged by PitchF/X in 2014: 704,974
  • 2430 major league games
  • 290 pitches per game

A 20-second pitch clock means three seconds would be lobbed off of every pitch. That’s 870 seconds saved, or 14.5 minutes, or about 8% of the total game time.

If you wanted to get turbo-aggressive, you could turn to MLB rule 8.04:

When the bases are unoccupied, the pitcher shall deliver the ball to the batter within 12 seconds after he receives the ball.

There are a lot of rules that aren’t really enforced these days, but say the new commish wants to flex his newly-found muscle and implement this rule as well.

  • 170,876 total pitches thrown with the bases empty
  • 70 pitches per game thrown with no runners on

If pitchers only had 12 seconds to throw in this scenario, it would knock 11 seconds off each pitch. Over 70 pitches, that comes out to 770 seconds or around 13 minutes. Add in the remaining 220 innings at the usual three seconds a piece, and you get … around 14 minutes. All that math to save about 30 seconds.

So 14 minutes seems to be the magic number — a little less than 8% of total game time. But 8% is 8%, and considering a lot of the other percents (rest of the time to play the game, commercial breaks, pitching changes, etc.) probably aren’t going anywhere, 8% is not an insignificant number. There are certainly other factors to consider, but we’re doing this in a bit of a vacuum.

It remains to be seen what steps will be taken, if any, to increase pace of play. But if it’s done using some sort of time restriction on pitchers, we can expect a maximum of 14 minutes or so to be saved, on average. At least now we know. And I have it on good authority that knowing is around 50% of the battle.


And the Babe Ruth of the SEC

Yesterday, the author published a post intended for an audience of roughly zero readers and purporting to have been written with a view towards identifying the Jose Bautista of the Ivy League. In reality, what the post did was to combine my curiosity about current Ivy League hitters with principles recently introduced by Chris Mitchell on forecasting a hitter’s future major-league performance with minor-league stats.

What follows is a much briefer version of that same thing, except in this case for the 2014 season of the Southeastern Conference.

To review very briefly: for hitters in the low minors (i.e. a level similar to the better collegiate leagues), the metrics most predictive of major-league success (besides age) are strikeout rate (K%), isolated power (ISO), and batting average on balls in play (BABIP). What the author has done is to combine regressed versions of those three metrics into an index stat, where 100 is league average and above 100 is better than league average.

Using that methodology (about which one can read more thoroughly in yesterday’s post), here are the top-10 hitters from the 2014 SEC baseball season by what I’ll continue to temporarily call KATOH+ (in homage to Mitchell’s system). Note that xK%, xISO, and xBABIP denote expected strikeout rate, isolated power, and batting average on balls in play, respectively.

# Player School 2015 Club Pos PA xK% xISO xBABIP KATOH+
1 A.J. Reed Kentucky Astros 1B 290 16.6% .399 .323 217
2 Sikes Orvis Ole Miss Ole Miss 1B 282 17.0% .247 .317 157
3 Sean McMullen LSU Astros OF 249 13.3% .220 .315 151
4 Christin Stewart Tennessee Tennessee OF 241 17.4% .211 .334 149
5 Ben Moore Alabama Red Sox OF/C 273 5.9% .176 .312 144
6 Logan Nottebrok Texas A&M Texas A&M 3B 160 18.1% .217 .308 141
7 Tyler Moore LSU Mets C/1B 178 11.8% .183 .318 140
8 Brian Anderson Arkansas Marlins 2B 287 13.9% .170 .329 136
9 Kade Scivicque LSU LSU C/1B 209 9.1% .163 .317 136
10 Max Kuhn Kentucky Athletics 3B 311 15.8% .170 .335 136

Some assorted observations:

• The relevant league averages for the SEC in 2014 were as follows: 15.1% strikeout rate, .096 isolated power, .319 BABIP. For reference: that’s a lower strikeout rate, almost identical ISO, and higher BABIP than one finds in the Ivy League.

• By this methodology, former Kentucky first baseman and recent Houston second-round draft pick A.J. Reed was obviously the best hitter in the SEC last year. Among other of his exploits, he produced the highest expected isolated-power figure last year by over 150 points. Ruthian, is a reasonable adjective with which to describe that feat. Kiley McDaniel recently ranked Reed 13th among Astros prospects.

• Among returning SEC hitters, Sikes Orvis of Ole Miss produced the top batting line (by this methodology) in 2014. Logan Nottebrok of Texas A&M also deserves some recognition — not only because he occupies a more difficult area on the defensive spectrum than Orvis, but also because his .248 BABIP likely undersold the quality of his season.