Is Popup Rate a Skill?
When I wrote about Mike Soroka this week, I mentioned that he’s one of the best players in baseball at getting popups. Nearly 20% of the fly balls opponents have hit against him have ended up in an infielder’s glove, one of the best rates in baseball. It’s clear that this is a valuable skill for the Braves — a fifth of Soroka’s fly balls are automatic outs. But there’s a follow-up question there that’s just begging to be asked. Does Soroka have any control over this? Do pitchers in general have any control over how many popups they produce?
This is the kind of question where it’s important to know exactly what you’re asking. FanGraphs has a handy column in our batted ball stats, IFFB%, that looks like it cleanly answers what you’re looking for. Be careful, though! IFFB% refers to the percentage of fly balls that don’t leave the infield, not the percentage of overall balls in play. Let’s use Soroka as an illustration of this, because his extremely high groundball rate will make the example clear. Take a look at Soroka’s batted ball rates this year:
| GB/FB | LD% | GB% | FB% | IFFB% | HR/FB |
|---|---|---|---|---|---|
| 2.97 | 22.0 | 58.4 | 19.7 | 17.6 | 2.9 |
Soroka allows 19.7% fly balls, of which 17.6% are infield fly balls. In other words, roughly 3.5% of balls put in play against Soroka this year have been popups. For me, that helps contextualize what we’re talking about. Lucas Giolito has the highest rate of popups per batted ball in the major leagues this year among qualified starters, a juicy 7.4% (in a lovely bit of symmetry, teammate and other half of the Adam Eaton trade package Reynaldo Lopez is second). Eduardo Rodriguez is last among qualified starters at 0.5%. There’s a spread in how many popups players allow, but it’s not enormous.
Before we delve deeper into popup rates and whether they’re a skill, I’d like to take a quick digression to talk about my thought process when I set out to answer questions in this general vein. The first thing I like to do is look for prior research on the same topic. There’s nothing worse than spending thirty minutes thinking up a fun experimental treatment, only to see that Russell Carleton or Jeff Sullivan answered the question years ago. As it so happens, there’s an excellent article at FanGraphs about whether popups are a skill, written by none other than David Appelman.
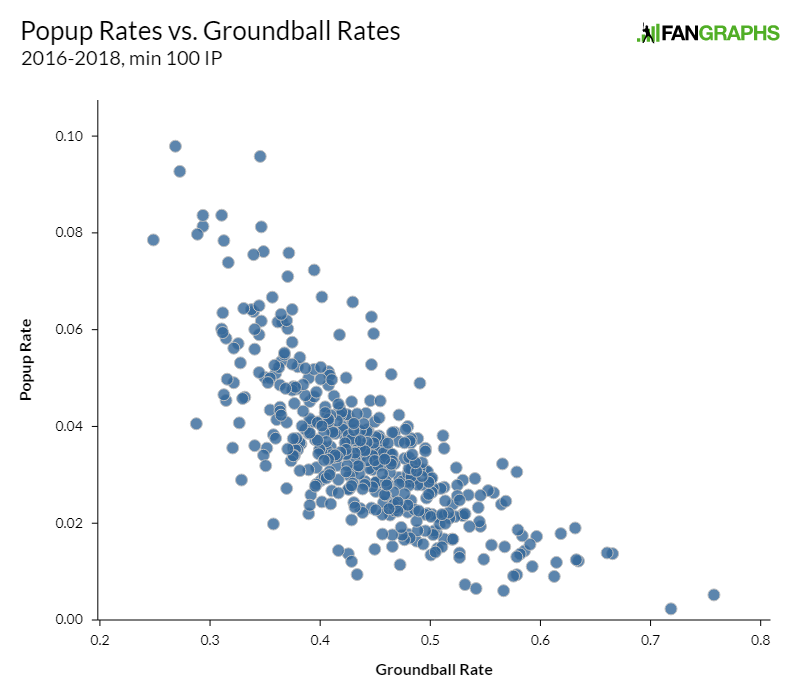
The conclusion of this article is straightforward: popups as a percentage of all balls in play are tied to groundball (and fly ball) rate. That makes general sense — the more fly balls, the more chances a pitcher has to get some infield fly balls. Before we go any further, let’s quickly replicate that study using 2016-2018 data to see whether there’s been meaningful movement in relationships since 2010. Here are the groundball and popup rates for every pitcher in baseball who threw 100 innings between 2016 and 2018:

Okay, yeah, that relationship looks to be pretty similar to what Appelman found in 2010. That’s good to see, because if something as fundamental as “more groundballs means fewer infield fly balls” had changed completely in 10 years, baseball analysis would have a tremendously short shelf life. With that out of the way, we can move on to answering variations on that question.
To start things off, here’s a question for you. There’s no question that fly ball and groundball rates are skills that pitchers retain from year to year. Zack Britton isn’t just getting lucky every year to have a high groundball rate, and Chris Young wasn’t lucking into a mountain of fly balls every season. What about popups, though? There are two ways to go about this question. First, we could look at year-over-year changes in the amount of popups players get per ball in play.
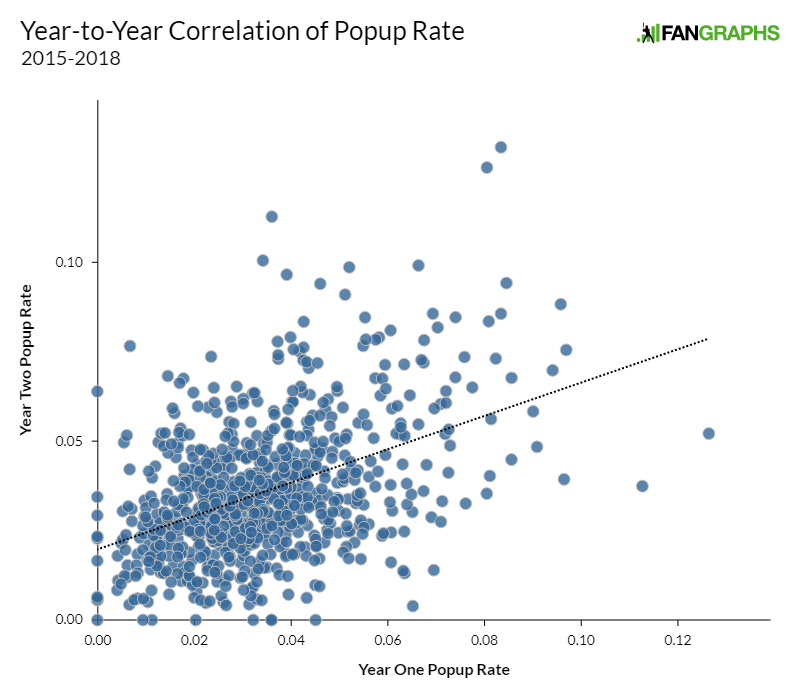
To check this out, I took one data point for each back-to-back season where a pitcher threw 40 innings or more in both seasons from 2015-2018. Clayton Kershaw, for example, shows up three times: 2015-2016, 2016-2017, and 2017-2018. Then, I looked at their year one and year two popup rates. Given that groundball rates are consistent from year to year and highly correlated to popup rates, we’d expect year one popup rate to predict year two popup rate reasonably well, and luckily, that appears to be the case.

This relationship has a .20 r-squared; in other words, 20% of the variation in a pitcher’s popup rate can be explained by the previous year’s popup rate. That’s a robust relationship, which makes sense. If you want to know how many popups a pitcher will allow, it’s useful to know how many they’ve allowed in the past.
That question, though, has an obvious answer. Let’s get to a trickier one: if a pitcher has an extremely high IFFB% (popups as a percentage of fly balls) in year one, what does that tell us about year two? In other words, if an outlandish percentage of Mike Soroka’s fly balls don’t leave the infield in year one, should we expect that trend to continue in year two?
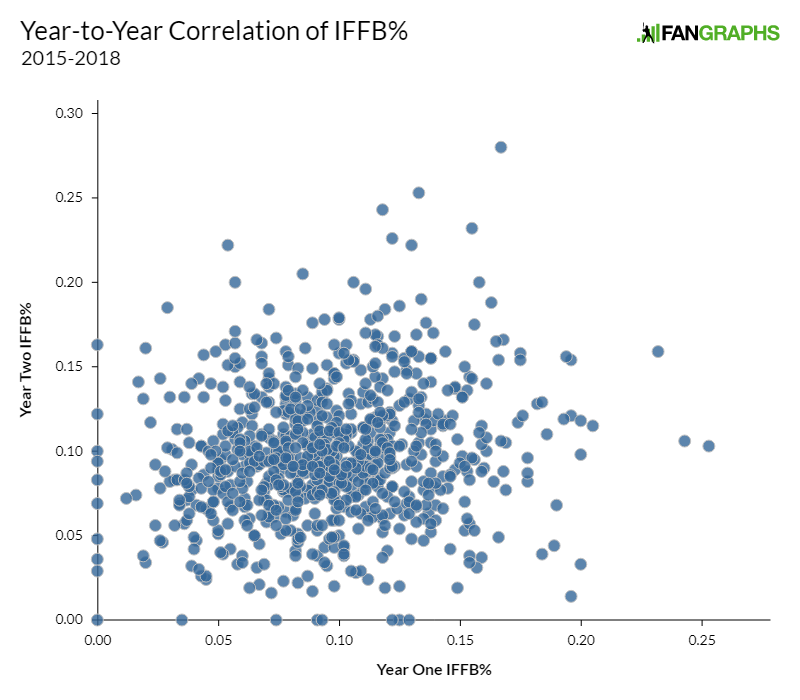
The experimental design for this is a variation on what we just looked at. I took the same pitcher-season pairs as above, but this time I looked at IFFB% instead of popup rate. Before looking at the answers, though, let’s talk about what to expect. We should expect less of a relationship than popup rate, because lots of the year-to-year pattern in popup rate is being driven by a pitcher’s other batted-ball tendencies. If a pitcher has a tremendously high groundball rate in year one, that’s likely to continue into year two, which means fewer fly balls and fewer opportunities for popups. The opposite is true as well: pitchers who allow a ton of fly balls have more chances to get popups. IFFB% uses fly balls as a denominator, however, which means that groundball rate doesn’t drive the results much, if at all.
With that said, the result looks pretty clear: there’s nearly no relationship between year-one IFFB% and year-two IFFB%. The r-squared is merely .025 — significantly less than that of popup rate and small to the point of irrelevance. The data look like the statistical version of a Rorschach test:

This isn’t to say that there’s no relationship at all, or that you should completely ignore what a pitcher has done in the past. The top 10% of pitchers, for example, had a year-one IFFB rate of 16.7%, which declined to 10.7% in year two. The bottom 10%, on the other hand, had a 3.1% rate in year one and 8.3% in year two. There’s a positive relationship, which makes sense — it’s just tremendously small and outstripped to large extent by noise.
There are more ways to ponder the question of whether pitchers can exert some influence over whether batters hit popups, but given the tiny year-two variation from the top to bottom 10%, these changes aren’t likely to amount to much. Consider this fact: James Shields allowed more fly balls than any other pitcher in 2018, a whopping 231. There’s no pitcher who could make better use of a skill for inducing popups. The entire gap from bottom 10% to top 10% is 2.4%, or about five popups a year. Are those five popups worth something? Of course! They pale, though, in comparison to the value of getting more strikeouts or walking fewer batters. For comparison’s sake, a strikeout rate change of 0.5% would have been worth as many outs for Shields last year as that 2.4% infield fly ball rate change.
There are other questions that will inevitably come up on the topic of popups, which I’ll briefly answer here, but which merit further study. Do pitchers who get more popups allow fewer home runs per fly ball? A bit in year one, not so much in year two. Do groundball pitchers have a lower IFFB% as a whole than fly ball pitchers? Yes, but not by much. Can IFFB% tell you anything about year-two run prevention? Don’t count on it.
Overall, though, the data pretty much line up. Fly balls become infield fly balls at a varying rate across baseball, but pitchers can’t exert much skill on that rate from one year to the next. If your favorite pitcher is getting a boatload of popups, rejoice! There’s nothing more satisfying than a pitcher pointing straight up as the second baseman camps out to catch a weak fly ball. Don’t count on that skill carrying over, though. Popups as a percentage of all fly balls appear to be essentially the reverse of line drive rate: tremendously valuable (popups to the pitcher, line drives to the batter) but more or less uncontrollable by pitchers.
Ben is a writer at FanGraphs. He can be found on Bluesky @benclemens.

The front page description had me rolling. The analysis had me very interested, even though I saw the conclusion coming; contact rates and types in general don’t seem to be anything a pitcher can control in a sustainable way. Nicely done, Ben.