
Jo Adell Gets Robbed
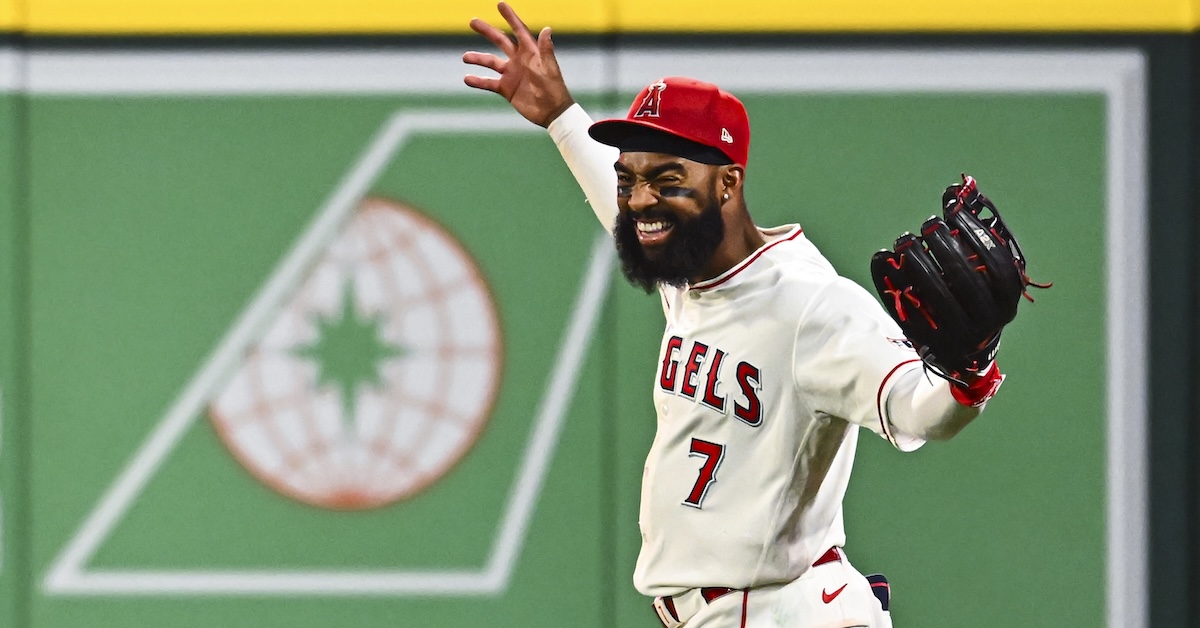
Jo Adell performed a miracle. Let’s turn it into math.
Adell robbed the Mariners of three home runs on Saturday. He got Cal Raleigh in the first inning, Josh Naylor in the eighth, and J.P. Crawford in the ninth. Sports Info Solutions has tracked home run robberies since 2004 and only twice had an outfielder robbed even two home runs in a game — nobody had ever robbed three.
Each catch was crucial. The Angels wound up winning 1-0, with Zach Neto’s leadoff solo shot in the first inning being the only run of the game. That means Adell was thrice the difference in the Angels’ narrow victory.
Win Probability Added doesn’t agree. It suggests Adell overall hurt the Angels’ chances of winning by about 3%. Position players only gain WPA on offense — Adell went 1-for-3 with an irrelevant single — so he didn’t get credit for any of these catches. WPA instead gives all the glory to the pitcher, with the assumption that an out is an out on defense, and the only thing that can be known about an out is who threw the ball (in this case, Jack Kochanowicz, Sam Bachman, and Jordan Romano).
While this assumption makes sense for nearly all plays and scenarios, home run robberies are a bit different. They’re definitive. We know what the outcome was, and we know what the outcome would have been had Adell not intervened.
How much was each catch worth? And how much credit does Adell deserve? Let’s take a look.
Robbery #1
Adell’s first catch came in the top of the first inning with one out and nobody on. Raleigh got a hanging breaking ball and lasered it to right at 105 mph with 28 degrees of launch. Adell, playing deep, shuffled back with a few long carioca strides, timed his leap with a bunny hop, and flung his arm into the air and body into the wall. He landed on his feet before tentatively raising his mitt, as if he’d just staggered on ice in front of 44,084 people and was hoping none of them saw it.
Like many home run robberies, it lacked a bit of grace. I’m sure Hyundai didn’t mind.
There are two ways we could go about giving Adell credit for this play. The first is by assigning the value of the out itself, that being the actual WPA of the play (otherwise assigned to the pitcher). In this instance, the out was worth .016 WPA. That’s not much because the game simply progressed from one out and nobody on in the first inning of a tie game, to two outs and nobody on in the first inning of a tie game.
But we know the Angels would have fallen behind 1-0 had Adell missed the ball. For that reason, we could credit Adell for both the out and the run he saved by comparing the Angels’ win expectancy for two possible outcomes:
A) Catch: First inning, nobody on, two outs, tie game
B) Home Run: First inning, nobody on, one out, Angels down 1-0.
| Credit For | Before WE | After WE | WPA |
|---|---|---|---|
| Out | 52.2% | 53.8% | .016 |
| Credit For | No Catch WE | Catch WE | WPA |
| Out & Run | 42.2% | 53.8% | .116 |
That run-saving scenario results in a WPA of .116, meaning the non-run was worth an additional 10 percentage points toward victory on top of the out itself. Again, WPA doesn’t include this context because it’s generally unknowable. For instance, Josh Lowe and Oswald Peraza each made great defensive plays during the game on would-be singles, but we can’t presume to know what would have happened had those hits landed. The difference with home run robberies is this clear line between all or nothing.
Robbery #2
Adell robbed his second home run with one out in the top of the eighth and the Angels up 1-0. It looked a lot like the first play. Naylor turned on a hanging breaking ball and drove it to right field at 98 mph with 29 degrees of launch. Now, this ball wasn’t hit nearly as well (xBA of .380 vs .900 for Raleigh’s), and it hung up for a second longer. But rather than moving straight back, Adell had to move back and to his right.
This time he looked more confident, taking the same few shuffle strides before timing his leap and extending — briefly flailing — then landing with intent, pumping his fist in the air.
There are still two main ways to credit Adell for this play. Again, we could give him the value of the out like standard WPA. Or we could give him the value of both the out and the run.
Now, I want to propose a third way to value this play, which I’ll explain in a moment. What if we assume Adell hadn’t made the catch in the first inning and only made the catch in the eighth? In other words, we’d be crediting him with saving a 1-1 tie rather than saving a 1-0 lead.
| Credit For | Before WE | After WE | WPA |
|---|---|---|---|
| Out | 80.3% | 84.2% | .039 |
| Credit For | No Catch WE | Catch WE | WPA |
| Out & Run | 54.7% | 84.2% | .295 |
| Out & Run (No Prior Catch) | 27.5% | 58.1% | .307 |
This third scenario makes the catch even more valuable, as a home run there (on top of the homer in the first) would have put the Angels behind 2-1 with just two turns at the plate to go.
Why would we do it this way? Well, we wouldn’t. Adell made the play in first, and that’s the context in which he made the play in the eighth.
Still, I think it’s interesting to consider. It’s incredibly rare, if not entirely unprecedented, for an outfielder to rob three home runs in a game. And the value of each catch influences the value of the ones that follow. What this scenario asks is, if Adell had made only one catch, how much would each have been worth? From that perspective, the catch in the eighth inning was nearly three times more valuable than the catch in the first inning.
Robbery #3
The third play was the most exciting. Thanks to Adell, the Angels still held a 1-0 lead in the top of the ninth. Crawford got a hanging slider to lead off the inning and floated a fly ball down the right field line at 93.5 mph with 35 degrees of launch. The threat wasn’t necessarily the quality of the hit (.060 xBA) but the nature of Angel Stadium, with a shallow corner and short fences, turning what’s normally a weak fly out into a potential run.
Adell galloped 95 feet toward the corner, slowing at the warning track with a few stutter steps. He leapt from his toes and hoisted his arm as he hip-checked the wall, see-sawing over the top and sliding into the crowd. There was nothing for a second, maybe two, before an arm shot up, revealing Adell with the ball and the out. He stood frozen for a moment, holding his trophy for all to see, perhaps in disbelief as fans swatted him on the back for a job well done. He pounded his chest and hopped back into the field.
The crowd was electric, roaring with approval. Crawford stood at first in awe. Mariners first base coach Eric Young Jr. tipped his helmet. Angels assistant general manager Torii Hunter, an elite robber of home runs in his day, said after the game that he almost passed out. The play was reviewed and eventually confirmed, giving Adell time to soak in the atmosphere, unable to hide the smile from his face.
OK, so we have the same three ways to value this catch, plus a new one. Again, we can give him credit for the out, the out and the run, or the out and the run while assuming the other plays had not been made. The third option is actually a bit lesser here, because if Adell had not made the two previous plays, the Angels would have been behind 2-1, and the robbery would have merely maintained the margin of a late deficit.
The final scenario is kind of goofy, but let’s do it just for fun. In the previous counterfactual, where we’re assuming Adell hadn’t made the other catches, we’re essentially inventing extra outs to ensure each play would have come in the same game-state (the only difference being the score). We could instead factor how the game would have progressed using the observed outcomes.
| Credit For | Before WE | After WE | WPA |
|---|---|---|---|
| Out | 83.8% | 91.1% | .073 |
| Credit For | No Catch WE | Catch WE | WPA |
| Out & Run | 50.0% | 91.1% | .411 |
| Out & Run (No Prior Catch) | 7.4% | 17.9% | .105 |
| Out & Run & PA (No Prior Catch) | 8.0% | 30.4% | .228 |
Why didn’t we do this for the robbery in the eighth? Well, the Mariners were bad at the plate most of the game and didn’t reach base often. If we assume this two-out fielder’s choice in the third inning by Randy Arozarena would have been a double play (in the scenario where Raleigh homered and the game progressed identically thereafter, offset by an out), then Naylor would have stepped to the plate in the eighth inning at the exact same moment.
But if Adell also had not robbed Naylor, Crawford would have stepped to the plate with two outs in the eighth inning and a runner on first, rather than leading off the ninth. In that scenario, Adell’s catch would have been slightly more valuable, because it would have kept the Angels in the game with still two more turns at the plate.
Did you follow all that? Did I?
Again, the main consideration here is whether to give the Adell the credit for the out, or for the out and the run. If it’s the former, he was worth .128 WPA in the field. If it’s the latter, he was worth .822 WPA. My gut says .822 WPA feels more correct.
| Credit For | Raleigh | Naylor | Crawford |
|---|---|---|---|
| Out | .016 | .039 | .073 |
| Out & Run | .116 | .295 | .411 |
| Out & Run (No Prior Catch) | .116 | .307 | .105 |
| Out & Run & PA (No Prior Catch) | .116 | .307 | .228 |
The side consideration is estimating which catch was worth the most. His stage dive in the ninth inning appears the most valuable, but only because he’d already made the two catches earlier in the game. If he and the Angels could pick only one catch for him to make, though, I think it should be the one in the eighth.
There are other ways to guess at the data. Adell could have made two catches, or he could have knocked one of the balls back into play, or he could have been substituted, or he could have done all sorts of things to shift the impact of the moment. If we simply ignore the spreadsheets, however, we arrive at a far simpler truth: Adell made each catch, and the Angels won the game.
Ryan Blake is a contributor for FanGraphs and Lookout Landing.
the strangest thing is that Adell is at -1 OAA for the year. Seems like the savant models didn’t find these catches unlikely, which is obviously a mistake on their end
The first two were nice catches. Certainly not easy. The last one was amazing.
Not taking anything away from Adell, but the reason nobody has ever robbed three home runs in a game before is because it is exceedingly rare to have three plausible opportunities in a single game.
I don’t think OAA/FRV deals with added difficulty from walls very well. My understanding is that catch probability is mainly a function of distance travelled.
The problem with OAA is the second A, “average” (DRS is similar). If more than half (by playing time) of the right fielders would have made the catch, it is not an out above average. A silly metric and also inconsistent. For hitting we compare players to replacement level players. For fielding we compare them to the best defenders in the world.
Hitters are compared to average as part of the WAR calculation, a stat that encompasses fielding as well. There is no discrepancy.
I wouldn’t really put to much stock into the defensive metrics this early into a season. Its early, every play has an outsized impact compared to the next because of limited opportunities. Some of the metrics don’t like him cuz he hasn’t made a play with his arm yet, others like OAA don’t like how he goes back on a ball which is weird because he just robbed 2 HRs by doing just that. Just trust your eyes and if your eyes say he’s playing well in the field that’s probably what he’s doing right now.
the issue isn’t really the time frame. Each out should have a certain probability attached and it’s clear that these outs were probably given higher probabilities than they should have
I think OAA struggles with plays where the difficulty is in something other than simply getting to the ball in time.
For the first two robberies, every outfielder gets to those balls. The challenge isn’t reaching the ball, it’s timing the jump, and it’s really hard to design a model to account for that.
This. & not hitting the wall on your jump, which screws up your timing & costs maximum height/extension.
Thomas Nestico did the math and said Adell’s defense was worth 0.32 OAA for the game. But apparently his FRV dropped from the game, which I think is due to accumulating innings in RF, which has a negative positional adjustment. By DRS, on the otherhand, he was +5(!) for the game.
How did he do that math? Surely these three catches alone had much lower than 90% catch probability. Even just 50% catch probability here would be +1.5 OAA, I am not sure about the rest of the game but I’m presuming he didn’t horrifically under-compensate?
Jo Adell Stats: Statcast, Visuals & Advanced Metrics | baseballsavant.com
Scroll down to the Statcast Fielding Breakdown and you can see the catch probabilities for all three (3 orange dots with green outlines). According to Statcast, first two had catch probabilities of 95% and the third had a 80% catch probability. That’s a 72.2% chance of catching all three. If I were a betting man, I’d take the under on an average right fielder making each of those plays nearly 3/4 of the time
catch probability doesn’t factor the wall into the equation–just how far did a fielder need to run and how much time did they have to run there. Many home runs return high catch probabilities despite being impossible to catch
I was under the impression that home runs have a catch probability of 0 and do not impact a fielder. They can only “gain” by making home run robberies, at which point it can only account for distance and time which means they’re not getting the credit that they deserve.
What you’re saying makes it seem like if a team gives up many home runs to right field that their right fielder would receive more negative fielding value which I don’t think is the case.
This is not correct. Catch probability has included wall interaction since 2018.
Yeah the catch probability on any one individually, and on all three combined, is significantly lower than what Statcast is showing. Good lord. If that were the case we’d be seeing multiple home runs robbed every night, and robbing three in a game would have happened many times before.
DRS seems to have done a much better job for this lol, 3 home runs robbed equating to 5 runs saved makes a lot more sense
On average, three home runs will result in about five runs scored, but who is taking the hit here? The pitcher? Does he not deserve any credit for serving up rob-able home runs?
WPA has to add up to zero. It makes no sense to take more away from a hitter than just what an out creates, so if you’re giving WPA to a defender, who are you taking it from? Presumably the pitcher. This is probably why the stat isn’t calculated this way, along with the difficulty of assigning credit. Adell’s catches were amazing, but in a concrete way the pitchers each did their jobs. They got each of those three hitters out.
well no you would very easily just give the pitcher a big negative and then give the defender a big positive. The hard part is just measuring those probabilities with tracking data, conceptually that’s a very clean process. Allowing a hit that is a home run 85% of the time is something to be dinged for, from a results perspective.
Seems like mostly it should mostly be the difficulty of assigning credit. If you wanted to delve into WPA at a metaphysical level, you could figure out the probability of each outcome of a ball that leaves the bat in just that way, assign its expected value to the hitter and subtract it from the pitcher, and then assign the fielder the rest of the value for the actual outcome. For example, if your model says that the average fielder has a one-third chance of robbing the Raleigh homer, Raleigh gets credit for 2/3 of the +.010 for a homer and 1/3 of the -.016 for an out, for a total of .061. Kochanowicz gets -.061. Adell gets .077, the difference between the -.061 for his team off the bat and the +.016 that was the actual outcome of the out.
Though by that logic you might want to separate the probable outcomes for the pitch when it leaves the pitcher’s hand. A pitcher who throws an absolute meatball gets more of the blame for what happens to it and the hitter gets less, while a hitter gets extra credit for tattooing a good pitch. Which would require a lot more modeling. And you might really want to model that pitch by pitch, so when a hitter lets a meatball go by both the pitcher and hitter get penalized (though the hitter gets penalized more, because the overall outcome is good for the pitcher’s team).
What I’ve described is ridiculously overcomplicated and that’s why we’ve settled on giving the pitcher and hitter all the WPA for outcomes. Leaving WPA as a stat that is mostly for entertainment purposes, or useful for calculating strategic decisions, and definitely not a measure of true skill. Which means we can also play around with the effects on WPA of a fielder’s individual play, like Ryan did in this cool article!
This is basically how I was thinking but you did a great job of explaining it.
Aw, thanks!
You’d also have to start including things like base running, distributing some amount of WPA to a base runner who scores from first on a double. This would get extremely complicated pretty quickly
“in a concrete way the pitchers each did their jobs” – sure, but not in a practical or real-world way. Math is failing reality here. The map is not reflecting the territory.
This definitely feels like an area of improvement for OAA. The first thing I did the next day when the stats were updated was check Adell’s OAA to see where that single game moved him. He is not a good defender overall but he had one heck of a defensive game that probably should have been at 2 OAA.
I do feel plays like these are interesting case studies on the stat itself for OAA. OAA is going to have flaws and over time stand out cases like this can highlight areas to improve its accuracy. I doubt we ever get a perfect or near perfect defensive stat, but we can get closer as an industry than we are now with iterative improvements.
yeah exactly. I’d almost think on these types you’d want some conditional model that fits something completely differently once the player is interacting with the wall. But the other issue could be samplesize since every ballpark’s wall is different and it could be really hard to fit something legitimate. Either way it’s important to know the limitations.
Does OAA factor in XBA? Because if that final catch was on a ball with an XBA of .060, then that seems like a flaw in OAA
xBA isn’t going to be particularly correlated with OAA. xBA is based on exit velocity and launch angle (and the batter’s sprint speed for “topped” or “weakly hit” balls), but doesn’t take account of spray angle at all. A line drive right at a fielder can have a very high xBA but also a high catch probability, because catch probability “knows” that the fielder didn’t have to move to catch the ball, and xBA doesn’t “know” that.
For wall balls in particular, I guess Catch Probability does take account of whether a ball is at the wall, but for sample size reasons it puts all wall balls into the same bucket. That means robberies aren’t going to be valued highly enough, especially ones like the last one, where the degree of difficulty is much greater than it would be for a ball with the same EV and launch angle that came down just in front of the wall. But that’s pretty much an inherent limitation of the OAA method; the more unusual a play is, the harder it is to measure Catch Probability by comparing it to similar plays.
This is really excellent!
I know it’s awfully tempting to use WPA for this but the whole idea of assigning individual credit in WPA is misguided. It only really works at the game / team level. The article is trying to save something that is fundamentally broken. If we looked at WPA at the game / team level, it would be correct.
WPA is also not a logical stat, it’s an emotional stat. And it’s awesome for that but if you take it out of the realm of “how awesome was this moment in the game” the whole thing falls apart. This article is like trying to deconstruct the script for a dream.
Trying to reconfigure WPA at the individual level only helps to demonstrate how it doesn’t work for individual players.
“What if he hadn’t made the earlier catch” doesn’t make sense unless you also calculate other things like “What if Logan O’Hoppe had been able to drive in Adell in the 7th inning” or “What if Randy Arozarena had managed to drive in Julio Rodriguez in the first inning.”
Also, every other part of the game. You would have to redo it for everything that happened.
If you really wanted to reconfigure this at the individual level, it would be super boring. Because everything is important in a one-run game. The counterfactual is “what if one thing about this game changed.” It would make everything super important in the game relative to other games the Angels play this year, but within the game the only thing that would matter is base state.
“Trying to deconstruct the script for a dream,” is not far off what I was going for. Hopefully these caveats come through in the article.
Attempting to quantify emotion is possibly nerdiest thing one can do!
And that’s what I’m here for!
Yeah but it’s for YOUR emotion! Not the player’s emotions!
How can WPA be considered a valuable, or even remotely usable, tool if it cannot judge all aspects of the game when trying to present us with the true impact a player has on the outcome of the game? Three pitchers give up rockets, bad, but all get credit for recording an out, good, and the fielder gets no credit for, at the very least, one of the greatest defensive games ever seen. I will continue to enjoy the games with my lying eyes that are still fully capable of knowing what is good and what isn’t.
WPA assigns value to the play as a whole, who is responsible for the play’s result is much harder, but possible, to determine. It is measured more for hitters since generally the hitter + opponent is mostly responsible for his WPA (aka not super teammate dependent), although baserunning is the one factor that isn’t considered there. So if you get a base hit and your teammate is thrown out at home you get punished. The team is also obviously responsible for the situations you are put in, but the point of the measure would be to measure performance within context so that is more of a feature than a flaw.
“So if you get a base hit and your teammate is thrown out at home you get punished.” This is so blatantly erroneous that it continues to cause me to question the efficacy of so much of the analytical material that is out there. Are we being asked to sort out the wheat from the chaff and, if so, how is that any better than my eyes, and my 75+ years of watching baseball, that tells me that Francisco Lindor can play on my team or that Dustin May might have trouble getting me out? With that said, I think the answer has to be yes but that doesn’t mean that I am not going to attempt to find the wheat. There is value in much of the information that is now available. It is the blind acceptance, and belief in the omnipotence of the analysis, that has been surprising to me in my 10 years enjoying the conversation at Fangraphs.
well that is an edge case but obviously important to consider. But in most at bats WPA will be driven by the hitter vs pitcher/fielder matchup, not hitter/baserunners. The interesting thing with WPA is that over long stretches (like 10 years), we often see some players consistently have more WPA than would be expected based on their average results. If you go look you’ll see that atop this leaderboard in clutch rating are Ichiro, Tony Gwynn, and Pete Rose, with their average WAR/season in their primes often being underestimated by 0.5-1 which is substantial. and as the other commenter pointed out, WPA also gives insight into how relievers can significantly alter games beyond what can be measured by runs allowed alone. But beyond that it is more of a storytelling stat than one to evaluate player ability, because of how noisy it can be.
I feel like you’re more upset at the name Win Probability Added than the process.The process is just one amalgamated attempt at win probability. Within the industry the limitations of this metric are well known and discussed even if the name of the stat obfuscates exactly how it is calculated. To be clear: there is zero statistical universe where a perfect win probability is calculated and even if it were crafted we’d have no methodology of confirming it.
That does not mean WPA, as it is currently calculated, has no value. It just needs more context.
Are you reading these comments? Or the article, the entire point of which was questioning, not blind acceptance?
It’s the opposite of blind acceptance. The blind acceptance is your assumption that using statistics means believing them.
WPA is probably most useful when assessing how bullpens performed.
For instance, from 2023 to present, the top to bottom range on team reliever fWAR is 17.5 wins from 19.4 (LAD) down to 1.9 (LAA).
The top to bottom range on team reliever rWAR is 33.4 wins from 26.9 (MIL) down to -6.5 (CHW).
The top to bottom range on team reliever WPA is 48.47 wins from +30.23 (MIL) down to -18.24 (CHW).
Pretty easy for me to see which of the three is doing a better job of capturing the actual range of team bullpen performance over the last few years.
Going back to Hader’s first season in 2017, Brewers relievers are credited with 39.9 fWAR (6th) but +54.35 WPA (2nd). On the flip side would be a team like the White Sox credited with 31.8 fWAR (10th) for their relievers over that same time frame but -14.91 WPA (29th).
WPA is useful for gambling on the outcome of the game. That’s it.
Otherwise it is quite literally the attempt to quantify how a person feels when they watch a game. The correct level of analysis is either at the game or the team level.
Your complaint isn’t WPA related. Apportioning credit is just as big a problem in every other stat. It goes right down, in this case to stats like Home Runs! Which affects wOBA and FIP!
I think the difficulty of the catches has meaningful differences. The third catch was really difficult. The second one was the easiest. The first was a bit higher than the second so it was a little more difficult than the second. With both of the first two catches he only needed a few steps to reach the wall and he had time to gather himself. I think most outfielders would convert the second out, the first one it would depend on their height and vertical leap. The third one is much harder and it helps that it’s his home stadium some could get into position to make the play others wouldn’t be able to. A number of Tori Hunters most dramatic catches came at home. Considering the angle, the wall and momentum on reaching the wall some outfielders might not even attempt it as it’s a good way to end up on the IL.
It made sense to me – in the sense that the stats were not giving him enough credit.
all i know is that Jo deserves all the Jolden Jloves
Ultimately, to accurately credit Adell defensively, I think we need to know the base rate for successful robberies on theoretically catchable home run balls. At the very least. Ideally, we would model success rates for balls hit similarly to Adell’s robberies. OAA seems to think these were highly probable, which I think is wrong (especially for the 3rd one), but I don’t have a good intuition for the actual likelihood of those 3 balls being caught by an average fielder.
This was my thought process as well. This is a very unscientific analysis but just my hunch on each catch. They were all very good catches that I think most defenders would not have made. If I had to assign a percentage to each one, I would say the first catch would be caught 25% of the time. He timed his leap perfectly, fully extended and caught the ball at the apex of his jump. The second catch was nearly identical but looks like he didn’t have to fully extend so I’m going to say that one would have been caught 35% of the time. The last one was phenomenal. His hip catches the wall, knocking him off balance. He makes the catch fully extended while battling the fans and also bracing himself so he doesn’t face plant into the concrete or seats. I would give that one a 10% probability. Using that math, he saves 2.3 runs in the game (0.75+0.65+0.90). That’s assuming all runs should be equal to 1 run, which they would have been in this particular game but if you say on average three homeruns net you 5 runs, that those catches were worth 3.8 runs.
A theoretical question. The maximum win probability is 1.00, because you can only win a game once. But let’s assume that Adell’s catch on Crawford took place with two out in the ninth, a runner on first and the Angels holding a one run lead.The WPA for just that catch might be 1.00 because had the catch not been made the game was over and lost instead of being over and won. But in that case Adell’s two other catches add nothing to WPA, in fact everything that every Angels player did during the game adds nothing.
Another, although less significant, question. How do we reconcile catches like this with BABIP? Adell’s three robberies were each outs on balls in play. But if another right fielder did not sprint to the spot, leap and make the grabs, it would not be considered balls in play for BABIP purposes. There may not be enough stolen home runs to make this a methodological problem, but it is worth considering.
Finally, I disagree that while “the assumption that an out is an out on defense, . . . home run robberies are a bit different.” If with two on and two outs Dalton Varsho snares a screaming line drive that only three other CFs might have caught, that matters as much as robbing a home run. Varsho’s out is not just an out. Giving WPA credit to the pitcher for that out gives credit for something that 87% of the time would not be an out (unless you want to give the pitcher credit for signing with a team that has Vasho in CF).
Your comment strikes at one of the most important issues with statistical attempts to quantify baseball. You are spot on in your disagreement with “the assumption that an out is an out on defense.” It is wrong not to consider the situation when placing a value on each and every play. A great catch by Varsho with 2 outs and nobody on in the 1st doesn’t compare with the same catch when made in the 9th of a tie game. I had a nickname for Mo Vaughn. It was Mr.10-2. He had a penchant for hitting HR’s when the game was already decided. There are players who perform differently in situations with different levels of leverage and intensity but how is that measured? It all comes back to the fact that we can predict possibility but we cannot predict certainty but I see some who think that numbers can do more to determine the outcome rather than simply increase the probability of the outcome by a couple of percentage points.
I enjoyed this article and discussion. For my part, I will say (picking up on thread in the comments) that I don’t think a replacement level outfielder would have made any of those catches with regularity.
For me, the best way is to judge the catches by what actually happened; an out was made and a run was saved. To allow any of the hypothetical sugggested in scenarios 3 and 4 into the equation contradicts the point made regarding the defensive plays by Lowe and Peraza because we could, presume what the most likely scenarios would have been had those plays not been made, and had another pretend-field day. Way to much hypothetical being aded just to make a pretend point and publish an article. Give the man his due and leave it at that.
Nah, I think it’s an idea worth exploring. What Adell did is rare and interesting and clearly improved the Angels’ chances of winning. How much? Well, who knows. We don’t have a natural way to capture such a feat. But I offer (in my opinion) a few plausible ways to think about it.