
Michael Wacha’s Home Run Suppression Field Failed

The fences moved in, and Michael Wacha felt the pinch. The right-hander allowed exactly twice as many home runs in 2026 as he did in the prior year, and the obvious place to look is the ballpark. Kansas City pulled the Kauffman Stadium fences in by enough to turn it from one of the toughest places to leave the yard into a roughly average home run environment. Or at least, that’s where I started when I set out to analyze Wacha’s 30 homers allowed, the third-highest mark in baseball and a career worst for the veteran pitcher.
I kept an eye on Wacha’s home run issue for two reasons. First, I was curious about how the new fences would play, and as a fly ball pitcher without strikeout stuff, Wacha was a great barometer. Second, I’ve done a lot of work on which pitches are most likely to get hit for home runs in the past few seasons, and Wacha generally finished high on those lists. But despite showing the characteristics of a pitcher who should get hit hard, he basically didn’t. Over 2024 and 2025 combined, no pitcher in baseball had a larger divergence between his expected home runs allowed, as calculated by PitchingBot, and his actual home runs allowed. Wacha’s pitches racked up 50.6 expected HR allowed during that span, according to my formulation of PitchingBot data; he allowed only 32, a gap of 18 homers. No one else had a gap of 15 or higher.
Through the end of June, there wasn’t much to pay attention to. But on July 4, Wacha got tagged for three homers at home against the Phillies, and from then on out, it was as though a switch had been flipped. From that day through the end of the season, he gave up 13 long balls at home, and another seven on the road. Was it Wacha? The stadium? Luck? I made a note to check when the playoffs were over. Today, I’d like to give you the results of that investigation, as well as revisit my old definitions of meatballs and expected home runs. Wacha’s glut of home runs allowed wasn’t simply a fluke, and the stadium wasn’t to blame for all of those added homers.
Let’s start with an overview of Kauffman stadium in 2026. In 2025, teams hit 151 homers at the K; this year, they hit 196 home runs there. That’s almost bang on what you’d expect from a physics-based model. Taking the same set of batted balls and overlaying both wall dimensions on them, the closer fences produced between 40 and 60 additional home runs in all but one of the seasons I tested. Home runs were down a hair across the majors, but mostly, the league had a similar environment for power and Kauffman simply played smaller. That’s exactly in line with my expectations. Score one for physics.
What did that mean for Royals pitchers? In plain English, they couldn’t rely on the park’s home run suppression on elevated contact anymore. I’ve been using PitchingBot data to calibrate expected home runs, what I’m calling xbotHR, to figure out which pitchers throw the most crushable offerings. That metric uses physical characteristics of each pitch as well as information about the count, but it ignores everything else. For two identical sliders in identical counts, my model would expect the same chance of a home run for Junior Caminero batting at Coors Field as for Chandler Simpson batting in the Grand Canyon.
The batter identity part of the equation mostly comes out in the wash. Across an entire season, pitchers face broadly equivalent opposition. That doesn’t mean that it’s OK to throw a meatball to Caminero, and indeed some pitchers struggle because they can’t avoid the big part of the plate against scary hitters, but you can mostly ignore that when you’re evaluating an entire season. However, stadium identity doesn’t work that way. Pitchers don’t experience broadly equivalent home run environments. Pitching at Kauffman before 2026 was like a security blanket that other teams’ pitchers didn’t receive.
Put another way, Royals pitchers allowed 20 fewer home runs than expected in 2024. They allowed 21 fewer home runs than expected in 2025. And in 2026, they allowed only three fewer home runs than expected. You can’t blindly attribute all of that to the stadium, but again, the effect size feels about right: If the park was producing 20 fewer visitor home runs than expected per year, it would be reasonable to expect 20ish fewer home-team homers than expected. Indeed, that happened; both home-team and away-team homers were almost exactly what the model expected in 2026.
If you’re keeping all of these numbers in your head, by now you’ve likely realized that Wacha’s home run suppression vastly outstripped what can be attributed to his home environment. He allowed 18 fewer home runs than my model expected across 2024 and 2025, with about 11 homers worth of the gap coming in home games. The math’s not that hard here; Wacha threw about 11% of the pitches that the Royals tossed in Kauffman across those two years. If the stadium suppressed home runs for each pitcher in equal proportion, he would have allowed four or five fewer home runs than my model’s expectation, not 11 fewer.
That’s not particularly weird, of course. Allowing a home run is partially a mark of bad process, but it’s largely a mark of bad luck, and not all of that bad luck washes out at the seasonal level. Sometimes the other guy just hits a good pitch out. Sometimes he swings through a pitch that another hitter would have tattooed. The wind doesn’t blow the same way every day; two pitchers might play in the same park but experience very different “park effects.” And not every pitcher allows a similar number of balls in play that could even become homers. One thing I’ve learned from parsing these numbers over the years is that by this formulation of xbotHR, you should expect a ton of noise even if there’s a real signal.
But in the same way that Wacha’s home run suppression was greater than could be explained by his home ballpark over the 2024 and ’25 seasons, the extra home runs he allowed in 2026 are far more numerous than can be explained by the new dimensions. In 2025, I had Wacha down for 14.2 xbotHR allowed at home, and he gave up six homers. This year, I had him down for 14.1 xbotHR allowed at home – and he allowed 17 homers, nearly triple the previous year’s total.
To make sense of this, I started thinking more granularly about how I was producing my xbotHR calculations. PitchingBot works by taking a pitch and assigning probabilities to a number of variables: the chance the batter swings, the chance he makes contact, the chance the contact is fair, and the chance that the contact lands in one of a number of buckets of contact quality. But it doesn’t use any actual contact data, so there’s a gap between what the pitchers tend to allow and what they actually allow.
But I don’t have to limit myself to that data. PitchingBot might make its predictions without knowing what happens, but I don’t have to. For example, let’s consider Wacha’s 2025 home games. My xbotHR model says that when pitches like Wacha’s were thrown, they tended to result in contact that you’d expect to produce roughly 14 homers in a neutral ballpark. But if you look at the actual batted balls he allowed, those combinations of angle and exit velocity projected for just under 10 homers. In other words, Wacha was throwing pitches that the model thought would get hit pretty hard, but batters weren’t producing those hard-hit balls as frequently as expected.
Next, the same contact leads to different expected results depending on where it’s hit. Smoked line drives are great everywhere; hard-hit fly balls can be all over the place in value depending on where the game is being played. This is the stadium effect we’ve already discussed at length.
Finally, there’s still plenty of unmodeled “residual” left. Batted-ball spin, for which we have no public data, can change carry considerably. We have overall park effects, but that doesn’t cover whether a gust of wind knocked down or propelled a particular ball, or whether one particular day’s weather made a park play notably different than its average. Home run robberies would show up here, although there aren’t enough of those per year to be a huge factor. There could be data errors, though none jumped out at me. There are interaction terms – moving in the fences at Kauffman didn’t make every type of batted ball better, so batted-ball distribution and park effect can impact each other in ways that aren’t modeled in the previous steps. In any case, there’s a lot of stuff that our model doesn’t capture. The hope is that all of that stuff is noise – in other words, that it doesn’t have a consistent direction. I have good news for that assertion; I modeled every pitcher in baseball in this method, and the residuals had essentially no year-over-year correlation (an r-value of 0.04, for the statistically inclined).
Here’s a graphical representation of my mental model of how to go from the model’s xbotHR output to actual home runs:
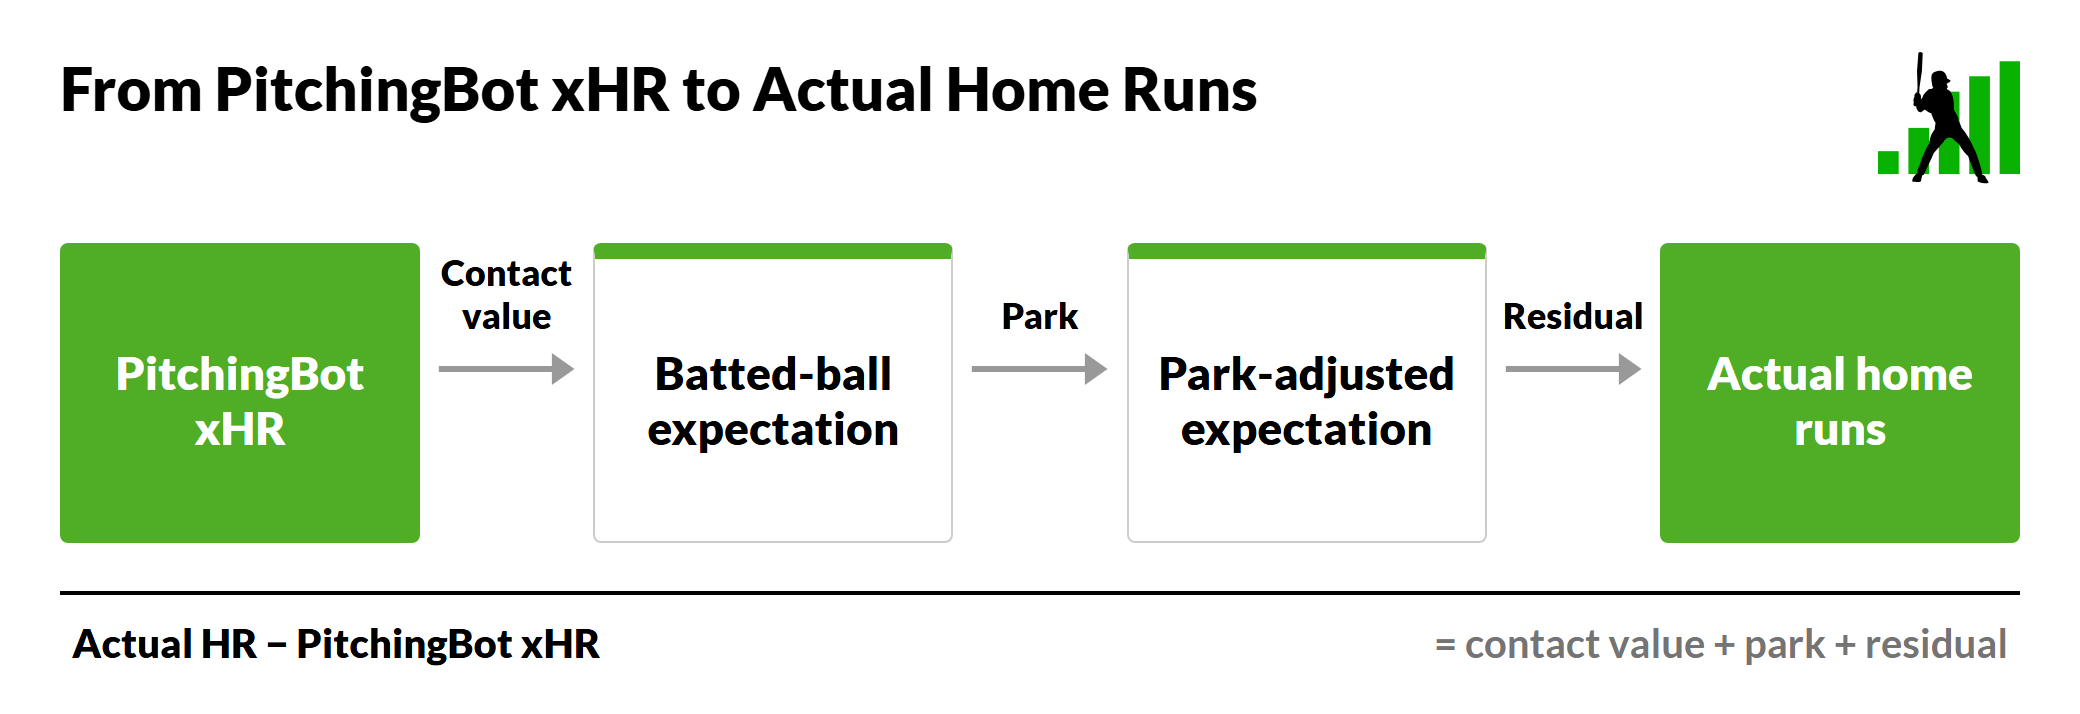
I used this component-wise breakdown to explain what’s changed for Wacha. Let’s take 2025 as an example. I mentioned above that he allowed 14.2 xbotHR. Looking at his actual contact allowed, however, he did meaningfully better. Wacha tossed up some offerings that looked exceedingly mashable to the models, but hitters couldn’t mash them. Based on batted-ball results alone, you’d expect Wacha’s pitches to yield 9.7 homers at a neutral park. Some of that is skill, some of that is luck, some of that is that my model doesn’t know who the batters are. Or, well, some of it could be that my model doesn’t know who the batters are, so I tested that hypothesis. In 2024 and 2025 combined, the batters that Wacha faced hit 3.09 homers per 100 plate appearances when facing non-Wacha pitchers (league average was around 3.05 for those years). In 2026, the batters he faced hit 3.04 homers per 100 plate appearances against everybody else (league average was around 3.03).
In those years, the park also helped by quite a bit. More specifically, using the ratio between expected home runs based on leaguewide batted-ball data and actual home runs hit at Kauffman Stadium, Wacha could expect 1.7 fewer homers allowed in 2025 home games based on where he pitched and the type of contact he surrendered. I also know that Wacha allowed six home runs at home in 2025, so that means I can fill in the residual by subtraction; he allowed two fewer home runs than his contact quality and home park would imply, for any of a number of reasons that don’t appear to repeat all that much from one year to the next. But at the end of the day, I feel pretty confident in saying this: PitchingBot thought that Wacha’s home pitches deserved to allow around 14 homers. Hitters made weaker-than-expected contact on those pitches; if you only looked at the batted balls he allowed, you’d expect around 10 homers in a neutral park. Kauffman’s generous dimensions knocked that expectation down to eight, and then he actually allowed only six. Let’s fill in those values on our flowchart:

OK, now it’s time for the 2026 version. PitchingBot gave Wacha a near-identical 14.1 xbotHR without looking at batted-ball results. But unlike 2025, Wacha didn’t suppress contact relative to what the model expected. If you only look at the batted balls, you’d expect 16.6 homers. He went from allowing less dangerous contact than our pitch-only model forecast to more dangerous contact than it forecast. That’s borne out by looking at the actual batted balls. Define a dangerous batted ball as one hit 95 mph or harder, and at a launch angle between 20 and 40 degrees. In 2025, 11.5% of the batted balls that opponents hit against Wacha at Kauffman fit those criteria (league average was 12.4% that year). In 2026, 14.3% of the batted balls that opponents hit against him at Kauffman fit that criteria (league average was 11.7%).
You can’t give Wacha all the blame for that. The gap between PitchingBot-expected contact and actual contact allowed is a noisy variable. Some pitchers definitely have a contact suppression skill beyond what PitchingBot measures. Some are definitely more prone to loud contact than the model would suggest. But there’s also a ton of noise in the number, as you’d expect given that it’s based on what the batters opposing a pitcher did in addition to the parts that he himself controlled. Some testing on my end suggests that 25% or so of “contact suppression value” is a repeatable pitcher skill, as a rough rule of thumb.
From 16.6 homers, we add in the 2026 park effect. In previous years, you would have expected the park to suppress a ton of homers – roughly three, based on how much elevated contact Wacha allowed this year. But the new, closer fences meant that the park effect was subdued, a mere -0.4 homers, as Kauffman played roughly neutral on the home run front this year. Add in the last residual term, and the whole line looks like so:

I just threw a lot of numbers at you, and this article is already pretty dense, so I won’t keep up the math barrage. The point I was trying to make isn’t the specific values; it’s that the biggest change in Wacha’s home run suppression was not his home park but the change in contact allowed relative to what you’d expect from the shape and location of his pitches.
There’s no reason to expect anyone to be as good at this skill as Wacha was in 2024 and 2025. For example, he wasn’t nearly that good at the skill in the previous years of his career, when his xbotHR and actual home runs allowed were roughly equal. So if you’re forecasting how many homers Wacha will allow next year, you probably shouldn’t ascribe some kind of outlier contact suppression value. And in fact, Steamer projects him for 28 homers allowed in 2027, and it projected him for 26 this year. Maybe I was wracking my brain for reasons Wacha was beating the odds when the real reason was just random variation and short-term swings that don’t stick in the long run; both my breakdown and Steamer’s projections sure seem to think that way, at least.
I’m not sure if this is as fascinating a result to you as it is to me. But I set out to figure out why Wacha went from suppressing homers at a massive clip to being basically average at that skill, and I actually found several things to point to that weren’t just that the fences moved. I’m pretty pleased with that, even if there’s still plenty of fudge factor in the model. I hope you enjoyed this too-deep dive into something that had been on my mind all year.
Ben is a writer at FanGraphs. He can be found on Bluesky @benclemens.

