So Just How Busy Was the 2019 Trade Deadline?

Until they arrive, all trade deadlines feel the same. The air is abuzz with whispers of marquee names finding new homes. The potential for splashy trades is endless. 2019 was no exception. Noah Syndergaard, the God of Thunder! Madison Bumgarner, indomitable postseason hero! Whit Merrifield… alright, I couldn’t think of an exclamation-point-worthy nickname for everyone. All were rumored to be in play in the lead-up to the deadline.
Well, the trade deadline has come and gone, and none of those players were traded. In their place, we got a few blockbusters: Trevor Bauer is taking his unique blend of trolling and analytics to Cincinnati, while Yasiel Puig orchestrated the first ever farewell fight before heading to Cleveland. Zack Greinke is joining Justin Verlander in Houston, the mythical land where former aces go to become legend. There were many lesser moves, of course. Teams upgraded bullpens or shored up weak platoon matchups ad nauseum. A whopping 64 players were traded yesterday alone.
As with most things in life, it’s hard to put this trade deadline into historical context while living in the moment. Yesterday certainly felt busy, with trades being announced seemingly every five minutes and a former Cy Young winner on the move to the World Series favorites. The previous few weeks, on the other hand, felt interminably slow. The Bauer/Puig swap was one of only two deals of consequence to take place before deadline day. How did this year stack up to past deadlines?
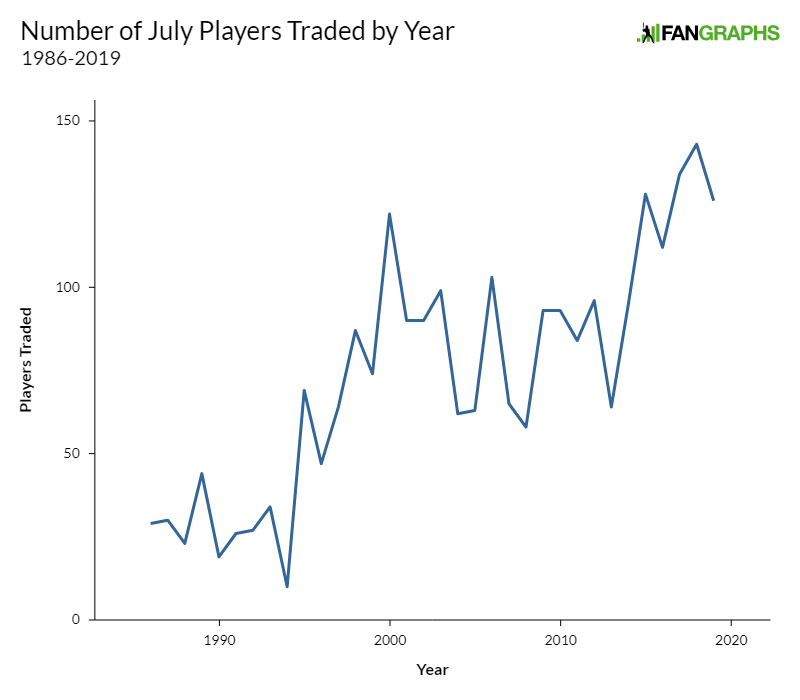
To answer this question, I updated methodology first used by Ben Lindbergh in 2015. Using data from Retrosheet and MLB, I compiled a list of every trade made in the month of July starting in 1986, the year baseball’s non-waiver trade deadline moved from July 15 to July 31. In terms of the raw number of players traded each July (excluding players to be named later), 2019 is in line with the latter half of this decade and its huge number of traded players:
Of course, the number of players traded isn’t necessarily a great measure of how fruitful the deadline was, or how significant its moves were. The Mariners and Nationals completed a trade yesterday, for example, that involved five players who have been worth a combined 0.1 WAR this year, three of which are long-shot minor leaguers. The Astros and Diamondbacks completed a similar five-player trade, only Zack Greinke and three top prospects were involved. No, number of players traded isn’t a good metric.
Initially, I wanted some kind of holistic measure of future player value, some kind of surplus value metric that could handle prospects and established stars alike. I changed my mind, though. First, finding that data going back to 1986, or even 2006, would involve a lot of approximation, as projections and prospect rankings don’t really exist for all the players we would need, and contract details are also sketchy at points. Second, those measures aren’t really what’s exciting about a trade deadline. Looking at surplus value could convince you that five years of a marginal reliever is more exciting than two months of an ace, but that doesn’t track with how I feel about a given trade.
Instead, I decided to use single-season WAR. This excludes prospects from the picture, and that’s okay with me. Even then, though, one decision remained. You see, there are two ways you could consider WAR. One would be to look at the previous year. Relievers and health are fickle, and getting a previous full season of data might be a good way to avoid being tricked by small sample size. A star returning from injury, for example, might be a valuable trade chip, even if his current-year numbers weren’t outstanding.
On the other hand, using this year’s WAR has its advantages as well. Breakout trade candidates will be better represented: Nick Anderson, for example, was a key part of a Rays trade involving the 34th-ranked prospect in baseball, and wasn’t even in the majors last year. Former superstars, too, might be over-counted in previous WAR. Brian Dozier was traded in 2018, one year after a colossal 5 WAR season. He was traded for a pittance, though, and rightly so: he was in the middle of a 90 wRC+, 0.8 WAR season.
No set of players better demonstrates the difficulty in choosing which valuation to use than Scooter Gennett and Eric Sogard. The pair of former Brewers utility infielders were both traded this deadline, and figuring out who’s better isn’t exactly easy. If you look at 2018 WAR, Gennett wins in a landslide. He was worth 4.5 WAR and launched 23 home runs, the kind of slugging infielder teams go crazy for. Sogard, meanwhile, was untradeable, demoted to Triple-A after slashing .134/.241/.165 in 113 plate appearances, good for -0.8 WAR. If you’re using 2018 as a metric, Gennett was a huge get and Sogard was essentially worthless.
Use 2019, though, and the numbers tell a different story. Gennett is having a horrendous, injury-marred season: he’s been worth -0.4 WAR in 69 plate appearances. Sogard, meanwhile, has broken out, to the tune of a 122 wRC+ and 2.1 WAR. Use 2019 WAR, and Sogard is a gem while Gennett is a scrub.
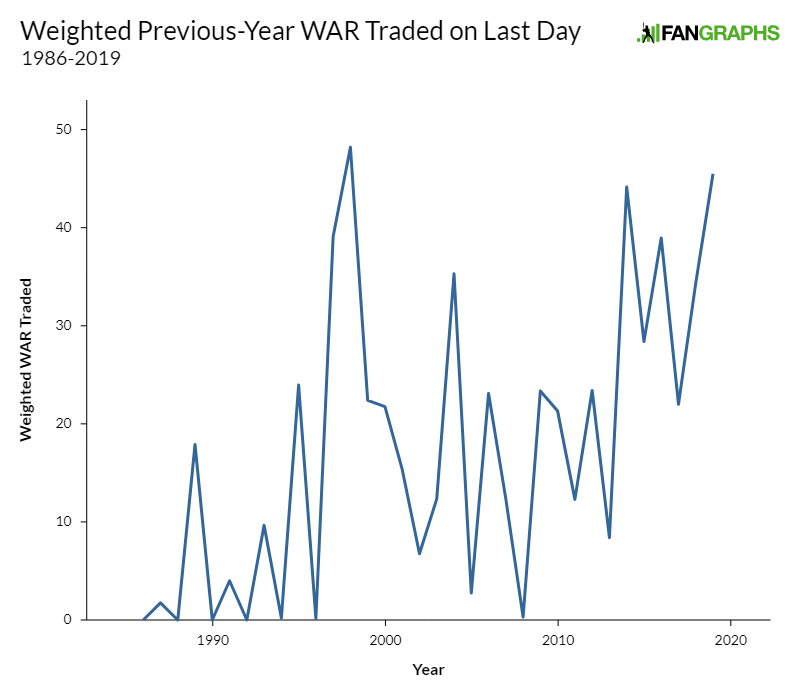
Luckily, we don’t have to choose. With the identities of every player traded in July in hand, we can simply download every single-season leaderboard since 1985 (the year before the first trade deadline) and run both sets of numbers. First, here’s how much previous-year WAR was traded at each deadline:
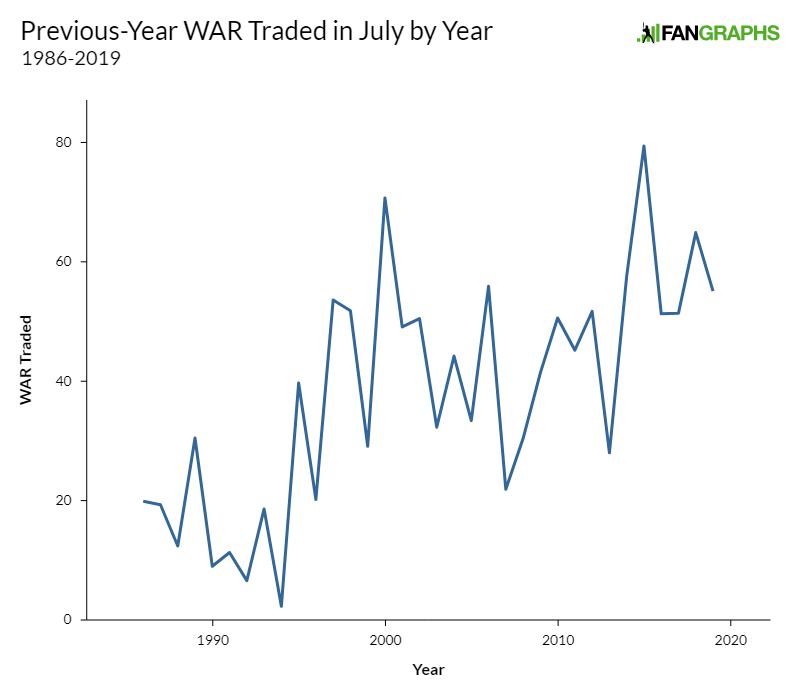
By this metric, 2019 looks pretty average. Lots of established names were moved this month, roughly in line with what has happened, on average, since the introduction of the second Wild Card. Let’s look at it again, this time using WAR from the season in which the trade occurred:
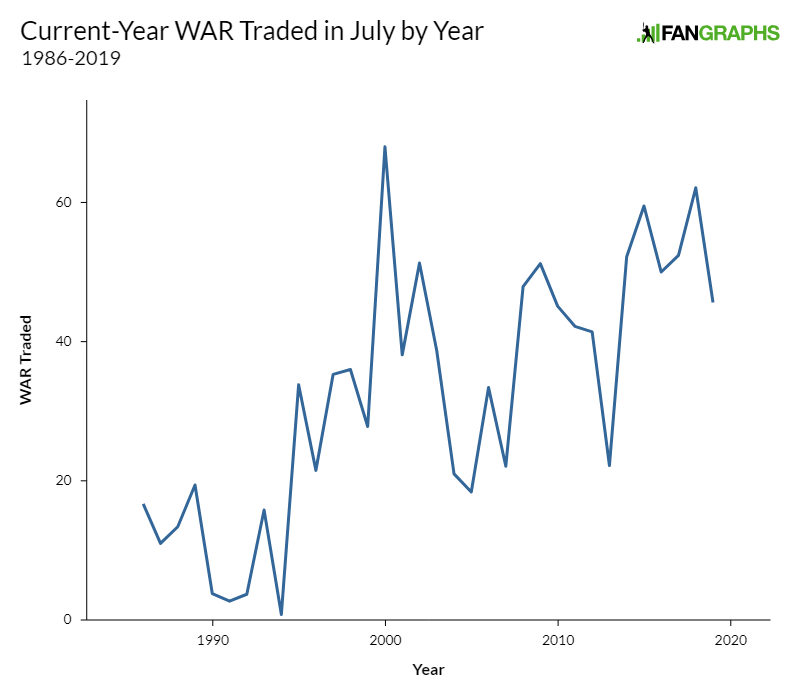
Of note, I normalized the data by pro-rating out this season to 162 games. In other words, I looked at how many wins players traded in 2019 are on pace to accumulate this year. Given that I only have full-season splits, that was the best way to put each group on an equal footing. By current-year WAR, 2019 looks rather less impressive. It’s not quite the lows of 2013 and 2016, when very few deals went through, but it’s among the lowest hauls in recent years, and far lower than last year’s bonanza.
Every deadline, of course, isn’t created equal. One of the biggest changes in deadline valuation recently has been the premium teams will now pay for relievers. As postseason game management emphasizes more frequent and aggressive bullpen use, relievers have taken on an outsize value for contending teams. Starters are also more valuable in the playoffs, of course, because they pitch in a higher percentage of teams’ games and can be used for emergency relief.
Think of it this way: acquiring Zack Greinke is a bigger deal than acquiring Scooter Gennett, even if the 2018 numbers don’t justify it. That’s partially because Greinke is a star, of course, but also because he has extra playoff value that Gennett simply doesn’t. To account for this, I re-ran the numbers, but added a modifier. I doubled the value of all relievers and added 50% to the value of all starters, while leaving position players unchanged. Is this a perfect metric? Probably not! I just made it up on the spot through theorycrafting. Still, I think it’s a good approximation.
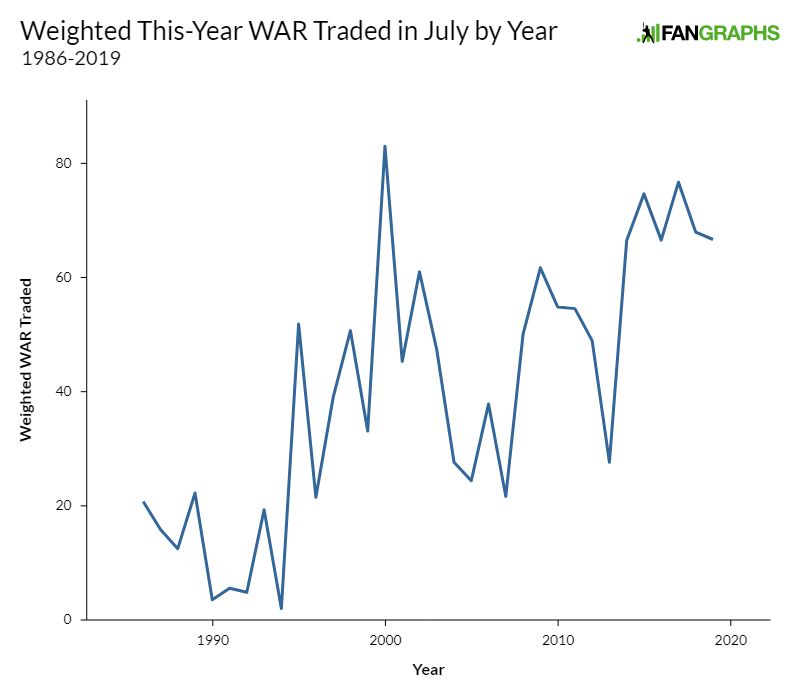
Let’s look at the previous-year-WAR numbers again with the weights added:
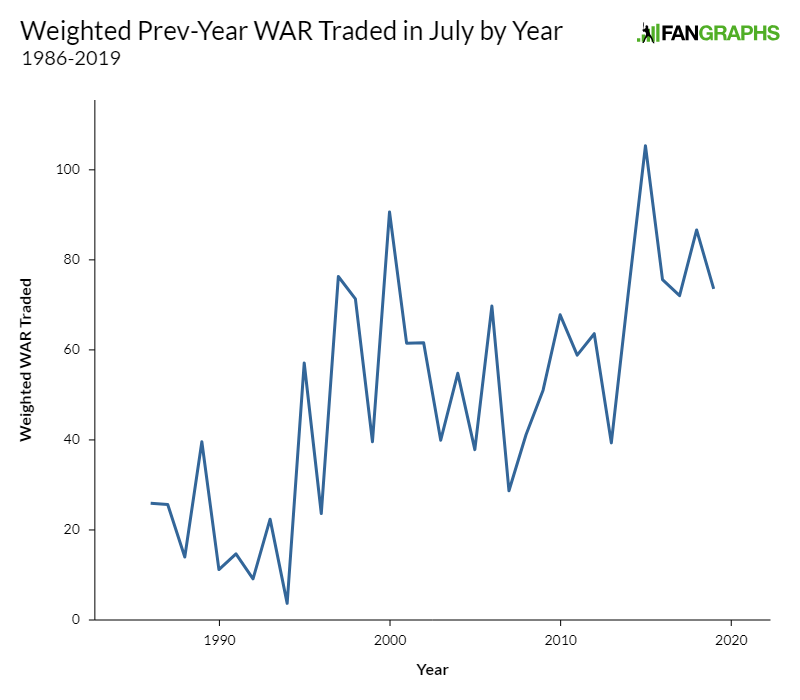
Now 2019 looks totally normal, if a step down from the fever pitch of 2015. Look at current-year WAR, and the trend mostly holds:
So, there you have it. A spectacularly quiet beginning of the month and a noisy last few hours add up to a thoroughly average deadline. I wanted to check one more thing, though. The last few hours felt wild, absolutely bonkers, from my perspective. Granted, my perspective was sitting at my computer banging out transaction analysis after transaction analysis while Ken Rosenthal fired hot trade announcements directly down the internet at me, but still — it felt busy.
I decided to look back on previous years’ deadline days to see if we’d ever had anything quite so mad. Craig Edwards and I theorized earlier this week that the loss of a waiver trade period in August might lead both buyers and sellers to lean harder into brinkmanship, a game-theoretical concept that involves purposefully waiting to negotiate until the last possible instant to increase pressure on your counterpart to deal fairly.
The concept is straightforward: when there’s little cost to failing to reach an agreement, it’s often advantageous to wait around for a better offer. Until you reach a time period where failing to compromise (read: agree to a trade) is costly, therefore, deals are unlikely to be made. Baseball hasn’t had a lot of brinkmanship in trades recently, because the August waiver trade period gave buyers and sellers who missed out a second chance to negotiate. The real world, though, is rife with these situations — think every government debt ceiling negotiation. In any case, with the trade deadline unified to July 31st this year, brinkmanship was in play.
Let’s take a look at the number of wins traded on the last day of the deadline in each year (July 31st for every year other than August 1st in 2016), both in terms of previous-year WAR and current-year WAR. I’ll use the weighted versions from above to account for relievers:
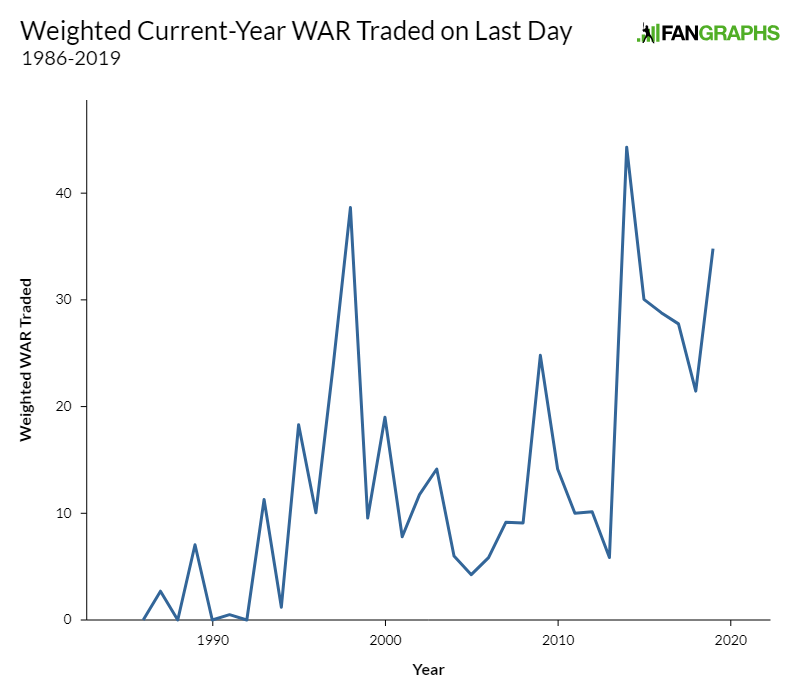
Now we’re talking. 2019 has been one of the busiest deadline days on record, even if the overall month of July was rather unremarkable. Is this because of the switch to a unified deadline? It’s hard to say for sure. It could also be due to the extreme stratification of the AL and the extreme parity of the NL, or to the particular preferences of the executives making trades this year. It’s hard to generalize a rule based off of one year of data. Still, look at the number of players traded on July 31, and tell me you don’t think the new deadline rules had an impact:
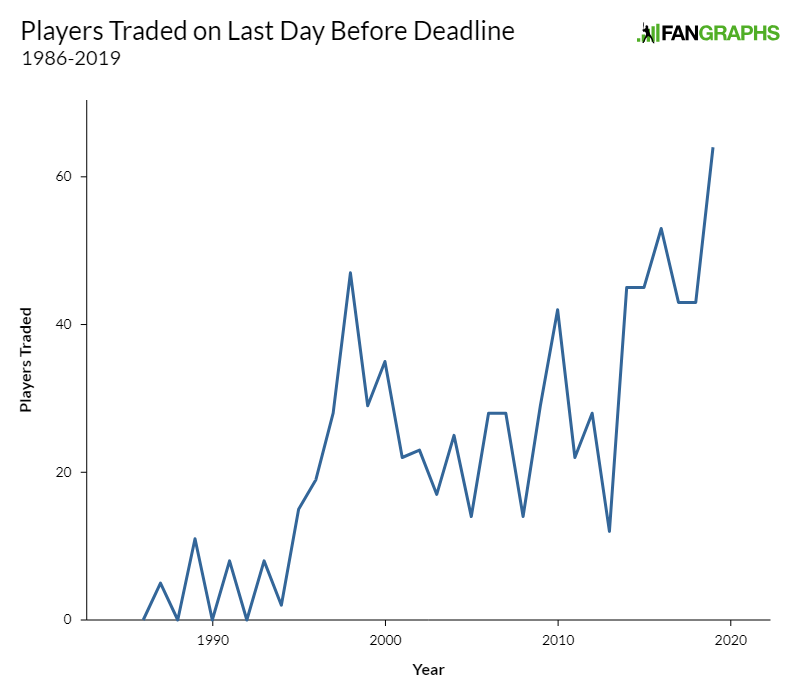
So, there you have it. Was the 2019 deadline busy? It depends on your perspective. When we look back on the year as a whole, it’s going to blend into the background. A decent number of players were dealt, many of them relievers. The number of total wins moving around the league was maybe a hair below average, though nothing to get too excited about.
If you only cared about the last day, however, then this year was monumental. There’s never been a year quite like 2019. More than half of all of July’s trades were compressed into a single furious day of deals. Just because 2019 was an outlier in terms of last-day trades, however, doesn’t mean that it’s a one-off. With the new unified trade deadline in place for the foreseeable future, I believe teams will be increasingly incentivized to hold off on trades until the last possible moment.
If the goal was to create a big event, a single day where baseball activity creates a resounding din that drowns out all other sports, mission accomplished. You could hardly take a step today without tripping over a reliever who had just been acquired by the Nationals. If the goal was to change the total number of trades made, then the verdict is still out. Maybe it’s time to move the deadline to August 15th, or to think about different ways to incentivize competing. For now, though, the unified deadline’s main effect seems to have been pushing everything to the last possible moment, without greatly affecting the overall number of deals.
My colleague Craig Edwards pointed out that the 2016 trade deadline was actually August 1, as July 31 was a Sunday. That didn’t change the results much, but the graphs above have been updated to reflect the August 1 deadline.
Ben is a writer at FanGraphs. He can be found on Bluesky @benclemens.
“Trolling” is certainly one way to describe what Bauer does…