Starting Pitching is Making a Postseason Comeback
The death of the starter has been greatly exaggerated. On the heels of a regular season in which starting pitchers threw a smaller share of innings than ever before, and one year after a postseason in which they threw barely over half the total innings, it seemed quite possible that the trend might continue this October, particularly with each of the four 100-win teams spending September scrambling for a fourth option and some of them publicly floating novel ideas about how things might unfold. Admittedly, it’s early in the 2019 postseason, but already we’ve seen some monster pitching performances in the playoffs — Justin Verlander‘s seven innings of one-hit ball, Gerrit Cole‘s 15 strikeouts, Adam Wainwright’s 7.2 scoreless innings — and in general more reliance upon teams’ front-of-the-rotation starters than in the recent past.
Consider: in all of the 2018 postseason, just four times did a starting pitcher throw 100 pitches in a game: Walker Buehler twice (in Games 3 of the NLCS and World Series), Hyun-Jin Ryu once (Game 1 of the NLDS), and Verlander once (Game 1 of the ALDS). Already this year, seven pitchers have done it: Buehler (again), Verlander (again), and Patrick Corbin in their respective Division Series openers, Cole and Jack Flaherty in their respective Games 2, Adam Wainwright in Game 3, and Max Scherzer in Game 4. The count of seven-inning starts isn’t quite there yet, but last year, there were nine in 66 total starts (13.6%), but just four in the Division Series. This year, there have been seven in 28 Division Series starts (25%):
| Player | Game | Tm | Opp | IP | H | R | ER | BB | SO | HR | Pit |
|---|---|---|---|---|---|---|---|---|---|---|---|
| Justin Verlander | ALDS Gm 1 | HOU | TBR | 7.0 | 1 | 0 | 0 | 3 | 8 | 0 | 100 |
| Gerrit Cole | ALDS Gm 2 | HOU | TBR | 7.2 | 4 | 0 | 0 | 1 | 15 | 0 | 118 |
| Jack Flaherty | NLDS Gm 2 | STL | ATL | 7.0 | 8 | 3 | 3 | 1 | 8 | 1 | 117 |
| Mike Foltynewicz | NLDS Gm 2 | ATL | STL | 7.0 | 3 | 0 | 0 | 0 | 7 | 0 | 81 |
| Adam Wainwright | NLDS Gm 3 | STL | ATL | 7.2 | 4 | 0 | 0 | 2 | 8 | 0 | 120 |
| Mike Soroka | NLDS Gm 3 | ATL | STL | 7.0 | 2 | 1 | 1 | 0 | 7 | 0 | 90 |
| Max Scherzer | NLDS Gm 4 | WSN | LAD | 7.0 | 4 | 1 | 1 | 3 | 7 | 1 | 109 |
As we’re in small-sample territory, this may well be randomness at work. More likely, it’s a byproduct of these teams having time to set up their rotations down the stretch, and working in a bit of extra rest along the way. Either way, it bears watching over the next few weeks given the backdrop of the regular season. In 2018, the share of innings thrown by starters dropped below 60% for the first time (59.9%), and this year, it fell by another two points — 903 fewer innings thrown by starters. The total number of innings thrown by starters is down by 3,834.1 relative to 2014, just five years ago. Here’s a graph of it by volume:
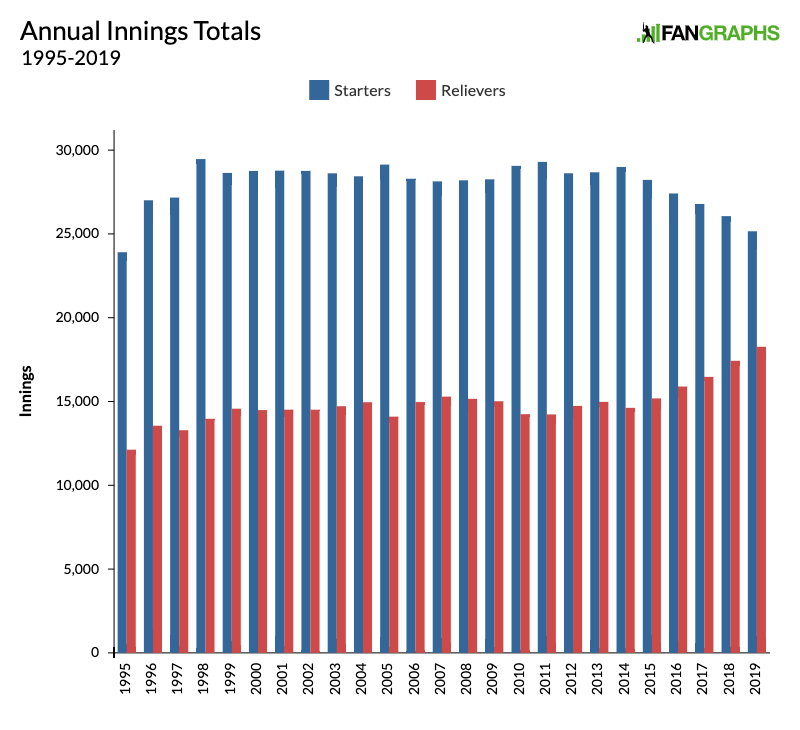
As you can see, things were fairly stable from 1998-2015, that despite a very wide range in scoring environments, from as high as 5.14 runs per team per game in 2000 to as low as 4.07 in ’13. During that span, which included expansion, the height of the PED scandal, the advent of testing, and the adoption of loose pitch count standards and innings limits on young pitchers — basically, a whole lot of change. And yet, the major league-wide average innings total for starters (2,8685.1) remained in a narrow range, with a standard deviation of just 381 innings per year, about 1.3% of the total. The total workload fell below 28,000 innings for the first time in 2016, then below 27,000 in ’17, and below 26,000 this year.
The primary drivers of the drop, I believe, are deeper pitch counts — a byproduct of higher strikeout rates — and an increasing understanding that starters are generally less effective in facing batters for the third time in the game than prior, that relievers are generally more effective in facing batters for the first time than starters are in any of those appearances, and that batters are less effective when they lack the platoon advantage. Hence the increasing reliever workloads. Here’s a look at the average number of batters faced per game by starters, broken down by times through the order. Obviously, the maximum is 9.0, and thanks to the rise of the opener, we’ve seen the average for the first time fall from 8.97 as recently as 2017 to 8.85 this year, with the average for the second time falling from 8.71 to 8.24 in that span, and the third time falling from 6.68 in 2014, to 5.99 in 2016 to 5.13 last year and 4.84 this year:
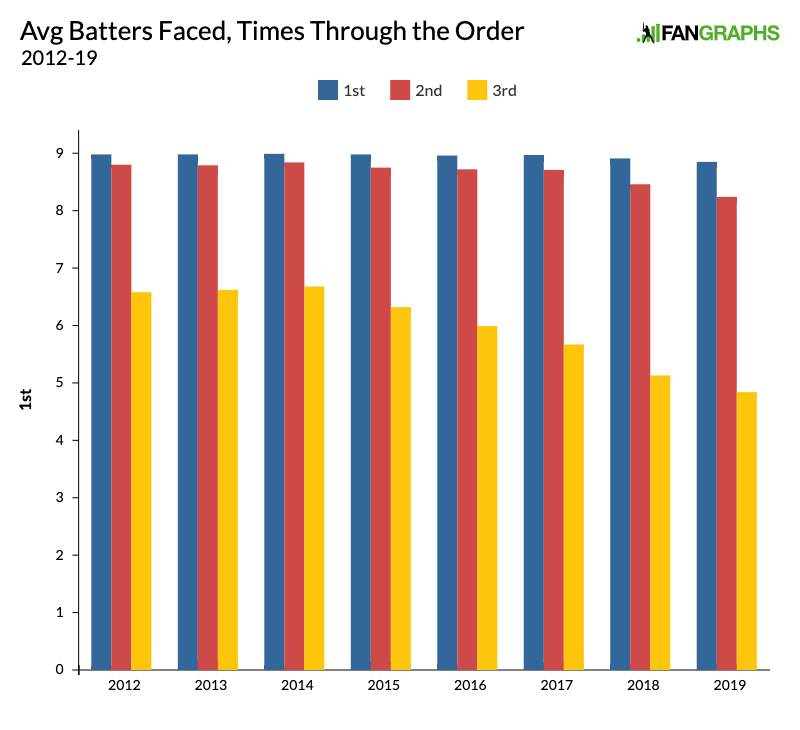
Overall, the volume of batters faced by pitchers a third time through the order has dropped 23.3% since 2015. Over the past two years, we’ve seen an interesting change in the performance patterns as well:
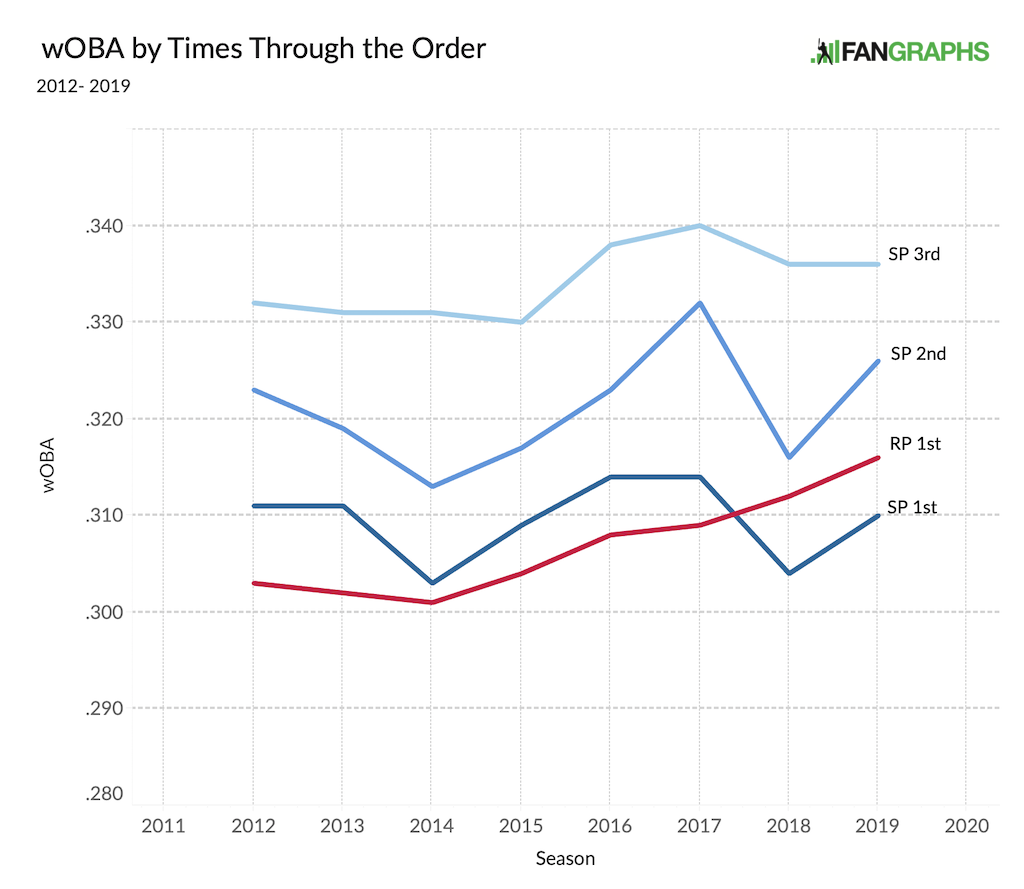
Last year, for the first time during the time frame covered by our splits (2002 onward), relievers were less effective the first time they faced a batter than starters were. This tracks with Craig Edwards’ observation from August 21 that relievers were no longer out-pitching starters in terms of FIP. While the gap was as big as 0.32 runs per nine just three years ago (starters 4.48, relievers 4.16), it was cut to 0.15 last year (starters 4.21, relievers 4.06) and disappeared this year (4.51 for both). In that time, scoring levels have risen again, the strategy of using openers has gained some popularity, there’s been an increasing polarization between good teams and bad, and possibly some talent dilution as well.
That part of things is an issue for another day. The point is, starter regular season workloads: down. In recent years, we’ve seen it drop to an even greater degree in the postseason…
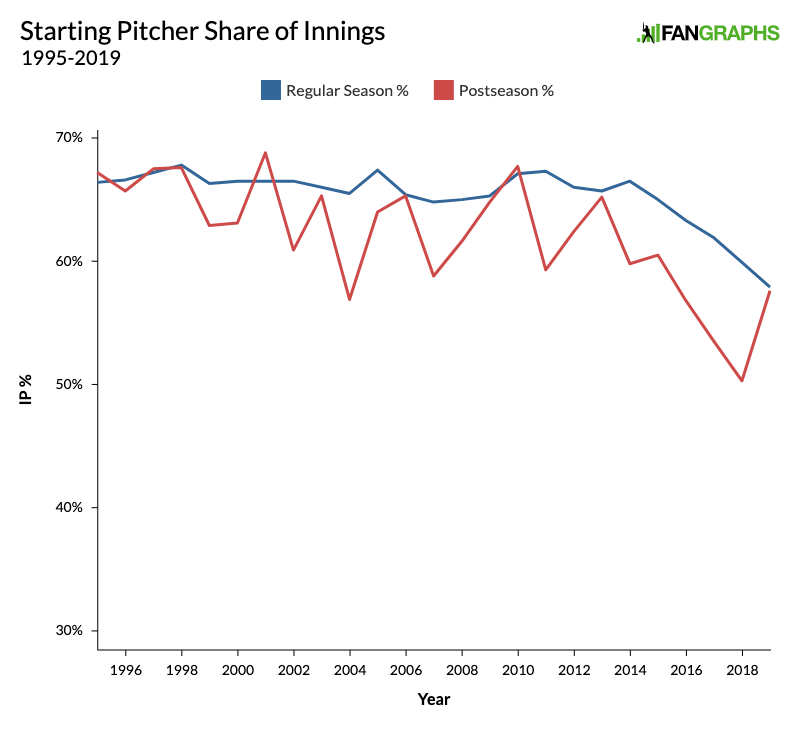
…except for this year, or at least the part of this year that’s through Monday (both Wild Card games, plus four games apiece in the NLDS, three apiece in the ALDS) — 32 total starts. We’re seeing around a seven-point bump over last year’s level, from 50.3% to 57.6%, or 59.0% if you use Division Series Game 3 as a cutoff for the purposes of year-to-year comparisons; again it’s worth noting that we’re talking mainly about the fronts of rotations, aces and generally-solid second and third starters. And they’ve pitched well, posting a 2.73 ERA, down from last year’s overall mark of 3.90 and thru-DS Game 3 mark of 3.47. If this ERA holds (ha!) it would be the lowest mark since 2001 (2.69). Meanwhile, bullpens have been lit for a 5.14 ERA through Game 3, which would be the worst mark of the Wild Card era by nearly half a run (2004, 4.65). With every bullpen performing more or less like that of the Nationals during the regular season — they were 24% above the major league average scoring level in terms of runs per nine, while all relievers right now are 26.6% above — it’s no wonder managers are sticking with starters.
Workload-wise, it’s worth comparing where we are to this point, relative to the recent past. Dialing back to the start of the Wild Card game era in 2012, since that has an effect on the choice of starting pitchers:
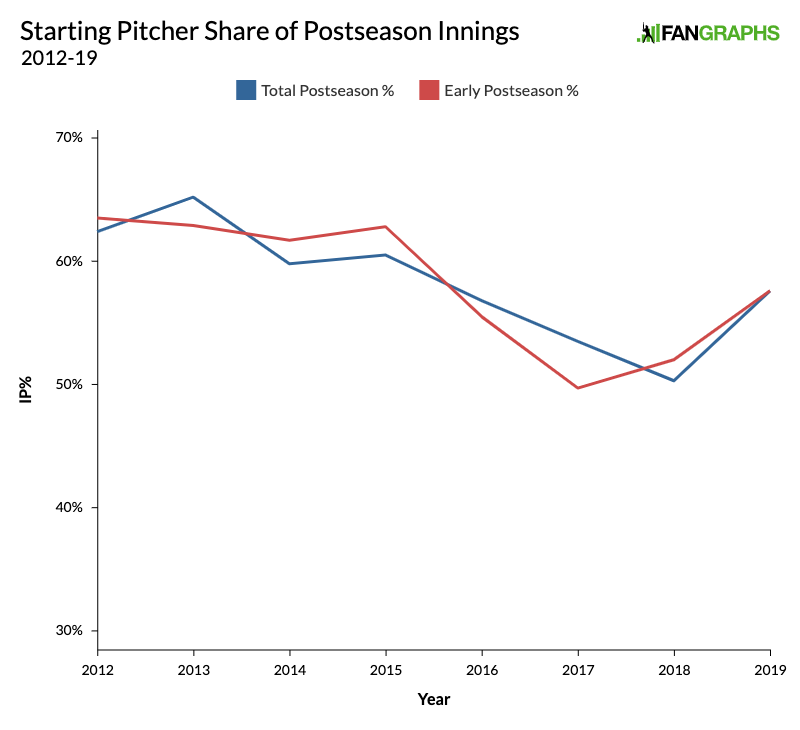
As you can see, the early-postseason share of starter innings has varied relative to the overall share — some years lower, some higher — but this year is as high as it’s been since 2015, the year that marks the endpoint of the long stretch of regular season stability. Perhaps that share owes something to the talent level of the pitchers in question, and while there are multiple ways to determine that, a spot check suggests there’s something to that theory. Through all of the Division Series Games 3 this year (28 starts total), 15 were taken by pitchers with a FIP- in the majors’ top 30, while 14 were taken by pitchers with an ERA- in the top 30 (120 IP cutoff for both). Using the same specs, last year, when the share was 8.4 percentage points lower, the counts were 12 by FIP- and 13 by ERA-, while in 2015, before things started to change, it was 15 by FIP- and 14 by ERA- — the same as this year.
All of this is rather striking given the chatter we heard in September, as even the best teams scrambled for a fourth postseason starter and floated ideas suggesting departures from orthodoxy. Even before they lost Domingo Germán to administrative leave in connection with a domestic violence allegation, Yankees manager Aaron Boone told Sports Illustrated’s Tom Verducci, “We’re going to be a little untraditional. The only one we might use as a traditional starter is Paxton.” Boone envisioned shorter stints for Luis Severino, if he proved to be healthy upon returning from a lat strain, with Germán and/or J.A. Happ in piggyback roles, and Chad Green possibly serving as an opener. Masahiro Tanaka even took his final turn of the season by coming out of the bullpen following Green, “in case we ever were to do something where it’s a little bit of a unique role or doing an opener role,” as Boone explained.
Elsewhere, Rich Hill‘s mid-September MCL sprain prevented him from getting stretched out to handle a full starter workload and threw a handful of other Dodgers — none of them stretched out either — into the mix for their fourth spot. Michael Pineda’s PED suspension and the rough second halves of Kyle Gibson and Martín Pérez led the Twins to start rookie ex-Uber driver Randy Dobnak, who had opened and started a total of five times all season, in Game 2 against the Yankees, with the number four spot up for grabs. Neither Hill nor Dobnak survived the third inning of their respective games, bringing the starter innings share stats down somewhat. As the Twins were swept, we’ll never know just what Rocco Baldelli had up his sleeve for Game 4.
Through Monday, none of what unfolded, starting-wise, did much to push the envelope unless you count the Braves’ Dallas Keuchel pitching on three days of rest while the team held Mike Foltynewicz back for Game 5. On Tuesday, the Astros will send Verlander back to the mound on three days’ rest; Wade Miley’s struggles over his final six starts (12.60 ERA, 6.08 FIP) cost him the fourth starter job, and the team chose to bypass 24-year-old rookie Jose Urquidy, who has just 41 major league innings under his belt. The Rays will be this year’s first team to detour from convention — because of course they will — countering Verlander with Diego Castillo, who’s never gone more than two innings in 17 turns as an opener, starting as part of a bullpen game.
With the Yankees moving on to a best-of-seven series, we’ll see where they go with their fourth starter; as for the other series, things are still up for grabs. Having tracked the numbers underlying this trend for a couple of days before publishing this, I imagine the overall performance levels will up more closely aligned with the recent past, but for now, the contrast is striking enough for the trend to bear watching.
Brooklyn-based Jay Jaffe is a senior writer for FanGraphs, the author of The Cooperstown Casebook (Thomas Dunne Books, 2017) and the creator of the JAWS (Jaffe WAR Score) metric for Hall of Fame analysis. He founded the Futility Infielder website (2001), was a columnist for Baseball Prospectus (2005-2012) and a contributing writer for Sports Illustrated (2012-2018). He has been a recurring guest on MLB Network and a member of the BBWAA since 2011, and a Hall of Fame voter since 2021. Follow him on BlueSky @jayjaffe.bsky.social.
SP have been yanked too early several times as well. I think teams are now more afraid of Twitter backlash from not using arms and prioritizing favorable matchups than they are with winning games. The Dodgers may have cost themselves game 4 by not leaving Maeda in for longer – but they wanted to get Urias in there. Maeda was making quick work of the Nats – when he is on he is on and you have to take as much of that as you can.
Honestly, I don’t think teams are basing in-game decisions on Twitter outrage, which comes from a small percentage of fans.
Wow really excellent point – just excellent. I think managers are absolutely thinking about how their moves will be received on Twitter rather than trying to win. It just makes perfect sense. Really great contribution Mr. Dobbs.
As a Nats fan, I was not sad to see Maeda go.
I do think the Dodgers are more of a paint by number thing- if x do y. Little to no room for gut decisions. It cost them in 2017 vs Houston, it cost them 2018 vs Boston, and it could cost them here. Houston and Boston didn’t play them by the book… A lot of gut decisions. Washington doing the same thing.
I can’t wait until the Nats intentionally walk Alex Bregman to face Yordan Alvarez as the winning run, and he hits a game winning HR because he plays for the Astros and not the Dodgers.
Or the Nats let Scherzer pitch to Springer with the bases loaded and one out in a 5 run game and Springer hits a grand slam cause he plays for the Astros and not the Dodgers. But at least they’ll have used their gut, which is always the Most Important Thing.
It’s not always the most important thing, but there again, going with it can lead to good things…. The Dodgers and Dave Roberts are too beholden to the book. It’s great for the Regular season. But in the playoffs?
So much of what the Dodgers have in my opinion is based on the Regular Season. Depth. Overflowing bullpen- constant shuffling from LA to OKC to always have a fresh pen. It’s incredible for the regular season. But for the playoffs- you can’t just manage by the numbers. Playoff baseball doesn’t work that way.
The Dodgers are this generations Atlanta Braves(well, minus actually winning a championship, something the Braves did do).
This is very very dumb.
It would have made no sense to let Maeda hit for himself in the 5th inning of a tied game after he got 4 outs. There was only one out when his spot in the lineup came up, so letting Maeda hit would have been sacrificing a chance to start something with less than 2 outs. Of course, AJ Pollock is somehow worse than a pitcher at this point, so you can argue about that choice, but in theory the move to pinch hit for him made sense.
It’s surely not Twitter outrage.
It IS possible we’ve reached a point where the reliance on statistical analysis and expected outcomes is taken as a greater gospel (at least in some cases) than the evidence on the field of play at that immediate time.
The average number generator that is Kenta Maeda is one thing. The actuality of Kenta Maeda at any given point in any given game is something different. We don’t hesitate to pull a guy early when he clearly doesn’t have “it”, but seem very hesitant to let him stick around when he does.
You just really wonder if the Dodgers let Maeda go how good he would be…. I would have never moved him from the rotation quite frankly.
Then you haven’t seen Maeda as a starter, b/c he’s noticeably horrible after the 2nd time around the order.
that’s funny, the numbers don’t pan it out
1st time thru .157/.245/..309 .554 OPS
2nd time thru .221/.286/..312 .598 OPS
3rd time thru .216/.269/.505 .774 OPS
so league wide this season:
1st .245/.311/.419 .730 OPS
2nd .261/.324/.452 .776 OPS
3rd .269/.330/.474 .803 OPS
so he’s better than average the 3rd time thru. Hardly horrible….
And last year here were his numbers
1st time- .242/.296/.412 .708 OPS
2nd time- .247/.298/.396 .694 OPS
3rd time- .209/.333/.374 .707 OPS
But they had to move him to avoid the Competitive Balance Tax with his bonuses.
I think the article above illustrates that in fact starters are staying in more… he even includes graphs! Lol
How different would this be if Milwaukee had played 4 more games and Washington 4 fewer? This is always kind of fluky, and depends on the relative strengths and weaknesses of the teams involved.
Yeah, I think better managers try to use their best players as much as possible. Especially when there are more off days and each game means more. That means relievers if you are the Yankees, or Brewers and starters if you are the Astros, Dodgers, or Nationals.
The playoffs are a small sample size and if you have teams like the Royals and Indians in the WS in 2014 – 16 with a few really good relievers and lesser SP (especially the Royals) it looks like a trend. Then you get teams like the Dodgers and Astros having deep post season runs with good, starting pitching and it looks like a new trend.
2016 Cleveland though still had 68.1 ip in 15 games that postseason. over 4.5 innings per start..
2015 KC had 82.2 ip in 16 games that postseason. 5.17 innings per start.
There’s that- and then there’s Milwaukee last year with only 3.3 innings per start.
It definitely depends on teams’ respective compositions, but I don’t think I’d call it “fluky”. It’s clearly been a trend the last few years (with many of the same teams in the postseason year to year!) and it’s interesting that it seems like that trend may be reversing this year.
Houston(Greinke), Washington(Corbin), Atlanta(Keuchel), Tampa(Morton) all went out and acquired a starter either in the off season or during the regular season.
one thing that is kind of bad to look at with the year to year numbers is last year you had Milwaukee with 10 games and their 33 innings pitched. That really kind of skews last years numbers a lot.
Brewers used an opener against the Dodgers who didn’t record an out (Wade Miley), then had Woodruff follow and pitch 5.1 innings as a more traditional starter, so their 33 innings is also misleading.
but what is used in Jay’s calculations is 33 innings… That’s the point. They were so out of the box that it impacts the year to year numbers. I’d compare this year to 2017 as more of a apples to apples comparison.
As a Dodger fan, I’m a bit frustrated that we appear to have made some of our pitching decisions based on the potential for which starters could be used as relievers later in the series. To wit, Buehler starting Game 1 is fine, he is our most dominating hurler, but starting Kershaw in Game 2 appears to have been done largely so that Kershaw could theoretically be used in Game 5.
Now, since all that came out, Ryu has volunteered to be available in Game 5 too, the opposite of which was part of the rationale for moving him back to Game 3.
Ideally we don’t have to rely on Kershaw OR Ryu tonight and I guess I should be happy we have a rested Buehler on the mound. It seems like with an 8 man bullpen and more frequent days off, we should be able to cover 9 innings without relying on someone coming in in a role they are not 100% familiar with. In the past when we used Kershaw, he was still in his [regular season] dominant phase. Using him now would appear to be . . . desperate?
Like it or not the way pitchers have been used in the postseason has completely evolved from the bullpen revolution pioneered by Francona to the current situation where starters are now ready to come in almost any time.
None of the pitching decisions really matter that much when the Dodgers offense has struck out 52 times in 4 games and gone 4-30 with RISP. I don’t know how many times teams win when they strike out 17 times in a game, but they lost Game 2 because they struck out 17 times and couldn’t get a hit against Daniel freaking Hudson after a leadoff double and loading the bases.
Chris Taylor swings through a terrible, absolutely terrible hanging slider from Scherzer with the bases loaded yesterday, Pollock has 10 K’s in 12 at bats…Pederson misses a bases clearing double by what, one inch…it’s the Dodgers offense, this is what they do.
Imagine the outrage from Dodgers fans if we went into a postseason with Daniel Hudson as arguably the best reliever and “closer”. And he’s pitched two innings and given up 0 runs, and closed out two wins. He’ll probably close out Game 5 tomorrow too when the Nats win the series. But of course, this is how it goes in a short series, all it takes is a few lucky breaks or bad bounces or perfectly timed mistakes and you lose.
Good news is the Dodgers can count on winning 100 games next year, running away with the division and losing in the playoffs again. It’s the circle of life.
the pitching decisions last night impacted things though some. Was a tie game entering the 5th. And the Dodgers used Urias for the 2nd straight day- 1st time he’s been used back to back all season. And it showed. Then Baez came in and it was over.. Took the pressure off the Nats to a large degree. Never had a PA after that where the EWA was lower than 90% for the Nats. So the pressure after that wasn’t on the Nats. A lot easier for Doolittle and Hudson to come into the game up 6-1.
That’s just not remotely true…again. Urias was used back to back days literally in September, on 9/24 and 9/25 and went 1.2 innings with 2 K’s and 1 BB, no hits, no runs. He also pitched on 9/17 and 9/18 against the Rays and went 2 innings, struck out 4, gave up 1 hit and 1 walk. so 3.2 innings with 6 K’s, 3 baserunners and 0 runs. Literally a few weeks ago.
From June 5th on, Urias allowed 8 total earned runs, 2 of which came when he made a spot start at Coors Field. He’s been one of the best relief pitchers in baseball for months now, let alone on the Dodgers, and it 100% made sense to bring him in. He gave up a sharply hit single to Turner, and then Rendon had a 78mph broken bat single (on a pitch literally on the inside corner, according to baseball savant) to score a run and then Kendrick had a 91mph jam shot liner on a perfectly located pitch off the inside corner. Oh and got Soto out on three pitches. Not exactly a disaster, and more a product of bad luck than missed location or dropped velocity.
But you know, let’s reverse engineer a narrative.
so that counteracts the good luck he had in game 2 where Kendrick had a dumb baserunning play that killed the rally the Nats had.
I do stand corrected on Urias. Still only the 3rd time all year for him. And also first time all year long with 3 games in 4 days. And he was not as sharp as he’s been.
Eh, it’s ignoring a lot to say “just keep Maeda going”. He’d already pitched 1.1 innings (20 pitches) in Game 4 when he was removed for a pinch hitter, and he’d also pitched in Game 3 the day before.
I don’t know. Taylor battled. Scherzer’s pretty tough. We still had chances separate from that play.
I have a pet theory. If a team has its mid-rotation starter go no more than 4-5 innings, and then it gives the ball to a succession of 5 relievers to get the last 15 outs, it is walking a fine line. If all goes according to plan, this is probably a smart strategy. You are more likely to win that game, and cut the series short, so as to not burn out your arms. This is what won the Royals their world series.
BUT, if things don’t, you are in trouble. You’ve burned multiple pitchers in a loss, and over a 5 or 7 game series, all the additional work can add up. This is what fell the Brewers last year, and then the Dodgers in the prior world series.
Having a Verlander or Folty to soak up 7+ good innings is a safer plan, if you can acquire or develop such pitchers.
There are more off days during the playoffs, though. You’re not likely to burn out your bullpen even if they have to cover 4+ innings two days in a row.
Although, it can become an issue if you have to do it too many times over multiple series.
I think it’s bigger over a single series. You let the same batter see a pitcher 4 and 5 times and eventually that pitcher isn’t getting the batter out.
Article in the Washington Post about last night’s fifth inning, discusses just that:
https://www.washingtonpost.com/sports/2019/10/08/ryan-zimmermans-blast-will-be-most-remembered-these-four-at-bats-set-stage-perfectly/
Having any starter soak up 7+ good innings is obviously preferable. But as we saw in Houston/Tampa game 4, that isn’t always an option, even when you are running a Verlander out there. As much as I have been a fan of Folty and enjoyed his second half redemption story this season, I am really nervous about what kind of performance we will get out of him in game 5. I think just getting 5+ innings of 2 run our less pitching from him would be huge for the Braves.
The Cardinals had no issue finding a 4th starter. Yes, they lost a starter to a recent injury, but he was their 5th starter, anyway. They may be the only ones, though.
Is this the year when starters coming back to start or relieve on short rest (particularly in these early rounds) jumps the shark? From what I recall, the data shows less effectiveness across the board and even the winning teams likely have knock-on effects in later rounds. Maybe actually using your 4th starter normally will become the new optimal strategy if a couple big names falter this year.
Somehow, I doubt it. We have decades of data by this point showing how much less effective post-season pitchers are on less than 4 days of rest. One more year of data unfortunately seems unlikely to sway managers from old habits.
It’s early in the playoffs and teams are pulling out all stops to advance. It’s possible that as starters get more tired after lots of postseason innings and relief appearances relievers will be used more. Also 7 game series may mean more different pitchers used.
Kind of comical the day after this column comes out, we have a game where the starters go 5.1 innings. COMBINED! Meaning 11.2 innings were done by bullpen.