
The Pre-Arb Bonus Pool Is A Success
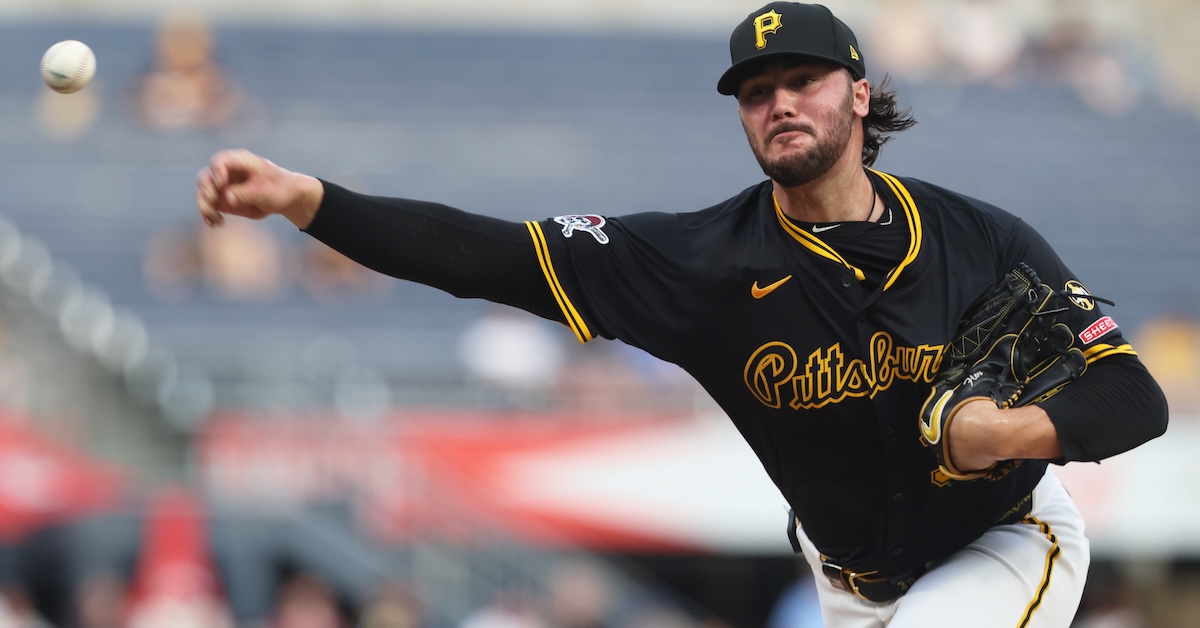
Last week, MLB announced the distribution of the pre-arbitration bonus pool. You probably saw roughly one headline from this: Paul Skenes earned a record $3,436,343 bonus for his spectacular sophomore season. That is indeed great news, in my opinion. Skenes was one of the most exciting and best players in baseball in 2025, and a compensation system that more closely aligns skill with salary is a no brainer to me. But while Skenes’ record haul drew the headlines, the vast majority of the $50 million pool was spread widely; 101 players received bonuses, with all 30 teams boasting at least one awardee.
I’m here to tell you that I think this is a wonderful development. The fund, established in the most recent collective bargaining agreement, takes in $1.67 million from each team every year to fund its $50 million payout. It hands some of that money out to award winners, from $2.5 million for Skenes’ Cy Young Award win down to $150,000 for Daylen Lile’s fifth-place Rookie of the Year finish. The rest goes to the top 100 pre-arbitration players in a WAR formula jointly calculated by MLB and the MLBPA according to a set ratio.
This didn’t feel like a huge part of the CBA at the time it was signed, but in my opinion, it’s been an incredible boon for the game. Baseball’s compensation system has always been out of whack. The service time system limits all pre-arbitration players to the minimum salary, more or less. Teams do occasionally award salaries slightly greater than the minimum ($760,000 in 2025), but generally by a de minimis amount: The Pirates paid Skenes $875,000 this year, for example.
That flat structure means that under the old system, Skenes would have earned roughly $1.6 million in 2024 and 2025, instead of the $7.2 million he’s pocketed under the new system. You can’t convince me that that’s a bad thing. Cristopher Sánchez is an even better example, because unlike Skenes, he didn’t have a huge signing bonus as an amateur — not to mention all the ancillary income the Pittsburgh superstar earns through his various endorsement deals as one of the most recognizable players in the sport. Sánchez just eclipsed three years of service time; through the end of 2024, the Phillies had paid him around $2.5 million in salary for his first two-plus major league seasons. He signed a contract extension that paid him $3.55 million in 2025, bringing his career contractual earnings up to roughly $6 million. Thanks to the bonus pool, though, he’s received an additional $3.5 million over the last three years. That’s a huge difference, and in a clearly good direction for money to flow.
You can think of the bonus pool as a subsidy to teams who play young players. By funding the bonus pool evenly across all 30 teams instead of making the club employing each player responsible for paying the bonus, teams who employ a host of great pre-arb players can have it all: They contribute a set amount, but their pre-arb contributors get paid more fairly.
Take the Brewers, for example. Though Skenes got the largest individual bonus, Milwaukee took the most bonus money home as a team. Ten Brewers received a cumulative $4,742,392 in bonuses, led by Brice Turang with $1.15 million. That was only the ninth-highest individual award; the Brewers simply had a ton of plus contributors in the pool. Here’s a list of the bonus pool broken down by team:
| Team | Players | Bonus |
|---|---|---|
| MIL | 10 | $4,742,392 |
| PIT | 5 | $4,362,309 |
| ATH | 4 | $3,103,411 |
| PHI | 1 | $2,678,437 |
| CHC | 3 | $2,548,721 |
| BOS | 5 | $2,303,753 |
| HOU | 1 | $2,206,538 |
| ARI | 3 | $2,117,416 |
| MIA | 6 | $1,976,000 |
| TBR | 4 | $1,963,124 |
| DET | 6 | $1,914,238 |
| KCR | 4 | $1,909,309 |
| CIN | 4 | $1,766,368 |
| SEA | 2 | $1,762,742 |
| ATL | 3 | $1,732,122 |
| STL | 5 | $1,527,976 |
| NYY | 5 | $1,486,327 |
| TEX | 4 | $1,300,082 |
| CHW | 4 | $1,231,452 |
| WAS | 3 | $978,527 |
| SDP | 3 | $925,033 |
| BAL | 2 | $874,269 |
| CLE | 3 | $860,536 |
| TOR | 3 | $775,998 |
| LAA | 2 | $756,247 |
| LAD | 2 | $761,948 |
| SFG | 1 | $494,307 |
| COL | 1 | $460,214 |
| NYM | 1 | $270,987 |
| MIN | 1 | $209,217 |
For the first time, all 30 teams had at least one player receive a bonus. Yet, for the most part, the bonus pool has flowed to teams who fill their roster with young productive players. Those teams are a mixed bag of small-market strivers and big-budget teams with good player development systems:
| Team | 2022 | 2023 | 2024 | 2025 | Total |
|---|---|---|---|---|---|
| BAL | $3,306,145 | $7,257,343 | $3,838,270 | $874,269 | $15,276,027 |
| SEA | $3,953,499 | $4,098,252 | $2,842,742 | $1,762,742 | $12,657,235 |
| MIL | $821,328 | $1,080,357 | $4,465,828 | $4,742,392 | $11,109,905 |
| HOU | $4,714,235 | $1,728,513 | $1,554,930 | $2,206,538 | $10,204,216 |
| CLE | $3,825,033 | $3,145,116 | $2,057,316 | $860,536 | $9,888,001 |
| ARI | $2,809,839 | $2,558,203 | $2,127,172 | $2,117,416 | $9,612,630 |
| PIT | $643,435 | $1,489,432 | $2,882,298 | $4,362,309 | $9,377,474 |
| KCR | $926,241 | $1,525,402 | $4,948,427 | $1,909,309 | $9,309,379 |
| ATL | $2,915,872 | $2,662,099 | $632,821 | $1,732,122 | $7,942,914 |
| TBR | $2,455,631 | $2,924,147 | $0 | $1,963,124 | $7,342,902 |
| ATH | $439,755 | $1,011,273 | $2,564,069 | $3,103,411 | $7,118,508 |
| DET | $293,739 | $2,271,815 | $2,259,378 | $1,914,238 | $6,739,170 |
| STL | $2,811,595 | $778,171 | $1,433,521 | $1,527,976 | $6,551,263 |
| CIN | $947,108 | $2,143,712 | $1,390,620 | $1,766,368 | $6,247,808 |
| CHC | $824,606 | $2,199,080 | $667,851 | $2,548,721 | $6,240,258 |
| BOS | $245,152 | $1,015,788 | $2,462,659 | $2,303,753 | $6,027,352 |
| TOR | $4,035,334 | $516,590 | $487,594 | $775,998 | $5,815,516 |
| NYY | $1,539,831 | $246,549 | $2,319,056 | $1,486,327 | $5,591,763 |
| PHI | $304,294 | $1,438,281 | $1,141,671 | $2,678,437 | $5,562,683 |
| TEX | $855,683 | $2,205,744 | $702,019 | $1,300,082 | $5,063,528 |
| LAD | $2,459,017 | $986,983 | $586,051 | $761,948 | $4,793,999 |
| MIN | $795,132 | $2,085,595 | $1,564,758 | $209,217 | $4,654,702 |
| CHW | $2,979,410 | $356,317 | $0 | $1,231,452 | $4,567,179 |
| MIA | $622,043 | $1,303,326 | $653,453 | $1,976,000 | $4,554,822 |
| LAA | $1,657,217 | $536,825 | $705,665 | $756,247 | $3,655,954 |
| SFG | $900,540 | $666,778 | $1,577,638 | $494,307 | $3,639,263 |
| WAS | $517,840 | $608,194 | $1,114,321 | $978,527 | $3,218,882 |
| SDP | $679,340 | $0 | $1,191,534 | $925,033 | $2,795,907 |
| COL | $0 | $809,831 | $1,212,391 | $460,214 | $2,482,436 |
| NYM | $0 | $350,284 | $615,947 | $270,987 | $1,237,218 |
From a qualitative perspective, this bonus pool has been a huge success. It’s paying the most underpaid class of major league contributors, and the way it’s allocating the money seems broadly intuitive. Is it the right amount of money, though? To do that, I had to do a little bit of math. I took salary and WAR data for 2019-2025 and grouped players by their contractual status. I used both Cot’s Contracts and RosterResource to harmonize my sources; contract data can be difficult to come by.
The proportion of WAR created by pre-arb, arb, and post-free-agency players has been fairly constant over the past seven years. (Note: I excluded the abbreviated 2020 season from my calculations because it was just so weird.) Dividing the era into old CBA and new CBA, you can see that the overall proportion of WAR coming from players who haven’t yet reached free agency has remained roughly the same, though with more pre-arb and fewer arb players:
| Group | Old CBA | New CBA |
|---|---|---|
| Pre-Arb | 38.40% | 40.70% |
| Arb | 33.44% | 30.46% |
| Free Agent | 28.16% | 28.83% |
In terms of contractual salaries, the share of money going to pre-arb players hasn’t increased much:
| Group | Old CBA | New CBA |
|---|---|---|
| Pre-Arb | 14.20% | 14.48% |
| Arb | 25.16% | 24.18% |
| Free Agent | 60.64% | 61.35% |
That means that in terms of dollars paid per WAR accrued, pre-arb players have seen their salaries increase at a lower rate, relative to the WAR they rack up, than free agents. Here’s that formula turned into dollars per WAR; the pre-free-agent group combining pre-arb and arb has seen its $/WAR increase by about 19% in the new CBA, as compared to 17.9% for free agents:
| Group | Old CBA | New CBA | Increase% |
|---|---|---|---|
| Pre-Arb | $1,500,135 | $1,711,416 | 14.1% |
| Arb | $3,012,109 | $3,832,994 | 27.3% |
| Free Agent | $8,690,899 | $10,245,360 | 17.9% |
These numbers don’t include the new bonus pool. On-field value is still measured the same way, but after adding the bonus money to pre-arb players, total outlay looks more balanced:
| Group | Old CBA | New CBA |
|---|---|---|
| Pre-Arb | 14.20% | 15.36% |
| Arb | 25.16% | 23.93% |
| Free Agent | 60.64% | 60.71% |
In terms of dollars per WAR, things look even better. With the bonus money taken into account, players who have yet to reach free agency have seen their $/WAR increase by 22% under the new CBA, much better than the 19% that they would have realized without this addition:
| Group | Old CBA | New CBA | Increase% |
|---|---|---|---|
| Pre-Arb | $1,500,135 | $1,834,735 | 22.3% |
| Arb | $3,012,109 | $3,832,994 | 27.3% |
| Free Agent | $8,690,899 | $10,245,360 | 17.9% |
In other words, the bonus pool is doing exactly what it was supposed to, increasing salaries to the players who have historically been less compensated per contribution than their tenured compatriots. I think it could be expanded even more, in fact, or broadened to include players already eligible for arbitration. The exact mechanics are open to change, and I’m not particularly tied to the WAR calculation or the structure of award compensation, but it seems clear to me from the salary data that the general goal of the pre-arbitration bonus pool is being fulfilled.
Ben is a writer at FanGraphs. He can be found on Bluesky @benclemens.
Great article Ben! Side note, but this seems like soft confirmation that my assumption that the current $/war number for free agents is about $10 million, as opposed to the old $8 million number that often gets used
I use a hybrid formula for my contract modeling that’s something like 7.5/9.5/11.5 for the first 3 WAR a given player produces now. I agree that $8m/WAR is outdated, but I think it hasn’t been updated that much because it got more and more clear that teams treat salary non-linearly.
Right, that’s why I soft confirmation. Obviously a full analysis would need to be more detailed.
Edit: this was meant to be in reply to sadtrombone below.
Not this again. You can’t calculate the price of a win this way! The price of a win is based on expected outcome and not actual outcome. It’s what you would pay. What Ben is showing instead is the return on investment.
You can’t do this for an individual player, but would the net amount of all free agents kind of cancel out? Teams will miss on any specific player, but overall, assuming they’re making rational decisions, would expected outcome be pretty similar to actual outcome?
It would need to be balanced out by an equal but opposite amount of value that teams unexpectedly get from their free agents. In other words, if pred is the prediction a team makes for player x, then some teams will have bad luck (pred – underperformance) while other teams will have good luck (pred + overperformance). If the sum of underperformance is balanced out perfectly by the sum of overperformance then adding up WAR totals would give you the true value of the sum of pred and then could calculate $/WAR.
(In reality it probably wouldn’t work out this way anyway because $/WAR is almost certainly not linear which would make this a hundred times harder to calculate, but let’s just assume it’s flat for a minute. Also, it literally costs more $ to sign a player if you’re over the tax line, good luck assigning values to specific players in specific offseasons for that one. Also, we’re assuming everyone is using a $/WAR calculation, which is probably not true for every franchise and every deal. Also, teams are frontloading the value on the contract so that almost every deal looks better two years in than it will in four, five, six, seven years in)
But let’s ignore everything in the parentheses for a minute. Even if we assume none of that matters, I think that assumption is probably very wrong. It’s one thing when a team misses by giving Teoscar Hernandez $14M to put up half a win ($/WAR here is about $28M per win). That is often balanced out somewhere by a particularly good signing, like Nick Pivetta getting $2.5M to put up about 3.5 to 4 wins ($/WAR here is about $0.67M per win). Where this really gets thrown off is injuries. Anthony Rendon alone inflates the cost of a win with his roughly $60M per win deal. Corbin Burnes probably is going to throw this year’s calculations off too. Teams simply do not get lucky enough with free agents to balance that out.
On a side note, this also highlights the problem of reversing the temporal order of events. Under this sort of a calculation, it means that when players do worse the price goes up. And when players do better the price goes down.
Yes, that makes a lot of sense. Even the most simple models should use projected vs actual WAR.
The problem is that we don’t know what the team’s internal calculations are. I think it’s probably something like 75% of the player’s value the previous year and 25% of the year before that, but it’s hard to say if I am on the right track or not.
Why not remove injured players? At least at a point, generally speaking, teams expect some time missed, e.g. they don’t sign a guy to play 162 games, they sign them to play 145 games. Or if you’re the Dodgers, you sign them to pitch 60 to 90 innings and the playoffs.
And then I won’t pretend to know how insurance works, but I know that teams insure both big money contracts as well as guys they might consider prone to injury.
So the signing didn’t go as planned that year, but only according to plan A. But non-Colorado teams have contingencies, and contingencies for their contingencies. Only one is Buxton where that contingency is built in and visible, for everyone else we just don’t really know.
So not knowing the insurance details for injured players, especially on multi-year contracts, why not only use qualified players and just pull out the injury noise? Leave the underperformers, the DFAs, the demotees, the overperformers, the vesting options, the awards incentives, the bonus pools, everything else, all that still happens. But remove injured players from any given year – based on a threhold – and just know that the calculation doesn’t include big injuries which are obviously more costly to the team.
It’s an imperfect macro stat anyways, as long as it’s applied evenly we’d know what the cost of a win for your on-the-field product is. It would limit the volatility that an injuries can add, as opposed to getting 0.4 WAR from three injured guys who made 80M which would significant enough to skew the calculation by up to 7 figures. Basically it’d be cost per win plus cost lost to injuries kept as a different metric. Still a lot of noise in there that would make a projection a moving target, but retroactively we know what each player was actually paid, so it seems like the injury factor is the only thing we truly can’t account for..
There is something wrong, or at least weird, in Bob Nutting’s competitor businesses paying his most valuable employee several times as much as Bob Nutting pays him.
I’ll go with “weird”. But baseball, as a business, is inherently a bit “weird”. If each franchise is an individual business, then the league is made up of 30 inherently interdependent businesses. Think about it this way: if the league contracted back to 26 teams (as an example), revenues for everyone would like take a hit, but a survivable one. If the league contracted back to 8 teams (or, more extreme, 4 teams), the business model completely implodes.
Agreed, MLB is in competition with the NFL, NBA, and NHL for fans/customer dollars. But the MLB teams are in a mutually cooperative arrangement, one team alone can’t really exist, even the Globetrotters need the Generals and the Savana Bananas have a league of six teams.
But MLB teams don’t really compete with each other. Fans of the Red Sox and Yankees go to games in Baltimore, because they can get tickets. Lots of marketting and TV revenue is common to the entire league, and then there’s revenue sharing, because the big market teams need credible opponents to play.
New leagues (such as the WPBL) often have a common ownership, because the team ownership groups in sports leagues aren’t actually competing with each other.
I don’t understand MLB’s tolerance for owners like Nutting, they’re basically parasitic and hurt the league by taking common revenue and revenue sharing and not plowing that money back into the business, but the big teams have reason to want the small market teams to invest in the sport and the bonus pool is a way to force them to actually give players some money (the bonus pool is another 1.67 million dollars of Nutting’s MLB money going to players rather than into his pocket).
But the process of “giving” money in this way isn’t financed by individual owners, it’s collectively financed.
The interesting chart to me above was the 4 year payout by team. Teams towards the bottom of the standings that we might expect to be “rebuilding” should do well here. But some consistent losers at the bottom include CHW, LAA, WASH, and COL. Seems to be more a marker of simply poorly run orgs.
Appreciate the article. I’d be interested in knowing how many “player-years” for each of the categories of pre-ARB, ARB, and Free Agent players are included in the tables. Obviously, it should be a lot of pre-ARB player “player-years” and fewer ARB player and Free Agent player “player-years.” So both the pay and the fWAR produced is more diffusely spread over a larger number of pre-ARB players.
Agree with this 100%. I think the only way you were going to get the teams to agree to a structure like this was to have everyone ante up the same amount. Any system that 1) increases the flow of money from owners to players based on performance 2) allocates money amongst the players more fairly has to be seen as a win-win. It’s good for the sport, because it encourages teams to bring along young, exciting players.
I also agree that the pool size should probably be increased — I think it’d make sense to tie to a percentage of minimum salary. Let’s start with, say, 2x min salary — that’s roughly where it is now (I think 2026 is a min salary of 780K; that’d be a “pool fee” of $1.56 mil each). I think you could probably even goose that multiplier a bit higher (2.25 would take us to about $1.7 mil) and still have an agreeable system.
Also pretty neat that it was a 16/14 split in terms of a positive “ROI”, both for 2025 individually and the whole CBA period — that tells me the framework is pretty sound. It’s also interesting that the money largely appears to be flowing to mid-to-low market teams; Atlanta, the Cubs and Boston were the only large-ish market teams to have a benefit.
Trevor May on one of his streams earlier this year said the MLBPA original proposal for the Pre-Arb bonus pool was $250M.
Other thought as more of a site-related thing: would it be possible to get this pre-arb bonus pool info on player pages and/or the RosterResource team breakdown lists? Having a consistent source for this data wrapped into all of the available info here would be awesome.
I understand the claim that smaller-market teams are having their payroll subsidized a bit here, because more of their players are receiving some compensation from this bonus pool. Makes sense to me!
But I also wonder if a longer-term opposite effect might also come to be. I recall reading somewhere, years ago, that players who got paid big amateur signing bonuses were less likely to sign team-friendly extensions, as their earnings floor was higher because they’ve already received a couple million dollars. If players like Cristopher Sánchez earn more from this bonus pool, does that make them less likely to sign extensions because they’re now earning more in the first couple years? If so, does that affect the competitiveness of low-payroll teams in a meaningful way? I have no idea, just spitballing. But if I’m the Brewers or Marlins GM, I might not be so quick to celebrate my players getting an extra chunk of change.
This is why the union should have increasing pre-arb money as the biggest priority (aside from defeating a cap, which is DOA anyway from their point of view).
I prefer just increasing the minimum because it’s cleaner. I’m guessing the owners like this approach better because an increase to the minimum is also a de facto increase to the salary floor.
But for the purposes of extensions, this has a similar effect because these are the players most likely to get extensions.
“This is why the union should have increasing pre-arb money as the biggest priority (aside from defeating a cap, which is DOA anyway from their point of view)” The union leadership won’t go for that. Remember last time the executive sub-committee (filled with players that had already got paid in free agency) unanimously voted against the deal. These players, and the agents representing them, are all about increasing the top and not helping the young players.
I think that used to be true, but they got this and improved conditions for MiLB in the last CBA. Soi thank they are coming g to realize that focusing only on the biggest salaries is not the best way to go about it.
I think you’re right, but also, what else are they going to negotiate for aside from raising the tax line?
They are still being underpaid by several dozen million dollars. Ignoring Skenes because he’s an outlier; Cristopher Sanchez has been paid $9m in his career and last season produced 6.4 WAR, or roughly $64 million at market rates.
Put differently, Cody Ponce will be making more next year after one great season in the KBO than Sanchez has made in his whole career even with the bonus.
Were the “pre-arb/arb/FA” buckets solely based on Service time? In other words, is Cal Raleigh in the “arb” bucket even though he signed an extension before the season?
Yes. That’s because the pre-arb pool works that way. Players who have signed extensions are still eligible, it’s based solely on service time. I used the same logic in compiling these tables.
It’s interesting to see the trends surprised that in 2024 TBR had $0
That caught my eye too! I always thought of TBR as a player development powerhouse.
Huge success. Fans want to see the best players get a chance to play instead of being stashed in the minors, and this helped right the incentives for the teams a bit, solved a collective action problem.
I think the tend lately is for players to come up to young. Not fully developed. IE. Brady House
Just got to say that there is no calculation. That is all after the fact. This idea was borrowed from the NFLPA which devised it as a way to compensate somewhat properly day 3 picks who end up starting. It levels the playing field for players with no rights. An analysis of arb settlements going forward is how to look at the numbers. If it moves the general numbers up is how the effect goes. Because it is a league sanctioned reward, it should push first year arb numbers up. All the rest is noise.
Everyone loves to talk about the Orioles failures to sign free agents, especially pitchers, as the cause of their 2025 struggles. But the table above that shows their drop-off in pre-arb bonuses in 2025 is the real story (although the pitching definitely didn’t help).
Ideas for the next CBA:
1) Increase minimum salary to $1M for rookies, $1.25M for second-year players, $1.5M for third-year players
2) Increase this bonus pool from $1.67M to $3M per team
3) Increase these numbers by ~5% per season