
The ZiPS Midseason Standings Update
We’ve now passed the mathematical halfway point of the 2025 season, which serves as a good time to check in on the ZiPS projected standings and analyze the ways in which reality has torn the preseason prognostications to shreds. While our depth charts utilize the ZiPS projections in the daily standings, this full ZiPS run utilizes the most robust methodology that I can assemble without pulling out what’s left of my increasingly dwindling supply of hair.
The ZiPS projected standings are the product of a million seasonal simulations. In order to get a better estimate of the upside and downside of the team, ZiPS takes an important additional step in simulating the roster itself before it ever considers a single game on the schedule. For example, in most of the New York Yankees’ simulations, Aaron Judge continues destroying pitchers on his merry way to what ZiPS projects will be an 11-WAR season, playing somewhere between 80% and 95% of the remaining games. Sometimes he regresses less from his current 13-WAR pace; other times, he drops off the pace a little bit more. Sometimes he’s dinged up a bit and misses time, and once in a while, he misses the rest of the season due to a serious injury. After an injury simulation, ZiPS fills in the depth charts in each sim based on who is available. When Judge is injured, the Yankees roster strength is typically made with more Jasson Domínguez, sometimes more Everson Pereira or Bryan De La Cruz, maybe some Spencer Jones, or as in simulation no. 111,535, a whole lot of Brennen Davis and Duke Ellis somehow. There’s a lot of PC power (I made an upgrade in May!) and a distressing amount of linear algebra involved.
Once ZiPS has a simulated distribution of a team’s roster strength, it then simulates the results of the rest of the season a million times. (Here I’ll note that a million simulations was not enough to get the Rockies into the playoffs.)
Below are the updated ZiPS projected standings through the games played on July 2. We’ll start our look with the AL East:
| Team | W | L | GB | Pct | Div% | WC% | Playoff% | WS Win% | 80th | 20th |
|---|---|---|---|---|---|---|---|---|---|---|
| New York Yankees | 91 | 71 | — | .562 | 61.0% | 31.1% | 92.1% | 11.7% | 95.6 | 86.9 |
| Tampa Bay Rays | 87 | 75 | 4 | .537 | 19.0% | 50.5% | 69.5% | 3.2% | 90.8 | 82.3 |
| Toronto Blue Jays | 86 | 76 | 5 | .531 | 17.7% | 48.0% | 65.7% | 2.6% | 90.5 | 81.6 |
| Boston Red Sox | 81 | 81 | 10 | .500 | 1.7% | 17.7% | 19.4% | 0.7% | 84.1 | 75.6 |
| Baltimore Orioles | 77 | 85 | 14 | .475 | 0.5% | 8.3% | 8.8% | 0.5% | 81.6 | 72.9 |
The Yankees offense slowed down considerably in June, which if you believe parts of Reddit, is somehow due to too much analytics. The more likely cause is that the Yankees are extremely reliant on Judge playing like a demigod, and when he has an ordinary month — a 157 wRC+ qualifies by his standards — the lineup has trouble absorbing what were down stretches for other key parts of the offense. ZiPS still sees the Yankees as the AL East team with the fewest potential problems over the next three months, even if it doesn’t think that Max Fried and Carlos Rodón will keep up their blistering pace.
The Blue Jays’ improvements this year should serve as a reminder (though they probably won’t), that people are too wedded to recent terrible/great performances. Coming off a 74-88 season in 2024, the Jays didn’t do a whole lot to really change the nature of their team, and the biggest thing they did do — signing Anthony Santander — hasn’t worked out yet. Sometimes gravity takes care of things!
The Rays have done their usual excellent patchwork job, but ZiPS isn’t really sold on the lineup maintaining wRC+ of 109 over the rest of the season. The computer is optimistic about Boston’s pitching staff, but the divisional math is getting difficult, and this is a team that didn’t really aggressively chase the playoffs when similarly situated in the race the last few years. ZiPS still thinks the O’s are a good team, albeit one with serious rotation issues, but they’ve banked so many losses that it’s getting hard to say that their current long shot odds are enough to keep 2025 a going concern.
Turning to the AL Central:
| Team | W | L | GB | Pct | Div% | WC% | Playoff% | WS Win% | 80th | 20th |
|---|---|---|---|---|---|---|---|---|---|---|
| Detroit Tigers | 93 | 69 | — | .574 | 91.6% | 5.5% | 97.1% | 7.3% | 97.4 | 88.8 |
| Cleveland Guardians | 81 | 81 | 12 | .500 | 4.6% | 25.6% | 30.3% | 1.7% | 85.8 | 77.2 |
| Minnesota Twins | 80 | 82 | 13 | .494 | 3.1% | 19.8% | 22.9% | 1.1% | 84.7 | 76.0 |
| Kansas City Royals | 78 | 84 | 15 | .481 | 0.8% | 7.0% | 7.8% | 0.3% | 81.2 | 72.7 |
| Chicago White Sox | 53 | 109 | 40 | .327 | 0.0% | 0.0% | 0.0% | 0.0% | 56.9 | 48.6 |
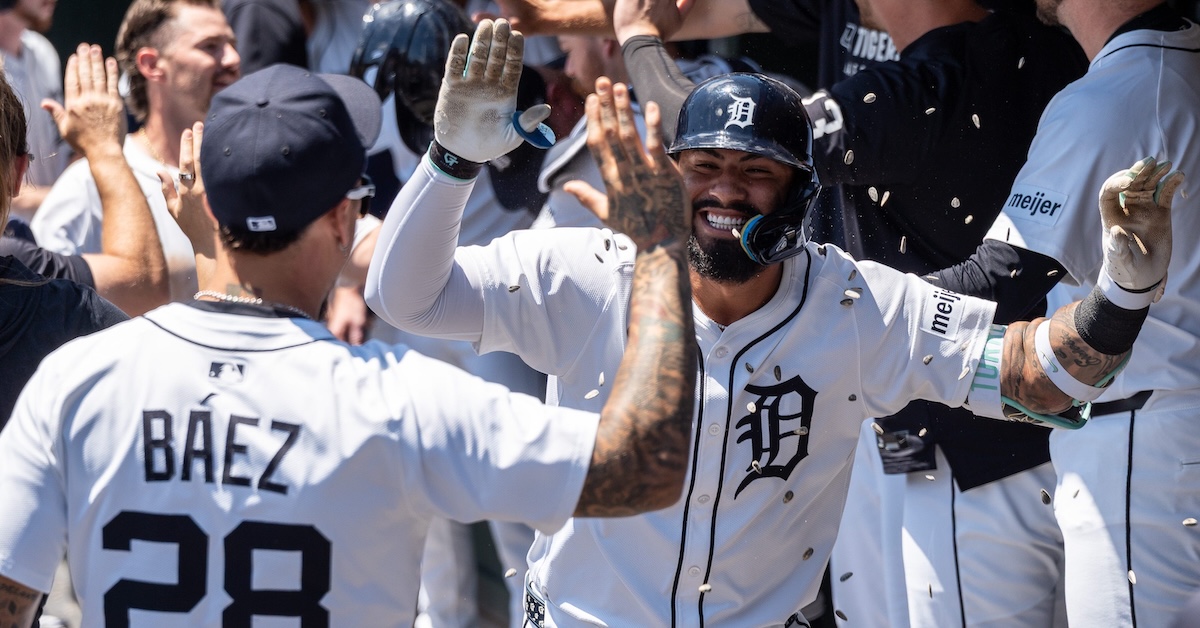
The Tigers have pretty much ended this race, and with an excellent rotation headed by the best pitcher in baseball right now, Tarik Skubal, this is an extremely dangerous playoff team. Detroit’s projected final win total has increased more than any other team in the baseball, jumping from 81 wins to 93.
ZiPS still sees the Guardians and Twins as legitimate playoff contenders, though it doesn’t have a great deal of enthusiasm for their rosters. I don’t expect either team to be particularly aggressive at the trade deadline.
Jac Caglianone has struggled in the majors so far, and while I fully expect him to overcome his growing pains, it also means that he hasn’t done much to resuscitate an abysmal offense. Kansas City’s pitching has been excellent, but it’s simply not enough. The White Sox are projected to finish with a 12-win improvement compared to 2024! That’s… something, I guess. Somehow, the pitching has been approximately league average, and if they can actually finish the season that way, maybe pitching coach Ethan Katz deserves the Cy Young award.
Looking to the AL West:
| Team | W | L | GB | Pct | Div% | WC% | Playoff% | WS Win% | 80th | 20th |
|---|---|---|---|---|---|---|---|---|---|---|
| Houston Astros | 94 | 68 | — | .580 | 88.1% | 9.8% | 97.9% | 12.9% | 98.8 | 89.9 |
| Seattle Mariners | 85 | 77 | 9 | .525 | 9.7% | 50.2% | 59.9% | 3.4% | 89.5 | 80.9 |
| Texas Rangers | 81 | 81 | 13 | .500 | 2.1% | 23.9% | 26.1% | 1.0% | 85.2 | 76.5 |
| Los Angeles Angels | 74 | 88 | 20 | .457 | 0.1% | 2.5% | 2.6% | 0.0% | 78.4 | 69.6 |
| Oakland A’s | 70 | 92 | 24 | .432 | 0.0% | 0.1% | 0.1% | 0.0% | 72.9 | 64.3 |
The Astros’ penchant for middling starts showed itself again this year, but as has been the case in the past, no other AL West team took the opportunity to build up a big cushion in the division. A seven-game lead at this point of the season isn’t an insurmountable one, but most teams with that kind of lead end up finishing with it. That’s especially the case when the team holding the comfortable lead is also likely the “true” best team in the division. The Astros are no juggernaut, but they can ride Hunter Brown and Framber Valdez, and the offense has been better than it had any right to be given the de facto loss of Yordan Alvarez and the de jure one of Kyle Tucker.
The Mariners have been surprising in that their offense has been a lot better than their pitching, and while ZiPS sees that flipping to a degree, they have enough holes that they still look like a .530-.540 team; that won’t be enough in most situations unless the Astros collapse. ZiPS is projecting a lot more Jacob deGrom innings these days than it was in March, but the holes in the lineup and at the back end of the rotation and bullpen leave Texas projected as merely a second-tier Wild Card contender.
Despite a near .500 record, ZiPS is still bearish on the Los Angeles Angels. Elsewhere, ZiPS thought the A’s had a pitching problem, and that’s basically what has transpired; the team’s early contention was a mirage.
Shifting to the National League, staring with the East:
| Team | W | L | GB | Pct | Div% | WC% | Playoff% | WS Win% | 80th | 20th |
|---|---|---|---|---|---|---|---|---|---|---|
| Philadelphia Phillies | 93 | 69 | — | .574 | 65.1% | 27.5% | 92.6% | 9.8% | 96.9 | 88.4 |
| New York Mets | 90 | 72 | 3 | .556 | 34.0% | 46.8% | 80.8% | 6.3% | 94.0 | 85.5 |
| Atlanta Braves | 79 | 83 | 14 | .488 | 0.9% | 9.1% | 10.0% | 0.5% | 83.4 | 74.6 |
| Miami Marlins | 71 | 91 | 22 | .438 | 0.0% | 0.2% | 0.2% | 0.0% | 75.3 | 66.5 |
| Washington Nationals | 69 | 93 | 24 | .426 | 0.0% | 0.1% | 0.1% | 0.0% | 73.7 | 65.1 |
The Phillies have been tested by Aaron Nola’s poor start and subsequent injury, but this was always a compelling unit and they’ve carried on without serious trouble. They do need to score more runs to keep holding off the Mets, and Bryce Harper’s injury highlighted the fact that he, Kyle Schwarber, and Trea Turner have been holding up the lineup.
The Mets have cobbled together an impressive rotation seemingly from spare parts, and ZiPS is actually fairly confident they’ll be fine after a rather gloomy June. ZiPS sees the Mets as being as strong as the Phillies, but the Phillies get a projected edge by virtue of an easier schedule (ZiPS says .497 vs. .505 for the Mets) and the two-game “head start” on the second half.
ZiPS still thinks Atlanta is a very competent team, but even if you assume that there aren’t more nasty pitching injury surprises waiting and that there’s nothing fundamentally broken about Ozzie Albies or Michael Harris II, the team has a 39-46 record, and is at the point where they have to consider short-term retooling.
The computer thinks the Nationals are better than the Marlins, but are now too far behind to be a factor in the playoff race.
Moving to the NL Central:
| Team | W | L | GB | Pct | Div% | WC% | Playoff% | WS Win% | 80th | 20th |
|---|---|---|---|---|---|---|---|---|---|---|
| Chicago Cubs | 92 | 70 | — | .568 | 62.5% | 27.0% | 89.5% | 6.9% | 96.1 | 87.4 |
| Milwaukee Brewers | 88 | 74 | 4 | .543 | 27.1% | 43.2% | 70.3% | 4.2% | 92.5 | 83.7 |
| St. Louis Cardinals | 84 | 78 | 8 | .519 | 7.4% | 28.8% | 36.3% | 1.3% | 88.2 | 79.6 |
| Cincinnati Reds | 82 | 80 | 10 | .506 | 3.0% | 16.3% | 19.3% | 0.5% | 85.6 | 76.7 |
| Pittsburgh Pirates | 73 | 89 | 19 | .451 | 0.0% | 0.7% | 0.7% | 0.0% | 77.3 | 68.7 |
ZiPS was a massive believer in the Cubs in the preseason, being head-over-transistors in love with the team’s offense and defense, and not absolutely hating the pitching staff. That’s about how the team has played, so the projections naturally haven’t changed too much. ZiPS also saw the Brewers as the biggest danger to the Cubs, and again, it hasn’t moved off that position.
St. Louis and Cincinnati are both above .500, but the computer still sees the Cards as too broadly mediocre and the Reds as having too many positions that have been chasms for either to be a divisional threat without some things going their way. Both are plausible Wild Card teams.
The projections are actually bullish on the Pirates scoring more runs in the second half, with much of the lineup underperforming their peripheral numbers, but it’s largely in the category of “too little, too late.”
Lastly, let’s look at the NL West:
| Team | W | L | GB | Pct | Div% | WC% | Playoff% | WS Win% | 80th | 20th |
|---|---|---|---|---|---|---|---|---|---|---|
| Los Angeles Dodgers | 99 | 63 | — | .611 | 95.9% | 3.9% | 99.7% | 19.6% | 103.7 | 95.1 |
| San Diego Padres | 86 | 76 | 13 | .531 | 3.1% | 51.4% | 54.5% | 3.2% | 90.6 | 81.5 |
| San Francisco Giants | 82 | 80 | 17 | .506 | 0.6% | 22.7% | 23.3% | 0.6% | 86.4 | 77.6 |
| Arizona Diamondbacks | 82 | 80 | 17 | .506 | 0.5% | 22.3% | 22.8% | 0.9% | 86.2 | 77.7 |
| Colorado Rockies | 49 | 113 | 50 | .302 | 0.0% | 0.0% | 0.0% | 0.0% | 53.6 | 45.1 |
ZiPS was always skeptical of the notion that the Dodgers ought to be projected for a crazy number of wins, with the preseason projections thinking that the biggest benefit to come from the team’s offseason was protecting itself from injury downside. I don’t always agree with my creation, but I did in this case. That’s sort of how things have played out; the injuries hit the pitching as hard as they usually have, but the high-end offensive talent has compensated, and team is on a 102-win pace. I’ll note that this ZiPS run was a late-night one, and does give a pretty big hit to Max Muncy’s playing time after the grisly injury he sustained in yesterday’s game. In reality, the Dodgers have a large enough lead that his exact timetable shouldn’t change the projections significantly.
The Padres have been solid and are a first-tier Wild Card candidate, but they’ve probably fallen too far behind to scare the Dodgers. It doesn’t help that they’ve gotten basically no offense out of left field and designated hitter this year. The Giants are hitting their projections after falling short the last few years, but they have a similar problem to the Padres and have gotten sub-.700 OPS performances at prime offensive positions (first base, right field, and DH).
The Diamondbacks have disappointed, in large part due to a number of serious injuries, and the team, seeing the writing on the wall, has been hinting about being short-term sellers this summer. If they aren’t, however, ZiPS still thinks that they’re good enough to end up with a Wild Card spot without anything ridiculous happening.
For their part, the Rockies can be content with the fact that they’re one of the 30 best teams in the majors.
Dan Szymborski is a senior writer for FanGraphs and the developer of the ZiPS projection system. He was a writer for ESPN.com from 2010-2018, a regular guest on a number of radio shows and podcasts, and a voting BBWAA member. He also maintains a terrible Twitter account at @DSzymborski.
Ethan Katz has a pretty good track record developing guys who the Sox will eventually trade away for prospects. Seeing him turn a staff anchored by a Rule 5 pick into a league average staff isn’t totally shocking. Them developing a single good hitter would be.
The White Sox also have a great track record with minimizing DL time for pitchers, going back to Don Cooper days.
I know this article is about this year specifically, but since Matt Arnold took the reins in Milwaukee the Brewers have dead nuts even matching 100 wRC+ and 100 FIP- marks.
Over 410 games, I’d imagine the median projection for those teams would be somewhere around 205 W – 205 L.
Instead they’ve gone 233 W – 177 L for the 3rd best record in MLB over that stretch.
I guess my question(s) are something along the lines of what percentile have the Brewers been playing at for over 2.5 years now to overachieve to such an extent? and if a team plays at an outlier percentile over such a long period of time (their +71 wins over the FG Playoff Odds Preseason Projected Win Totals are best in MLB from 2016-24) maybe their baseline needs to be recalibrated?
If they’ve been dead average on wRC+ and FIP- then there are two things that could explain this:
1) Outstanding usage of relievers (some of this is probably it, but I think it’s way behind the second one)
2) DEFENSE (this team has been running out elite defenders all over the diamond for years now)
The first one is the kind of thing that would have to persist across managers to explain this, so maybe the front office is giving the managers a ton of good data. I also think this is probably harder to maintain even if you do know what you are doing.
The second one is absolutely the kind of thing that is stable from year to year, and the Brewers are killing it again this year. Things are a little less extreme now that Caleb Durbin has replaced Willy Adames in the infield and Blake Perkins is hurt but they’re still running out two shortstops and two center fielders every day. Just a super robust group.
Also base running, where the team has generally excelled.
Defense is the big one no doubt. 100 FIP- but an MLB best 89 ERA- since 2023 with +129 DRS, +92 FRV, and a -0.45 ERA/FIP gap (next best is -0.27).
I guess this is sort of what I was getting at with the whole recalibration thing. Over their last 410 games the Brewers have a -0.45 ERA/FIP gap but the current depth charts project them for only a -0.06 gap rest of season.
Big difference between saving four or five runs rest of season (.06 projected gap x 76 remaining games) and saving forty four runs rest of season (.58 gap of their active pitchers x 76 remaining games).
I wouldn’t expect them to maintain that -0.58 gap rest of season, but seems like splitting the difference and projecting them around even something like a -0.25 ERA/FIP gap would go along way towards making their projection more accurate by a couple two tree wins at least.
Defense is so hard to project that it gets regressed back towards zero for everyone except guys like Francisco Lindor. But the Brewers don’t have one guy with that kind of track record, they have a ton of players who got moved down the defensive spectrum and are excelling at their new positions. Having a whole team of above average defenders who are all going to get regressed back towards zero? There is no good way to project that with all the instability in defensive grades.
See also: the Jays’ recent team-building philosophy. Their defense over the last three years or so has been pretty consistently stellar all over, but when the bats underperform (like in 2024) it really makes you long for the days of Teoscar Hernandez and Lourdes Gurriel smacking a few dingers, fielding prowess be damned.
But when Bo, Kirk, and Springer’s moribund bats regress back to “not a total dumpster fire” in 2025, you realize “great defense + some offense” sure plays better than “great defense + no [non-Vlad] offense whatsoever“. Those margins between first place and fifth sure seem razor thin sometimes.
(Made all the better when Michael Kay is sniveling on-air that the Jays aren’t really a first place team and the Yankees are still superior – you tell yourself whatever you need to when you’re getting swept in a 4-game set, there, chief…)
FIP- is too inaccurate of a metric for past analysis. We’ve long known that pitchers do in fact have significant control over outs made on balls in play, after all. Using a better pitching metric like SIERA, xERA-, or even plain ol’ ERA- might help explain the apparent inconsistency.
I think the Athletics probably are what their record says they are, but I do wonder a little bit about how much playing in that stadium is hurting them. I wasn’t sure whether playing in a minor league park would grind them down, or if they would get used to it and other teams would be at a disadvantage. Right now it looks like the first one, they are 15-27 at home (-84 run differential) and 21-26 away (-54 run differential).
I know there is some debate how much home field advantage a team has but I’m pretty sure doing that much worse at home than the road is not normal. Looks like they have scored 180 runs at home and given up 264; on the road they have scored 189 and given up 245.
Interesting point, Tampa Bay also has been better on the road than at home.
I noticed that as well but they are close enough that I wasn’t sure if it was noise. Nobody had to move to make the new stadium work, for example, but OTOH the Yankees players might have more experience there than the Rays players do.
Plenty of flaws in our objective reality.
Well hopefully Manaea and Senga are really back next week because the Mets now have only three healthy starters. The Mets have a lot of needs to be filled at the deadline but I think they’re good enough to at least be the top wild card team.
I love this article. It takes a stand and is testable. (Dan is so good that I would continue to be a member of Fangraphs if he were the only person left on the site.) And each year, I select a handful of teams that I calculate to end the season with more or fewer wins than predicted by the ZiPS model. Except NYM and ARI in 2024, I’ve won those “bets.”
This year, my model does not vary significantly with ZiPS for a single team. This is unfortunate because it is fun to compare models with an easily identifiable metric.
The only “bet” I will take for 2025 is that the Rockies will finish with fewer than 49 wins. (46 wins.)
I’d take under on CLE 81 and over SF 82 also – Cleveland is far enough out that they are likely to sell off some rental pieces near the deadline, and SF is in the thick of a very close wild-card chase that they may add another piece or two (and even adding none I would expect them to win 84-85).
Tigers always underrated. The best farm system by far
I said in the preseason ZiPs that I didn’t understand why everyone was so down on the Tigers. Now if only I had actually put some money on it lol
I gotta say, 45 wins as a 20th percentile projection for the Rockies seems high
“Broadly mediocre” for the Cardinals is a strange way of saying broadly average or better. Maybe that won’t be enough to make the playoffs, but the only truly mediocre player they have among their starters (both position players and pitchers) is Miles Mikolas, assuming Walker no longer counts as a starter.
You could argue the entire team minus Winn, Gray, and Helsley is playing mediocre or worse.
A Rockies fan must be over the moon with this. Zips thinks they will win 9 more games and lose 25 fewer games over the next 73 games than they have over the last 89.
Hey, if there’s anything one can say about me, it’s that I’ve always optimistic about the Rockies!