
Triple-Slash Line Conundrum: Voros McCracken Edition

Every few years, the same old question sets the internet aflame: Why do Americans care so much about the British royal family Does batting average matter? If you haven’t seen my favorite formulation of the problem, here’s Tom Tango’s version of it:
Which is the more productive batter (all other things equal)
A.
.315 batting average
.365 OBP
.510 SLGB.
.260 batting average
.365 OBP
.510 SLG— Tangotiger ? (@tangotiger) January 9, 2023
I’ve taken a crack at this exact question before. The answer simply isn’t very surprising. If two hitters have the same on-base percentage and the same slugging percentage, they’re similarly valuable to their team’s offense. That’s why OPS is a popular offensive statistic despite its relative lack of precision; it does a lot of the same work as wOBA and wRC+ because its two component stats are mostly found in similar ratios and correlate well to offensive production. Linear weights are still better, because they do a better job of accounting for how important each plate appearance outcome is when it comes to run scoring, but you can get most of the way there with OBP and SLG.
There’s not much reason to go through the exact math of how wOBA works again, because the people who would be swayed by that math have already been swayed. But sabermetric forefather Voros McCracken mentioned a novel way of looking at the problem, and I thought I’d take a crack at it now that there are no more Carlos Correa free agency articles left to write.
His idea is simple: run linear regressions on team-level AVG, OBP, and SLG and use them to predict run scoring. That’s what we’re all after at the end of the day: runs. Linear regressions are a neat way of approaching this, as I hope you’ll agree when you see the evidence.
First, the data. I took team-level batting statistics and runs scored numbers from the 2010-19 and 2021-22 seasons, excluding 2020 due to its short length. That gave me 360 observations to test. From there, I started regressing. No, I don’t mean I got worse at writing, though I guess you’re the judge of that. I mean that I started to run single- and multi-variable regressions to take a look at the data.
Take batting average, for example. Batting average has a 0.355 r-squared with runs scored. In other words, 35.5% of the variation in runs scored can be explained by batting average. Hey, not bad! That’s a third of the variation. Here’s a graph of predicted runs scored (based on batting average) on the x-axis and actual runs scored on the y-axis:
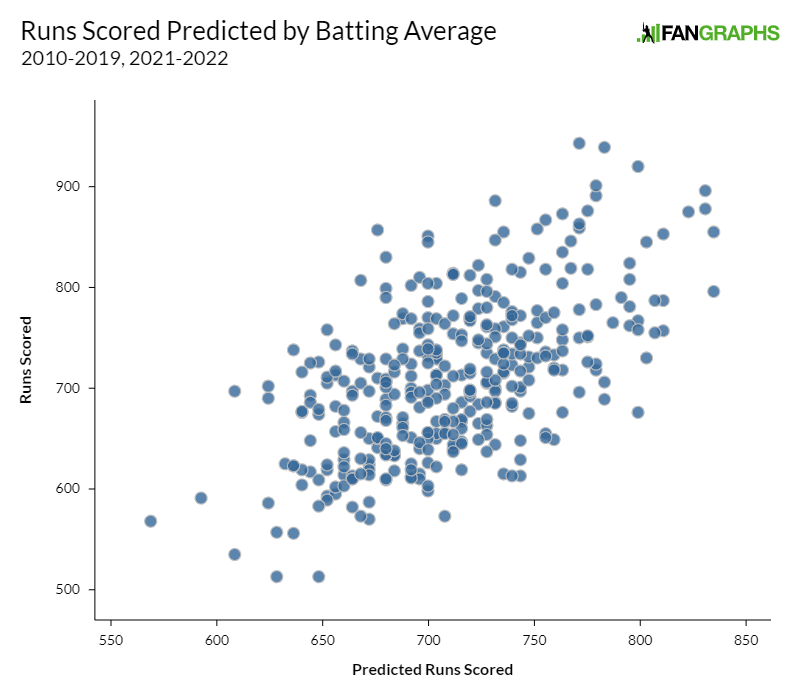
Of course batting average is correlated to run scoring. Aaron Judge batted .311 last year. Austin Hedges batted .163. If your options were no statistics at all or batting average, you’d take batting average every time. But we do have other statistics. On-base percentage, for example, has a 0.668 r-squared with runs scored. That graph looks much nicer:
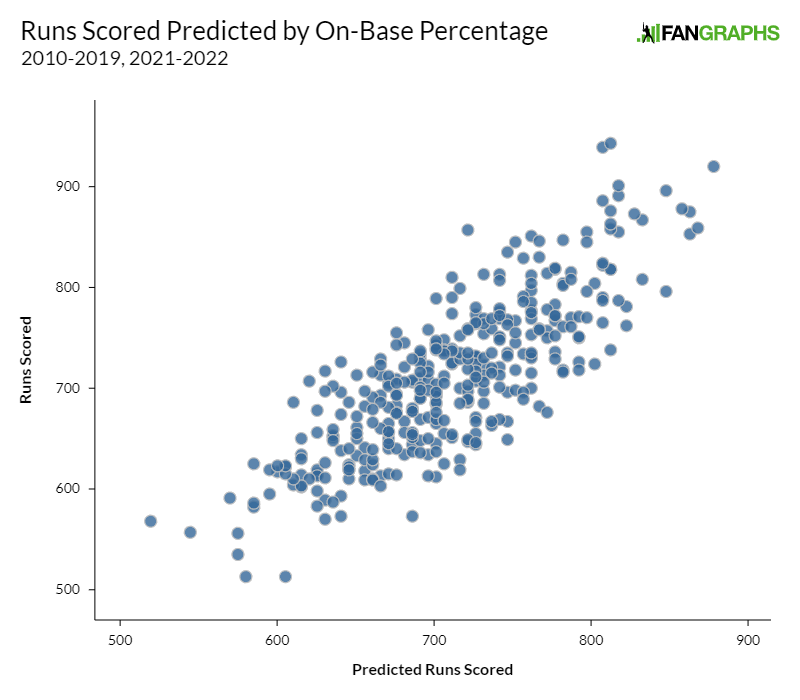
Slugging percentage checks in with a massive 0.84 r-squared, though I’ll spare you the graph on that one. These one-variable regressions make one thing very clear: if you had to judge a player based on only one slash line statistic, average would be at the back of the line.
Being at the back of the line isn’t the same as being useless, so it’s time to press on. If you think regressing against one variable is neat, wait until you hear about multivariate regression. That works basically how you’d expect it to: instead of using one variable to predict runs scored, we can use multiple. For example, if you wanted to predict runs scored using batting average and on-base percentage, you could just chuck those columns into a formula and get what’s called an adjusted r-squared, the percentage of variation in runs scored that can be explained by the combination of average and OBP together. That works out to 0.673 for that combination. If you’ll remember from above, that’s about the same as the correlation between OBP and runs scored. In handy grid form, here’s the r-squared (adjusted for two-variable regressions, raw for single regressions) for each combination of AVG, OBP, and SLG. When a statistic is crossed with itself, that’s simply the single-variable regression:
| Statistic | AVG | OBP | SLG |
|---|---|---|---|
| AVG | .355 | .673 | .841 |
| OBP | .673 | .668 | .885 |
| SLG | .841 | .885 | .840 |
In plain English, if you wanted to predict runs scored with two of the three slash line statistics, you’d choose OBP and SLG. They explain the highest percentage of runs scored. They aren’t perfect, for obvious reasons – they’re summary statistics that ignore sequencing and individual results, they ignore baserunning, and they’re context-neutral – but they still explain nearly 90% of run scoring.
If that’s all I had to show you, I probably wouldn’t have written this article. But there’s a fun little trick I’ve picked up over the years that you can do here. When I created each regression, I also created a prediction for each team-season’s runs scored based on that team’s raw statistics. I also, of course, have their actual runs scored. That means that I have a residual for every data point; in other words, I have the amount that my prediction missed by.
If you’ll remember the top of the article, the question we’re asking is simple: If two hitters have the same on-base percentage and slugging percentage, does it matter if they have different batting averages? The residuals are a great way of explaining that. If batting average is telling us something useful that we can’t get from OBP and SLG alone – in other words, if a .315/.365/.510 line is better or worse than a .260/.365/.510 line when it comes to helping the average team score runs – we should see a correlation between the residual of an OBP/SLG prediction and batting average.
I’ll spare you some suspense – there’s basically no correlation between OBP/SLG residuals and batting average. In other words, OBP and SLG aren’t perfect at predicting runs scored, but their errors can’t be explained by batting average. To stick to the r-squared descriptions I’ve been using throughout the article, only 4.3% of the variation in OBP/SLG residual can be explained by batting average.
For comparison’s sake, I ran the same calculation for each statistic. I took the residual of each two-statistic prediction of runs scored and then saw how correlated those residuals were to the remaining statistic. If you’ll recall from up above, batting average checked in at 4.3%. On-base percentage checks in at more than double, 9.8%. Slugging percentage is even better, at 31.6%.
Hey, you might say. Batting average is half as good as on-base percentage. What’s with all the slander? Bad news, if that was your initial thought: I’ve been holding out on you this entire article. See, I’ve been quoting r-squared as my preferred measure, but r-squared is directionless. It only measures what percentage of variation can be explained by a given variable, not which direction that variation works in. As an example, the r-squared between projected wins and the chances of making the playoffs is high, but so is the r-squared between projected wins and the chances of having the number one pick in the draft. They simply work in opposite directions.
As it turns out, after you predict a team’s runs scored using their OBP and SLG, higher batting average means lower runs scored. If that’s confusing, I’ll try to show it in graphical form. A positive residual means that OBP and SLG under-predicted a team’s actual runs scored. Thus, if higher batting average means more runs scored holding all else equal, you’d expect to see a line from the bottom left to the upper right on the below graph. Instead, as you can see from the superimposed fit line, the opposite is true:
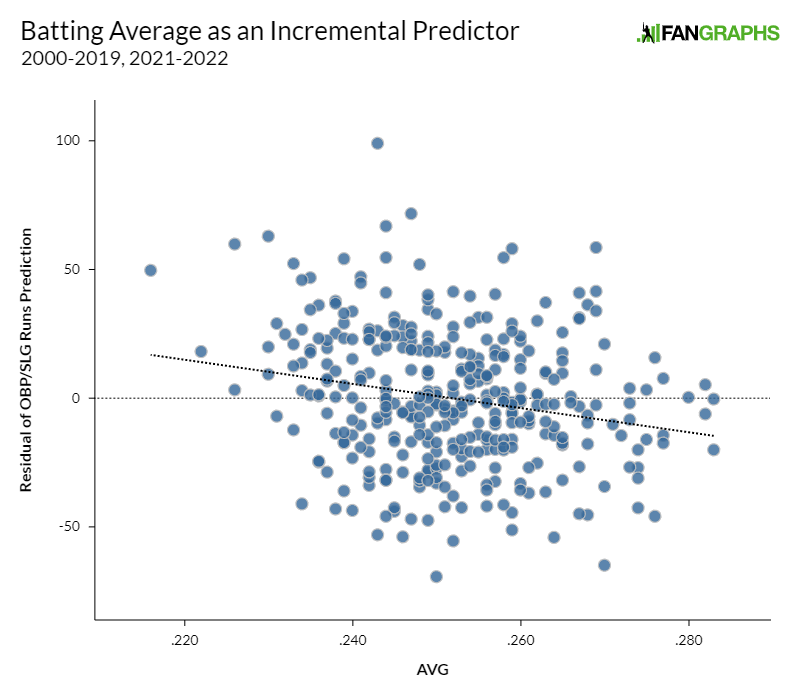
In other words, if you were making a prediction of how many runs a team would score and had only their OBP and SLG handy, you’d do fairly well. But if I whispered that team’s batting average in your ear, you could improve your prediction very slightly. The higher the number I whispered in your ear, the lower you’d revise your estimate. It wouldn’t be by much – there’s almost no useful predictive power in batting average – but to the extent that you moved your estimate, it’d be in an unintuitive direction. If you know a team’s OBP and SLG, batting average gives you very little additional predictive power, essentially noise in a weird direction.
That’s very likely an artifact of my dataset, but think of it this way: in terms of the magnitude of the effect we’re looking for, batting average is swamped by the other two statistics. I ran a multivariate regression with all three slash line statistics to illustrate this. For every 10 point increase in OBP, a regression predicts 28 more runs scored in a full season. For every 10 point increase in slugging percentage, it predicts 20 more runs. For every 10 point increase in batting average, it predicts 12.5 fewer runs, with much larger error bars than the other two. The combined adjusted r-squared of the three-variable regression is 89.8%, basically indistinguishable from the 88.5% you get from OBP and SLG.
This is a lot of words about a topic that’s already been settled, but I think it’s worthwhile to belabor the point. The modern view that OBP and SLG are more important than batting average for scoring runs isn’t opinion or preference. It’s borne out by the way that real teams score real runs in real games. Batting average is better than nothing, but it’s meaningfully worse than the other statistics we have available, and adds no useful information if you already know OBP and SLG. Unless you’re playing fantasy baseball, you can safely skip over average when you’re looking at how valuable a player was offensively. Don’t take my word for it – that’s just what happens when they play the games.
Ben is a writer at FanGraphs. He can be found on Bluesky @benclemens.
ISO has entered the chat
Need a similar stat for OBP minus AVG.
For most players the difference between AVG and OBP is walks.
For qualified batters in 2022, BB% and OBP-AVG has a 0.95 correlation, so I’d say if you need that, just look at BB%
If you’re Mark Canha or Brandon Nimmo, hit-by-pitch is also a significant component of OBP.
That exists and is used, but as rosen notes, it’s basically just walk rate these days. Nobody’s sac bunting anymore, and sac flies are generally rare. Only 3 guys reached 10 SF last season and only 10 hitters even got to 8.
I think it is somewhat intuitive that BA being lower is actually better for runs scored, the other slash stats held equal (I answered B in the Tango poll) – you are effectively trading singles for some walks and XBHs, which could produce a few more runs depending on the context. IT seems the league has trended in this direction more lately, accepting BA as less important, and the resulting rise in TTOs.
Would using ISO instead of SLG, in combination with OBP, be much different than the 88-89% correlation?
Probably the issue is its correlation with OBP. Remember that BA is required to calculate OBP. But it is also true that SLG is drawing on the same sorts of things as both of them, so ISO might help.
If you really wanted to, you could disaggregate offensive performance much more precisely than BA, OBP, and SLG. The argument I’ve often seen is that “walks are not as good as hits” which could very well be true. So you could separate the numbers into (1) Batting Average, (2) Walks + HBP, and (3) ISO. There’s a lot less overlap there, so if you really wanted to you could do something like that.
All that said, I think the main point Ben is showing still holds. Singles and walks “count” for the same amount in OBP. While one may be more important than the other, this mini-study shows that it is way more important that you get on base than how you do it.
FWIW– assuming the two batters both got about 600 PA, I get something like:
A: +47 singles
B: +7 HR, +40BB
I’m pretty sure I’d take B as well 🙂
B is more productive, but as a fan I would rather watch A.
but if the stats werent displayed you wouldnt even notice, because its a single every 3.5 games. so like….every 12 PAs you saw another single, and probably more meh BIP for outs.
whatever.
the issue is when this stuff is a macro trend and/or what it portends for the future of offense. it really doesnt matter aesthetically for a given player imo
over 600 PA it comes out to about a .001 woba increase for B.
In other words: Batting average is so heavily correlated with a clearly better and more informative predictor (OBP) that it actually goes the opposite way than expected. This kind of multicollinearity makes regression interpretation super-weird; OBP is capturing the relevant variation that we care about with batting average in a much more comprehensive way, so batting average is only useful insofar as we find “empty batting average” types.
Indeed, batting average is likely negatively correlated (after OBP and SLG are accounted for) for the same reason that high batting average won Tom Tango’s poll (and would even more easily win a poll of casual fans.) There’s a bias in favor of AVG, and that should expect all things equal high AVG same OPS players to have other flaws that teams are overlooking because of their AVG. Conversely, players like player B above who are on teams despite low AVGs probably have some other compensating factors that are more correlated with the OPS residuals.
This theory appeals but what are the flaws that OPS is not picking up? Baserunning?
The flaw of ops is that as we see each component is not equally valuable but ops treats them as equal components.
.400 obp .400 slg and .350 obp .450 slg are different from run production outcomes but identical in ops.
The answer is the equal slugging. If you have the same slugging with lower average you have more extra base hits and those are much more likely to produce a run. 2 singles or a single and walk are almost never a run but a single and a double or walk and a double often produce a run.
Walks are worse than singles yes but doubles are so much better than singles, having more of your slugging singles is net negative for runs.
That darn ceteris paribus thing again!
Thank you for making that make sense to me
I think the Higher BA “logic”, (Which is wrong) is due to runners on base when the event happens. That was my initial thought, at least.
Runner on 1st, a single could get them to 3B, a BB just gets them to 2nd.
Runner on 1st & 3rd, a single scores a run, a BB just loads the bases
Runner on 2nd, a single scores a run, a BB makes it 1st & 2nd.
What I didn’t think of is we’re normalizing the OBP & SLG so they’re equal, so while the lower BA has the less hits, they have MORE extra base hits, which have an outsized importance in scoring runs..esp HR’s, of course.
Basically, the difference in 2B/3B/HR >1B is more than 1B > BB.
It’s counterintuitive until you think it through a little bit.
I don’t comment often, but when I do, its to tell Ben Clemens he did a stellar job with this article.
I am on the same exact wavelength as Anthony. Few comments, except to complement Mr. Clemens.
Even though average was negatively correlated with the residual, is the correct answer to the poll “Too Close to Call” or is it “Barely B”?
Too close to call, in my opinion
In part, because value is a problematic, context-dependent term. We need more info here on what we are deciding has value including fantasy vs. reality (especially whether in an OBP league or not), context, etc. While it’s intuitive to say the guy who hits more singles is moving base runners further along he’s also likely hitting into more double plays. If we bat these two players the following way A before B as 1 2 in the line-up than A is slightly more valuable because of lower double play risk in the first at bat. But if we bat them B before A, the double play risk goes up and then B is clearly more valuable. As always, team construction means any individual player’s skills will have more or less value depending on the individual skills of the players around them. How much research has there been around line-up optimization?
I’ve sometimes wondered if batting average would even be viewed as meaningful if it hadn’t preceded on base percentage and slugging percentage in public use. Does batting average still hold some sway because that’s what we grew up with? Or is batting average somehow easier to grasp and instinctively viewed as meaningful?
I think it mattered more in the 1870-1885 era when it was closer to OBP and SLG for more players. BB% was 2%-3%. SH and SF reduced the difference between OBP-AVG and BB% a bit. ISO was around .080. Sluggers like Anson, and later Cobb and Speaker were rare. People had to calculate using long division by hand probably well into the 20th century. It was easier to just do AVG and not that much worse.
I still find it meaningfully descriptive in a slash line. Maybe it’s not adding much information on how valuable a player is, but it’s still adding information on how that value is generated.
I’ve long felt that a few stats just need a rebranding to become more popular for the casual or old school fan. “Change On Base Percentage” to “Out Percentage” and it becomes a lot easier for the casual fan to understand why it’s more important than just measuring hits
Broadcasts need to adapt and show OBP whenever they would previously show AVG. (In cases where only one of the two are shown.) If you keep showing a bad (worse) stat then yeah, casual fans are going to keep thinking it’s important.
The correlation with SLG explains why sluggers get paid more than high OBP guys Moneyball or no. 20 years ago I’d expect some stat head to respond with “Many people don’t realize that Moneyball isn’t about OBP. It’s about finding undervalued players.” Thank goodness no one does that anymore
This means a walk isn’t as good as a hit, it’s better 😉
(Yes, oversimplification and doesn’t take into account slugging, but I thought it was funny).
My interpretation is that it means because BA is a component of OBP and SLG, once you have those two stats adding BA into mix only identifies players with an empty BA (high avg, low SLG and OBP) and those guys don’t do much to produce runs. I don’t think this informs us on the argument of whether a walk or a hit is better.
Its not quite that but that we’ve kept the slugging the same and each type of hit does not scale linearly in terms of run production.
If you look at a run expectancy chart, you can see that in most situations, a 2 base hit increases the odds of scoring a run by more than double that of a one-base hit. This is because you just need to sequence less events (each of which is individually improbable, because outs are the most common outcome) to get to a run. The only times they are roughly equal are in situations where there are 2 outs and runners in scoring position already, so whether the man ends on 1st or 2nd is relatively low impact in terms of scoring again that inning.
Since we have kept the slugging the same, our player with the lower average is getting the same total bases on less hits – therefore, a higher proportion of their hits are not_singles, and these are disproportionately more valuable for scoring runs.
Singles *are* worth more than walks, by a fairly marginal amount, but doubles are worth *so much more* than singles that a statline that has more of them is going to be more valuable in terms of actual run scoring output.
The thing is that it isn’t “a walk or a hit” it is ‘what kind of hits are you getting’. The player with lower batting average is, essentially, achieving the same ‘batting line’ outcome but by favoring more reliable events – they use a lower quantity of more valuable hits to get the same slugging, meaning each individual hit is more likely to actually produce a run. They maintain the same OBP, so they have a higher walkrate, which is a more stable method of reaching base; the individual walks are less offensively valuable than the singles, but the walks provide a more stable baseline (being less volatile than day-to-day BABIP), and their percentage of high quality hits is higher.
Player 2 has the best of both worlds: their production favors events that are more reliable and less prone to variance, so they have greater stability, *and* a higher proportion of those events are extremely valuable extra base hits which make scoring a run *likely* in any given inning where they happen, so they are less likely to have their own contributions get ‘left on the vine’ in the form of LOB and more likely to produce an actual run.
We see how obvious this is with home runs (since they score the batter), but doubles and triples also make individual inning run-scoring odds very high whenever they don’t occur with 2 outs, whereas you need multiple walks or singles to get to the same state. Since all positive offensive outcomes in baseball are individually improbable (since even the best players make outs 60% of the time), an event that only requires you to sequence 2 positive events together (single/walk + double, or double + any hit) instead of 3 (walk/single, walk/single, single) will result in runs much more frequently.
Probably too late for my comment to be seen and addressed but I would raise a couple points: 1) there is likely somewhat of a negative correlation between obp and avg no one is going to get to a .400 obp without a massive number of walks so and its hard to bat .300 if you don’t swing frequently enough. 2) if you consider place in the batting order there might be a (stronger/positive) correlation between average and run scoring. This second idea is at least partially behind the theory of modern lineup construction.
My point is that yes obp is more predictive than avg in a vacuum but there are likely a couple confounding variables at play. Walks are better than contact if the bases are empty because walking precludes the possibility of making a field out but with a man on 3rd any single walk is less useful than contact that can advance the runner.
The vast majority of .400 obp seasons came with .300+ avg
I think it’s fun when a player is such a TTO monster that this doesn’t hold. This happened a fair amount about 50 some years ago; Willie McCovey and Jimmy Wynn in 1969, as well as Willie McCovey in 1970.
It’s especially fun, though, when we get into the 80s and later because by that time you don’t get nearly as many cases. Jack Clark in 1987 is one of my favorite examples, because he ran an absurd 24% walk rate for a .286/.459/.597 slash line. Jim Thome in 1999 is similar, with a .277/.426/.540 slash (Jim Thome actually had an OBP more than .400 and a BA less than .300 several times). Or 2017 Aaron Judge, with his .284/.422/.627 slash line.
Here’s a fun example that doesn’t fit the TTO narrative though. Gary Sheffield in 1997 hit 21 homers and batted .250 but got on base at a .424 clip. Another way of looking at it: He hit 21 homers and only had about a 20 point gap between his OBP and his SLG.
1993 Rickey Henderson is also a fun example. The dude ran a .289 batting average but a .432 OBP. He walked nearly 20% of the time! Nobody in their right mind is interested in walking Rickey Henderson! Why would they do that if they could help it? (I think Bill James had a comment about this as well).
Juan Soto 2022 .242/.401/.452
Grandal hit .240/.420/.520 in 2021. Early in the season at one point he was at .154/.400/.433
On your last point, who is responsible for BB’s IS one of the big changes in how sabrmetrics changed how we view things.
Until at least the 1970’s, maybe later BB’s were considered solely a function of the pitcher, I.E., he’s wild or he’s “pitching around Player X”.
Obviously, this is incorrect.We all know now that the hitter has a large role in that.
That is one of the things James was at the forefront on..that & “The player’s goal is not to get a hit..or a walk or whatever, the goal is to score runs & we need to focus on what leads to that”
“there is likely somewhat of a negative correlation between obp and avg no one is going to get to a .400 obp without a massive number of walks so and its hard to bat .300 if you don’t swing frequently enough”
For 2022 qualified batters it is .743, so there IS a pretty strong correlation. As a counterpoint to your reasoning, if a player isn’t pretty good at hitting to some degree, are pitchers going to pitch around them enough that they can draw a lot of walks?
A few observations regarding this argument. One is small sample sizes, a second is situation. Take a regular season/playoff series for example. Batter A, in this scenario, has a higher probability of making non-out contact that can potentially score a run in specific scenarios (i.e. man on third, 2 outs) than does Batter B. However, in large sample sizes, Batter B will has a higher likelihood of producing more runs (as succinctly explained by Ben in this article).
You can make an argument for Batter A or Batter B depending on the scenario(s) presented. 162-game season vs playoffs. Middle-of-the-order vs. leadoff.
The actual answer is “it depends”. It’s a trick question because there really is no right answer. It all depends on the scenario being discussed. Kudos to Tom for his tongue-in-cheek question.
First off, I want to say what a good article this was. I love this kind of thought experiment, it always good to look at things in a different way.
That being said, I would like to piggy back on what most others have touched on, which is that BA is already kind of wrapped up in both OBP and SLG. If you look at the correlations between teams’ BA/OBP and BA/SLG over the years you indicated, the correlation between BA and OBP is .777 and between BA and SLG is .610. Even the correlation between SLG and OBP is .758.
I did a quick principal component analysis on the set you used (2010-2022, excluding 2020), and when only using the first component (adj r^2 = 0.76), batting average and on-base actually have the heaviest weight, with a 10 point increase in either accounting for roughly 21 runs, with slugging accounting for only about nine runs per 10 points. Adding in the second component returns batting average to a negative component (-6 runs per 10 points), with on-base worth about 20 runs per 10 points, and slugging now leading at about 21 runs per 10 points (adj r^2 = 0.90).
The TL;DR version: this kind of analysis is tricky, since the three slash line stats are so tied up in each other. I’m no fan of batting average, but I think the advanced statistics community has perhaps discounted it a little too much at this point. If nothing else, batting average is an imperfect measure of the ability to make contact.
FWIW, Adrian Beltre circa 2013 is roughly player A, and Carlos Santana circa 2016 is roughly player B. Their wRC+ scores were 135 and 130, respectively. It’s definitely close, but to say that the guy with the higher batting average is categorically worse is not a reasonable argument.
Unsatisfied with cherry picking two player-seasons from the given era, I went back, found the ten player-seasons with at least 500 PA that most closely met the criteria for each player and took their cumulative stats. For posterity those player seasons are:
Player A: Beltre 2013, Pence 2011, Pollock 2015, Segura 2016, Y. Molina 2012, B. Butler 2012, C. Seager 2016, Morneau 2014, Brantley 2019, D. Peralta 2015
Player B: C. Santana 2016, Willingham 2012, Harper 2019, Will Smith 2021, Y. Alonso 2017, Conforto 2019, J. Bautista 2013, Papi 2014, Carpenter 2018, E5 2017
Player A group combined slash: .314/.369/.505, with a .374 wOBA
Player B group combined slash: .260/.366/.507, with a .369 wOBA
The best part is the wRC for each group, both within 0.1 runs of 97 per 600 PA.
Both groups were slightly above the requirement for OBP and slightly below the requirement for SLG.
Some highlights of the differences:
This analysis probably shows that batting average is relatively meaningless at this production level. A .365 on-base and a .510 slugging are pretty good, it would be interesting to see if it matters for a more average-ish type player.
I feel like this just shows that BA is already included in the other two stats and ISO is the driving stat. Maybe a better slash line would be:
BA/OBA-BA/ISO. This would break the player down by three independent components:
1) how well his non-walk/hbp PA turn into hits
2) how well he can walk/hbp
3) how good he is at getting extra bases when he gets a hit.
The slash-lines in question would show this as:
A. .315/.050/.195 add these together and you get .560
vs
B..260/.105/.250 added together gets you .610.
Probably a better way would to put all of these with a denominator of PA and create a new slash line that would show three completely distinct values that could actually be mathematically added together:
This way you could really add them up and get a legit value (although none of the components are currently used on the back of a baseball card.)
Yes! This is the right approach. The commonplace idea (let’s say, the implicit meaning in the sportscasters’ heads when they’re calling a game on TV) of what BA, OBP, and SLG mean is that they’re basically the one about contact hitting, the one about walking, and the one about power. The problem is that they don’t really quantify those things all that well compared to H/PA, (BB+HBP)/PA, TB/PA, and only exist the way they do for historical reasons.
So much of “analytics” is really about giving people a better set of baseball-card numbers to work from, and we ought to be giving them the option of numbers that they already know they want, like this. (Linear weights are great, but I can’t count the number of on-air complaints I’ve heard about wanting baseball-card numbers just because a sports guy can compute them with a pencil and paper!)
If their OBP% is the same and their SLG% is the same, which is a pretty rare and specific example, it makes sense. But what about when their OPS is the same but the other 2 are quite different. Like say Varsho and someone else with a .740 OPS that bats .300? This is a bad example as Moreno has a small sample size but lets use Varsho vs Moreno as an example. Is OPS as important as we are lead to believe?
I think the problem there is that OPS was pushed as important decades ago and it was back when access to stats was archaic compared to now, so having something where it is simply, “add these two common things together” was pretty powerful.
Now we have better tools that are available from numerous sources and updated daily (or even as events are occurring on some sites), so I think if you still feel like OPS is being pushed as an end-all-be-all that the issue is more with the source of those pushes than OPS itself.
Regardless of what the stats say, a hit is always more entertaining than a walk.
that’s an entirely separate point. The stats don’t say walks are more entertaining than hits
I understand that. But everything else being equal (which the stats say they are), hits are more fun.
If we are rating things based on “fun factors”, then I think a triple should be at least as valuable as a home run.
A steal of home should count as like 10x of a steal of second.
On the other side of the ball, an insane diving play to snag a ball deep in the hole should count as more than other fielding plays or strikeouts.
sure, but are 10 singles more fun than 6 extra base hits?
For the record, stats (along with logic and common sense) also say a hit is more valuable than a walk.
I would like all television and radio broadcasters to 1) develop an understanding of why A and B are virtually equal and 2) stop talking about batting average in small samples (over the last 7 games he’s hitting .457!)
Tango: “I wrote my series exposing this issue 20 years ago”
So let’s put this in a hypothetical: player A and player B are in a single at bat. They both get on base and slug at the same clip. That’s cool.
I’m assuming player B makes up for his avg deficiency by walking more? I’m also assuming he doesn’t make as good contact because his avg is worse (what’s his BABIP?)
I think it would be better to have the better contact hitter so if there were runners on base, I’d much rather have a base hit than a walk.
Anyone care to rebut?
there’s no predictive value in putting them in a single PA
That’s not the choice though. Player A may get a hit roughly 28.5% of the time he comes to the plate compared to player B’s 21.9%, but only hits a homer roughly every 28 PA, as opposed to player B who hits one 50% more often, more than once every 19 PA. These numbers are coming from the cumulative rates from my previous comment.
Here’s the percentages of the outcomes for Player A v. Player B:
Player A: 18.9% singles, 5.5% doubles, 0.6% triples, 3.5% home runs, 7.5% walks, 14.5% strikeouts, 0.9% HBP
Player B: 11.9% singles, 4.6% doubles, 0.1% triples, 5.3% home runs, 13.6% walks, 20.5% strikeouts, 1.1% HBP
This is literally the entire point of stats like wOBA, let alone this post. You can’t simply say you’d rather have a base hit than a walk, since that’s not the question being posed. To arrive at different batting averages with the same OBP and SLG, you have tradeoffs. Yes, player A is more likely to get a hit, but it’s much more likely to be a single rather than a home run.
Also, fwiw, the player A group has a BABIP of .340 compared to .279 for the player B group. This is likely due to the player A group being more line drive hitters, where player B group is more fly ball hitters.
I’ve been big into sabermetrics and deep info on baseball for 10-12 years now, but simply can’t fathom how this is true. It simply doesn’t make sense. If your OBP and SLG are identical but one of you hits the ball more, surely he’s doing more to create more offense? How is it possible he isn’t?
Sorry for incoming tired anecdote, but walking when the tying run is on 3rd base is a lot worse than slapping a single. I just need someone to explain it to me like I’m 5.
Because the gap in BA and SLG for player B implies that his hits are more impactful.
In this situation – yes! You’d rather have player A. But there are situations where you’d absolutely prefer player B.
Up above, Rosen380 did some rough math and concluded that to keep all else equal we’re looking at:
A: +47 singles
B: +7 HR, +40BB
Now consider the situation down 1, bottom 9, 2 out, nobody on.
You want B and it isn’t even close!
First of all, tying run on third is a very specific scenario. You know what’s better than a single in that case? A home run, by a lot. If you look at how much a single is worth in the wOBA equation, it’s 0.89 as compared to a walk which is 0.69, which after the factor to convert wOBA to runs means a single is worth roughly 0.155 extra runs on average in 2022.
In 2022, 6.86% of pitches were thrown with a runner on third (bases not loaded), 16.42% with runners on second (not loaded), and 2.18% with the bases loaded. Let’s assume the runner on third scores on a single when he’s there, and ignore the times when the bases are loaded since that runner scores with a walk as well. That’s 0.069 extra runs from a single over a walk. If the runner from second scores 50% of the time on a single, that’s another 0.1642*0.5 + 0.0218*0.5 = 0.093 extra runs from a single over a walk. That’s a total of 0.069 + 0.093 = 0.162 runs, nearly identical to the 0.155 extra runs in the wOBA equation.
That explanation is not for a five year old, but the basic gist is that wOBA does take into account the situation from a general aspect, which is why it’s superior to the basic triple slash stats.
I think the quality of the hitters in your line up around a hitter explains some of that unexplained by OB% and SLG%. Nearly everyone hits better with a runner in scoring position over a career. Get more of those chances the better your stats will be.
It’s articles like these that explain why this site gets about 28 comments on average per article and begs every viewer for money to offset it’s lack of clicks.😴😴
Can’t believe someone wrote a detailed article about baseball statistics on FanGraphs of all places. Intolerable if you ask me
The better predictor is 1.t(OBP) + SLG where t is between 0+ and 99. The accepted 1.8x OBP is good, though in some recent high-HR years, 1.4x OBP + SLG has best explained team scoring. The differences are slight once you accept a point in OBP is between same value and double value of a point of SLG.
For any pair of hitters with the same OBP and SP, the most important factor in who was more valuable is in ‘how’ they made their outs. In order of hurting less, types of outs rank: DPs, Ks, other outs, SF. (Ignoring the obvious SB/CS.)
I did this analysis several years ago, but I am confident that any recent calculation of linear weights, these two conclusions will be supported.
If someone has identical SLG but lower BA, doesn’t that mean they had to hit more XBH to make up for it?