
When War Comes Easier Than Wins
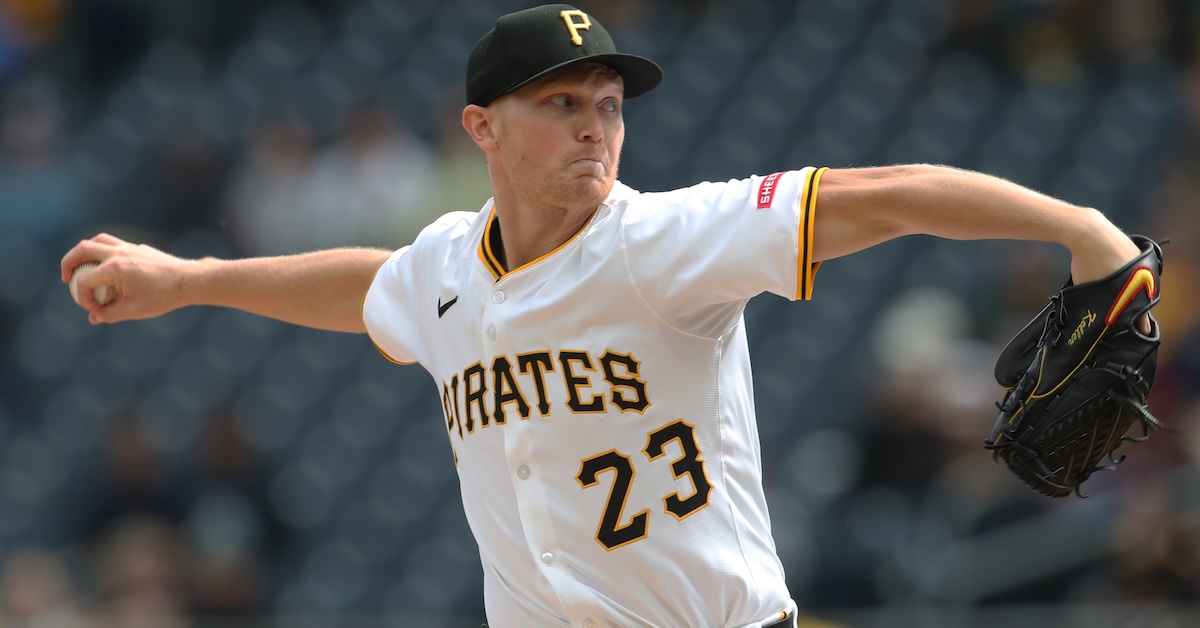
The Pirates beat the Phillies 2-1 on Sunday, and near as I can tell everyone was pissed about it. The Phillies, a would-be World Series contender, had just gotten swept by a team they’d been hoping to do some damage against, and dropped to 1-9 in their previous 10 games. The Pirates, for their part, had just gotten one over (three over, actually) on their intrastate rival, but Paul Skenes didn’t get the win.
The biggest, scariest pitcher in the league had gone 7 2/3 innings, allowing only one unearned run, but had left the game while it was tied in the top of the eighth. That left the NL Cy Young frontrunner with an ERA of 1.88 in 91 innings, but a record of just 4-6. Is it important for Skenes to get the win? Not exactly. But the incongruity between record and performance was just another reminder of how little support this disappointing team is giving the generational talent that had fallen into its lap.
Skenes is the class of the Pirates rotation, but he’s not the only talented pitcher the Bucs have. Even with Jared Jones and Johan Oviedo in the shop getting their elbows worked on, Mitch Keller is having a solid season. Keller is top 25 in the league in innings and WAR, and despite some indifferent strikeout numbers, he’s kept the ball in the yard and scratched out a 4.13 ERA — that’s a 100 ERA- on the dot — with a 3.27 FIP.
Skenes would be within his rights to feel aggrieved at having only four wins, but if you offered Keller that total of victories, he’d bite your hand off. The big Iowan is 1-8.
WAR and pitcher wins can sometimes get called by the same shorthand, but the former is much harder to earn than the latter. I actually don’t think it’s possible for a pitcher to earn a full win above replacement, by our site’s formula or any other, in a single nine-inning game.
Since 1901, there have been 9,018 individual rate-leaderboard-qualified seasons for starting pitchers (i.e. one inning pitched per team game). The average win total for a qualified pitcher over that time is 13; the average WAR is just 2.9. The single-season WAR record is 11.6, set by Pedro Martinez in 1999.
The number of 10-WAR pitcher seasons in major league history might surprise you; it surprised me. Over the past 125 seasons, there have only been either six or seven, depending on how you round the figure off. Actually, I think you’ll probably be able to guess most of the pitchers involved, if not the specific season.
| Season | Name | Team | G | GS | W | L | IP | ERA | FIP | WAR |
|---|---|---|---|---|---|---|---|---|---|---|
| 1999 | Pedro Martinez | BOS | 31 | 29 | 23 | 4 | 213 1/3 | 2.07 | 1.39 | 11.6 |
| 1972 | Steve Carlton | PHI | 41 | 41 | 27 | 10 | 346 1/3 | 1.97 | 2.01 | 11.1 |
| 1973 | Bert Blyleven | MIN | 40 | 40 | 20 | 17 | 325 | 2.52 | 2.32 | 10.8 |
| 1908 | Christy Mathewson | NYG | 56 | 44 | 37 | 11 | 390 2/3 | 1.43 | 1.29 | 10.8 |
| 1997 | Roger Clemens | TOR | 34 | 34 | 21 | 7 | 264 | 2.05 | 2.25 | 10.7 |
| 2001 | Randy Johnson | ARI | 35 | 34 | 21 | 6 | 249 2/3 | 2.49 | 2.13 | 10.4 |
| 1965 | Sandy Koufax* | LAD | 43 | 41 | 26 | 8 | 335 2/3 | 2.04 | 1.93 | 10.0 |
So yeah, that’s just a list of popular answers to the question, “Who’s the best pitcher of all time?” And Walter Johnson, Lefty Grove, Tom Seaver, Warren Spahn… none of those guys ever posted 10 WAR in a season.
By comparison, 7,006 out of 9,018 qualified pitchers in AL/NL history have won 10 games. There have been 812 20-win seasons, 126 25-win seasons, and 21 30-win seasons. The record for wins in a season is 41, set by Jack Chesbro of the New York Highlanders in 1904. That’s probably the most unbreakable major record in the book. (At least for a starting pitcher. Put me in charge of the Dodgers and give me permission to run Ben Casparius into the ground, and I bet we could make a run at 40-plus wins out of the pen.)
Since 1901, AL and NL qualified pitchers have produced about four and a half wins for every win above replacement. And while WAR can go negative, it’s very uncommon for a pitcher to throw enough to qualify for the ERA title while performing below replacement level. Only 88 times — or roughly once every 100 individual player seasons — has a qualified pitcher finished with negative WAR.
What does this have to do with Keller? Well, entering his start on Tuesday night, Keller has one win and 1.6 WAR. That is a massive, massive historical aberration. The number of qualified pitcher seasons with more WAR than wins is the same as the number of 10-WAR pitcher seasons (if you round Koufax up): seven.
And even that total is inflated by the fact that four of those pitcher seasons — Keller, Luis Severino, Dylan Cease, and Kyle Freeland — are taking place this year. By the time you read this, that number might’ve already come down. Keller and Cease pitch Tuesday night, Freeland on Wednesday. A win for any of them would bring their win total above their WAR, where it belongs.
Even this early in the season, having four qualified starters with a negative AR (what I’m calling WAR minus wins, because if you subtract a “W” from “WAR” you get “AR,” get it?) is unusual.
There were two qualified negative-AR starters at this point last year, none in 2023, and one in 2022. Over the past 10 162-game seasons, June 10 of each year brought just nine such pitchers, total. The modal number per season is one. We haven’t had four negative-AR pitchers on June 10 since 2010.
That means only three qualified pitchers have gone through the full 162 (actually, the full 154 in two cases) with more WAR than wins.
| Season | Name | Team | AR | G | GS | W | L | IP | ERA | FIP | WAR |
|---|---|---|---|---|---|---|---|---|---|---|---|
| 1916 | Jack Nabors | PHA | -0.351 | 40 | 30 | 1 | 20 | 212 2/3 | 3.47 | 3.12 | 1.4 |
| 1948 | Art Houtteman | DET | -0.733 | 43 | 20 | 2 | 16 | 164 1/3 | 4.66 | 3.71 | 2.7 |
| 1978 | Jerry Koosman | NYM | -0.225 | 38 | 32 | 3 | 15 | 235 1/3 | 3.75 | 3.34 | 3.2 |
It takes a special set of circumstances to pull something like that off. Nabors took the most obvious route by pitching for one of the worst teams in baseball history: the 1916 Philadelphia Athletics, who went 36-117-1.
The A’s had won three World Series in four years earlier that decade behind the $100,000 Infield and a rotation led by Hall of Famers Charles Bender and Eddie Plank. By 1916, Bender and Plank had jumped to the Federal League, and Connie Mack sold off Eddie Collins, Jack Barry, and Home Run Baker, the latter after a full-season contract holdout.
Collins went to the White Sox for $50,000, Baker to the Yankees for $37,500, and Barry to the Red Sox for $10,000. Which left only $2,500 worth of value in the Athletics infield, and it showed in the standings.
Nabors threw 212 2/3 innings — just over three-quarters of his career major league total — in 1916, and wasn’t very good. He walked more batters than he struck out, and posted an ERA- of 110. But he didn’t get much help. The A’s scored just 447 runs all year, the lowest in the AL by almost 100, and posted the worst fielding percentage in the majors.
Nabors won his third start of the season with a complete game against Boston on April 22, then went winless in his final 37 appearances of the year. And it’s not like he kept getting vultured; the A’s went 4-35-1 when Nabors pitched in 1916. The whole team just stunk.
The 1978 Mets were in a mighty post-contention, post-teardown hangover, much like the 1916 A’s. You’ll no doubt remember Koosman as the no. 2 starter behind Seaver on the Mets teams that won the World Series in 1969 and the NL pennant in 1973. In fact, Koosman was just as good as Seaver during both postseason runs; the Mets went 6-0 when he started.
But by 1978, the Miracle Mets had been disbanded. Tommie Agee had retired; Nolan Ryan had gone on to superstardom in California; Gil Hodges was long dead. Seaver himself had been traded to the Reds the season before, leaving the 35-year-old Koosman as one of two members of the championship team still kicking around in Queens.
Koosman had a pretty good season in 1978, but he got absolutely no help. He had to pitch all nine innings in two of his three wins, and come to think of it I shouldn’t say “all nine innings.” Koosman pitched more than nine innings on three occasions, and the Mets lost all three times. On August 21, Koosman struck out 13 batters in 10 innings and didn’t allow a run; the Mets lost in 11. Ten days later, he threw 11 innings, allowed three runs, and the Mets lost 4-3.
Koosman pitched eight or more innings on 10 occasions in 1978, and apart from those two complete-game victories, the Mets lost every single time. In none of those eight losses did they score more than three runs.
So we’ve got a bad pitcher on a world-historically bad team, and a good pitcher pitching pretty well and throwing a huge volume of innings on a normal last-place team. Keller in 2025 is basically Koosman in 1978, adjusted for inflation.
Then there’s Houtteman. The 1948 Tigers were also a team on the downswing. Detroit had won the World Series in 1945, and finished second in the AL in 1943, 1944, 1946, and 1947. But they went 78-76 in 1948. Hal Newhouser led the league in wins. Virgil Trucks, Dizzy Trout, and Stubby Overmire combined to go 27-31, which is only significant because I wanted to mention those three names. Not enough guys named Virgil, Dizzy, and Stubby in the league these days, if you ask me.
The all-time single-season and career WAR leader among players named Dizzy, by the way, is Trout, not Dizzy Dean. Though Mike Trout has Dizzy covered in both categories with room to spare.
Anyway, Art Houtteman was a local kid who had gotten into 13 games in relief for the 1945 championship team when he was only 17. (World War II, man. Many downstream effects.) By the time 1948 rolled around, Houtteman was in his age-20 season, and had evolved into the Tigers’, well, their Ben Casparius.
Detroit had one Hall of Fame starter (Newhouser), two Hall of Very Good starters (Trucks and Trout), and an OK no. 4 in Fred Hutchinson. Houtteman made 20 starts, mostly early in the year, including an 11-inning, one-run complete-game win on June 16. This came one outing and five days after he picked up the win by throwing 3 2/3 innings of scoreless relief against the Washington Senators.
Those were the only two games Houtteman won all year. Houtteman threw six or more innings on 13 occasions; the Tigers lost 11 of those games, and Houtteman himself was charged with nine of the 11 losses. And while Houtteman wasn’t terrible, he doesn’t have as strong a grievance against his teammates as Koosman.
The 20-year-old Houtteman went 1-14 in 20 starts, with a 5.01 ERA. The Tigers gave him at least three runs of support in 15 of those 20 starts — not stellar offensive production, but good enough to win more than one game.
After Houtteman lasted just five outs against the A’s on July 31, manager Steve O’Neill moved him to the bullpen. Houtteman made just two starts in the final two months of the season. And the Tigers needed the help; outside of their top four starters, they had seven pitchers (including Houtteman) throw at least 10 innings in 1948. Only one had a better-than-average ERA, and even then only by seven hundredths of a run.
Houtteman’s ERA as a reliever was more than a run lower than it was as a starter, and he managed to save 10 games in 23 relief appearances. But he finished with a 2-16 record, in a season in which he produced 2.7 WAR in just 164 1/3 innings.
What Houtteman has in common with Keller, Cease, Severino, and Freeman is that his FIP ended up nearly a run below his ERA. (Freeland, the biggest outlier, is currently rocking a 3.54 FIP and a 5.19 ERA.) An ERA-FIP misalignment obviously offers a path to a negative-AR season that’s unique to FIP-based WAR.
Three pitchers in 125 years isn’t a lot, but for comparison I took Stathead search for a spin and came up with two negative-AR pitchers this year (Severino and Yusei Kikuchi), and only one qualified pitcher with more WAR than wins: Eddie Smith of the 1937 A’s.
Pitching for a team that went 54-97-3, Smith threw 196 2/3 innings with an ERA of 3.94 and a FIP of 5.02. That’s 1.5 WAR, but 4.2 bWAR, which gets him over the bar with his record of 4-17.
What does this mean? Well, it’s a fun bit of trivia, mostly. But also: The Pirates need to start giving Keller some run support. Or not. If Keller ends the year with more WAR than wins, he’ll have done something far more special than anything Skenes could have ever dreamt of.
Michael is a writer at FanGraphs. Previously, he was a staff writer at The Ringer and D1Baseball, and his work has appeared at Grantland, Baseball Prospectus, The Atlantic, ESPN.com, and various ill-remembered Phillies blogs. Follow him on Twitter, if you must, @MichaelBaumann.
Re: “I actually don’t think it’s possible for a pitcher to earn a full win above replacement, by our site’s formula or any other, in a single nine-inning game.”
It actually is! It doesn’t appear to be possible by RA9-WAR, where 9 inning shutouts seem to have topped out at 0.8 WAR, but Kerry Wood achieved 1.0 WAR in his famous 20K game thanks to his -0.97 FIP (plus there was a pop fly in there, though I’m not sure whether that gets factored into WAR that far back). Presumably you could manage a bit more than 1.0 WAR even with some extra Ks or popouts.
It would be interesting to run the same filter against RA9-WAR or rWAR.
Nabor’s 1-20 season comes to -0.5 RA9-WAR and 0.5 rWAR.
Houtteman’s 2-16 season comes to 0.3 RA9-WAR and 0.5 rWAR.
Koosman’s 3-15 season comes to 1.6 RA9-WAR and 1.5 rWAR.
Keller’s currently at 1.0 RA9-WAR and 0.5 rWAR.
What is rWar?
Baseball-Reference WAR – Sean Smith’s old handle was “RallyMonkey” -> “RallyWAR” -> “rWAR”
rWAR is bbWAR (what Baseball Reference uses). The r is for Sean “rallymonkey” Smith who devised that stat.
This is way more fun that what I assumed- I just figured it was for “runWAR” since it’s based on actual runs
I always assumed it was for “reference”
deGrom went 10-9 in his 9 WAR season
First name I thought of while reading the article.
I also thought of Randy Johnson who had some stretches with really poor run support luck, but he never really came that close. His closest was probably going 16-14 on a REALLY bad DBacks team in 2004 when he had 9.6 WAR which obviously isn’t all that close.
I ran a search of all qualified seasons since 1969 and sorted by ERA – FIP – it makes sense that a guy who has really bad ERA luck would run a good WAR while struggling for wins. But it’s surprising the guys who still managed to win 7-10 games despite horrible ERA luck. Chris Bosio in 1987 had the worst E-F with a 5.24 ERA vs a 3.38 FIP and he still managed 11 wins (3.7 WAR). There really aren’t even all that many that are particularly close.
Soon as I read this comment I thought of the pre-Pirates career of my man Zane Smith. In 1989 he went 1-12 with 1.7 fWAR in 99 innings with the Braves, then got traded to the Expos and moved to the pen, where he went 0-1 in 48 innings for 0.4 more fWAR, totaling 2.2 (rounding!) in 174 innings with a 1-13 record. Just missed the innings qualification and wasn’t a starter all the year, but in the spirit.
This is an ERA thing as much as a run support thing; with the Braves he had a 4.45 ERA against a 3.31 FIP for a whopping -1.2 bbWAR, then with the Expos he had a 1.50 ERA against a 3.18 FIP for 1.6 bbWAR. The late 80s were a low-offense time.
In 1987 with the Astros, Nolan Ryan went 8-16 in a 6.4 fWAR / 5.7 RA-9 WAR season. He led the NL in both ERA and strikeouts.
There must have been a lot of bad SP W-L record luck in Ryan’s starts that year. The 1987 Astros were below average, but not terrible: 76-86 record with a -30 run differential (78-84 Pythag).
Mike Scott posted similar SP WAR to Ryan on the same team (5.4 fWAR / 6.0 RA-9 WAR) with an ERA ~0.5 runs higher, and Scott had a 16-13 record.
Ironically, Koosman won 20 games the next year for Minnesota. His ERA was only 0.37 runs lower (3.75 in 1978 & 3.37 in 1979) & his FIP in 1979 was actually higher!
Sounds like things evened out for him, at least a little bit.
When I saw him mentioned, I assumed this was referring to the year he lost 20 games. Nope, that was the year before.
Koosman went 11 straight years losing double digit games (1971-81), with a record of 132-146 and an ERA/FIP of 3.42/3.23 and 41.8 WAR. He had 2434 IP, 91 CG, 15 shutouts (and 12 saves) and 1694 K. As a preteen Mets fan in the early to mid 70’s, even I could see he was getting killed by lack of run support.
Yeah, from 1976 to 1979, Koosman:
Went 21-10
Went 8-20
Went 3-15
Went 20-13
1st 3 years for NYM, last year in Minnesota. His ERA was between 2.92 to 3.75 every year & his FIP was between 2.83-3.46 every year.
Him & Jon Matlack, who went 82-81 with a 3.03 ERA & 2.88 FIP across 7 years with the Mets have to be near the top of the “hard luck” club.
Matlack had a 9.1 WAR year where he had a 2.41 ERA & 7 shutouts, yet went 13-15.
Great article, thanks!
How can they do this? Looking at Roster Resource (which I love, btw), I think they need a bit more help out of RF, 1B, and 2B. IDK what to do about RF. For 1B, maybe give Horwitz some more time since he has 81 PA so far? I was going to suggest replacing Gonzales with Yorke to try to balance out their team BA, but he isn’t playing too well either, so maybe that isn’t a bright idea. Other than that, I am not sure what levers PIT has to pull.
They also have some injured catchers that I’m sure they were hoping would be helping the team.
Pretty sure Gonzales and Horwitz were injured to start the season. The plan coming into the season was for Horwitz to be the primary 1B.
Yup (technically Gonzales was injured in his first game, fouling a ball off his ankle). What they need to do is have gotten better players this past offseason.
Looking at the last 30 days split, the one thing they’re doing right is playing Pham a lot less. Reynolds is showing signs of life and Adam Frazier has been producing, though “Adam Frazier is producing over 30 days” is not something I’d expect to continue. Still they’ve been giving him some of Pham’s time in the outfield. The cupboard is bare at AAA, though.
Reynolds has been hitting well lately. He’s played injured a few weeks in April/May and is by some accounts a summer/fall guy. He and Gonzales should be playing at an upper 2 to 3 win level from here on out.
1B is more of a hole. I haven’t been that high on Horwitz but I wouldn’t discount him either. There’s a bunch of supplemental utility infielders. Even Bart could be a candidate now that Davis has fully emerged.
Suwinski has been in AAA and could play adequately with Reynolds possibly taking over 1B. I suppose they’re looking for him to improve his contact. That’s really the whole thing. The 1B situation is a handful of Classic Moneyball Era hack and slash players that they’re rolling the dice on. Or, you know, they could have signed an established reasonable power hitter type.
I think if they tick up in the positions you mentioned (RF, 1B & 2B), regress towards the mean in LF and 3B, get a breakout at SS and C, and the CF cuts down on his Ks they’ll have a stew going.
Also appropriate because several Pirates could appear on the AR leaderboard.
Dodgeball thanks you.
I’m shocked Gooden’s 1985 doesn’t meet the 10 WAR mark per fangraphs. It doesn’t even get to 9, and is only slightly above his 1984 rookie season.
For reference, BR.com has Gooden’s 1985 worth a staggering 12.2 WAR.
Not really that surprising I guess, since it’s the millionth example of fWAR, uh, not being great for retrospective evaluation of pitching, but I have to admit this actually did make me mad to read.
Yeah it’s absolutely ridiculous IMO. Pedro 2000 also gets no respect by fWAR standards.
But on the flip side, Gooden actually has a better fWAR for his career than bWAR. The fWAR giveth, and it taketh away.
(I do think both versions have their blindspots – bRef has Aaron Nola’s 2018 season just at 9.7bWAR. He was great that season, but was it doesn’t seem to be remembered in the same way as other 10 WAR pitching season. Maybe that’s because it’s been underappreciated. But bWAR does seem to do a double counting where you get extra credit for pitching in front of a bad defence and beating your FIP by a lot)
“Beating your FIP” doesn’t factor into B-Ref WAR – they just look at how many runs you allowed, then adjust for the defense behind you.
I rather dislike how they make the adjustment, but I greatly prefer the core concept to a methodology that draws arbitrary distinctions between pop flies and ascribes performance in the stretch to random variation.
What I meant by beating your FIP was that sometimes that is because of the defence behind you or by luck. (Obviously FIP is an imperfect model for measuring a pitchers performance – and beating your FIP doesn’t necessarily you got lucky) So 2018 Nola got credit for playing in front of a bad defence – but because his ERA beat his FIP by 0.64, that suggests that maybe the defence wasn’t actually that bad when he pitched.
Maybe 2018 Nola was, for some reason, genuinely better than his FIP – but it’s not a skill he’s had for his entire career as his ERA of 3.78 is worse than his FIP of 3.50.
I do just get a bit annoyed when fWAR for pitching is dunked on, and bWAR is held up as much better – I don’t think it is, and, as you said, some of the adjustments bWAR uses are flawed. Like 2018 Nola was the best pitching season of the 2010s… does anyone actually think that’s right?
FanGraphs’ RA/9WAR does seem pretty good – just a shame it is buried away, and hard to find.
Tom Tango’s “Strider v Snell” article from a couple years ago contains my platonic ideal of defensive WAR adjustments (team FRV filtered by pitcher), but I haven’t managed to bend the Statcast leaderboards to my will well enough to replicate it and apply the values to FG’s RA9/WAR.
Not the point of the article, but lol at 1999 Pedro putting up 11.6 WAR in 213.2 innings.
1999-2000 Pedro is the highest anyone has climbed at the Art Of Pitching. (That deGrom seemed like he might threaten that mark was astounding in itself!)
Steve Carlton in 1972 makes for an interesting contrast with the pitchers on whom the article focuses. In an alternate universe in which he’d pitched just as much and just as well, Carlton might well have featured in this article. The 1972 Phillies were terrible. But they happened to score pretty well in the games Carlton started (in small part because Carlton himself was quite a good hitter for a pitcher).
You can pitch great on a terrible team and rack up a bunch of wins if things break right. Or you can pitch quite well on a terrible team and barely rack up any wins at all if things break badly.
I thought Cliff Lee might be on this list, but it looks like he just barely missed.
Looks like he managed to last until September 1st in 2012 with 3.2 WAR and only 3 wins. I remember following that storyline, was so crazy watching this guy throw 7 innings every fifth day while his team does absolutely nothing behind him
Amazing work here. luv this
Interestingly on the same Pirates team Bailey Falter has 5 wins with a higher FIP than ERA. Baseball is funny
Fpr what it’s worth, Falter’s xERA is only 0.06 higher than his ERA, which suggests that he’s doing something right avoiding hard contact. Immediately after Michael Baumann reasonably enough called Falter “mostly a fringy big league starter,” Falter went on a ridiculous tear with an 0.76 ERA for May… and a 4.79 K/9. It was the lowest ERA for a Pirates starter in a month with six starts, and at third-lowest with at least five starts, with the lowest ever being Zane Smith immediately after they traded for him in 1990.
That’s right, two Zane Smith references in the thread! They said it couldn’t be done.
I have never understood how Falter manages to be effective as consistently as he does. His underlying numbers wouldn’t seem to support his success, but he’s put together a lot more good starts in the last season and a half than I would have thought possible.
Honestly might be worth an article if anyone can figure it out (and if Fangraphs wants to publish another piece on a last-place team’s rotation).
Skenes is outperforming is xERA by a bunch (but that means his ERA is 1.88 and his xERA is 2.32), Keller’s xERA is lower than his ERA but not as low as his FIP, and Heany seems like the one who is really lucking out, with his ERA a full run below his FIP and almost a run and a half below his xERA.
And neither of them were shoehorned in! Someone, somewhere, is getting hammered with Zane Smith Google alerts right about now.
Wonder who is the most extreme opposite – most wins above WAR? (WAWAR?)
Went almost immediately to Bob Welch’s fluky 1990 and yep – 27 W and 1.8 fWAR. That’s going to be tough to beat. . . .
Let’s see, just looking at the expansion era, nobody else is close to that. Just eyeballing it and 1980 Steve Stone is probably 2nd with 25 W and 2.9 fWAR. Actually, I suppose 1968 Denny McLain would be 2nd with 31 W and 7.2 fWAR. I suspect if I went back to the early days when guys threw like 400 IP, I’d probably find someone that would beat Welch’s 25.2 WAWAR.
(So, wait, McLain had 7.2 fWAR in a season where he threw 336.0 IP with a 1.96 ERA and 2.53 FIP???? Seriously, what kind of WAR would that generate if someone did it today?)
They lowered the mound the year after McLain’s feats, because offense was hugely suppressed.
And the best pitcher season ever – Pedro in 2000 – didn’t even make the cut on the chart above!
“Negative AR” is wrong by Michael’s definition, WAR – wins. The poor saps with strong performances and few traditional wins would have positive AR.