
Yes, Having Stars Matters In October
I’ve been doing a lot of looking at depth charts this week. All of us FanGraphs writers have – these positional power rankings don’t write themselves. When you look at the majors through this lens, you’ll naturally do a lot of thinking about floor and ceiling. The Yankees are playing who at third base? The Brewers are getting how much WAR by avoiding weak spots? The Red Sox have that many outfielders?
I’ve written some team overviews this winter. In them, I make the following claim: “Building a team that outperforms opponents on the strength of its 15th to 26th best players being far superior to their counterparts on other clubs might help in the dog days of August, when everyone’s playing their depth guys and cobbling together a rotation, but that won’t fly in October.” The converse of that claim – that stars matter disproportionately in October – is part and parcel of this depth argument. But is that true?
Some might say that the best time to answer this question is when the playoffs are just around the corner. I’d counter that those people haven’t just spent seven hours staring at a pile of acceptable-but-not-overwhelming third base and starting pitcher options and trying to write something about each one. So in the spirit of doing anything other than looking at power rankings, I decided to test out this assumption.
First things first: I settled on some definitions. I broke my data up into two parts: 1995-2011, the one-wild-card era, and 2012-present, the many-wild-cards era. I borrowed Dan Szymborski’s method for evaluating “what matters” when it comes to playoff roster configuration.
Dan’s plan is delightfully straightforward. First, take a list of playoff teams, playoff games, playoff results, and regular-season statistics for those playoff teams. If you’re trying to determine whether a given regular-season “thing” matters, you just run two regressions: one that tries to predict the outcome of playoff games using regular-season Pythagorean record and home-field advantage, and another that tries to predict those games using Pythag, home-field, and your selected “thing.” If adding your thing makes the predictions better, hooray! If it doesn’t, it’s back to the drawing board. He used an ROC curve, which is perfect for these purposes: It’s good at testing whether an effect exists more so than how good your model is.
Dan used his method to look into a lot of factors you’ll hear about on playoff broadcasts: bullpen strength, home run reliance, contact rate, second-half record, September record, playoff experience, and so on. He found a whole lot of nothing. I repeated his study with a few extra years of data and also found a whole lot of nothing. Then I started adding new stuff – and splitting by era, which deserves its own explanation.
Starting in 2012, MLB expanded the number of teams that qualified for the playoffs, first to 10 and eventually to 12. In my estimation, the composition of the postseason field has changed meaningfully in the expanded playoff era. For one thing, it’s easier to make it. There are just more spots now, which lowers the bar necessary to get in. A team with average players across the board was far less likely to make it into the playoffs in 1998 as opposed to in 2025. It’s just math; far more teams make the playoffs today.
At the same time, teams don’t distribute playing time the way they used to. It’s most notable on the pitching side, where an increasingly broad group of pitchers each takes a decreasingly large innings share. It’s true on the hitting side to a lesser degree; more rest days, more platoons, more focus on load management and surviving the season-long grind. Meanwhile, teams are treating the playoffs as their own paradigm: quicker hooks on marginal starters, higher-leverage bullpen usage, and the best position players in the lineup every game.
I decided that the right way to handle this dataset was by splitting it in two. Conveniently, there are a similar number of seasons on each side: 17 seasons with eight teams in the playoffs, and 13 (after excluding 2020) with 10 or more teams reaching postseason play. I’m open to the argument that the change from 10 to 12 playoff teams should further stratify the data, but that would be slicing things too thinly, with only four seasons under the latest rules.
Dan’s base method – regular-season Pythagorean record plus home-field advantage – was far more effective at predicting the winner of games in the 1995-2011 era. Here’s the ROC curve for using Pythagorean and home-field to predict playoff winners in those years:
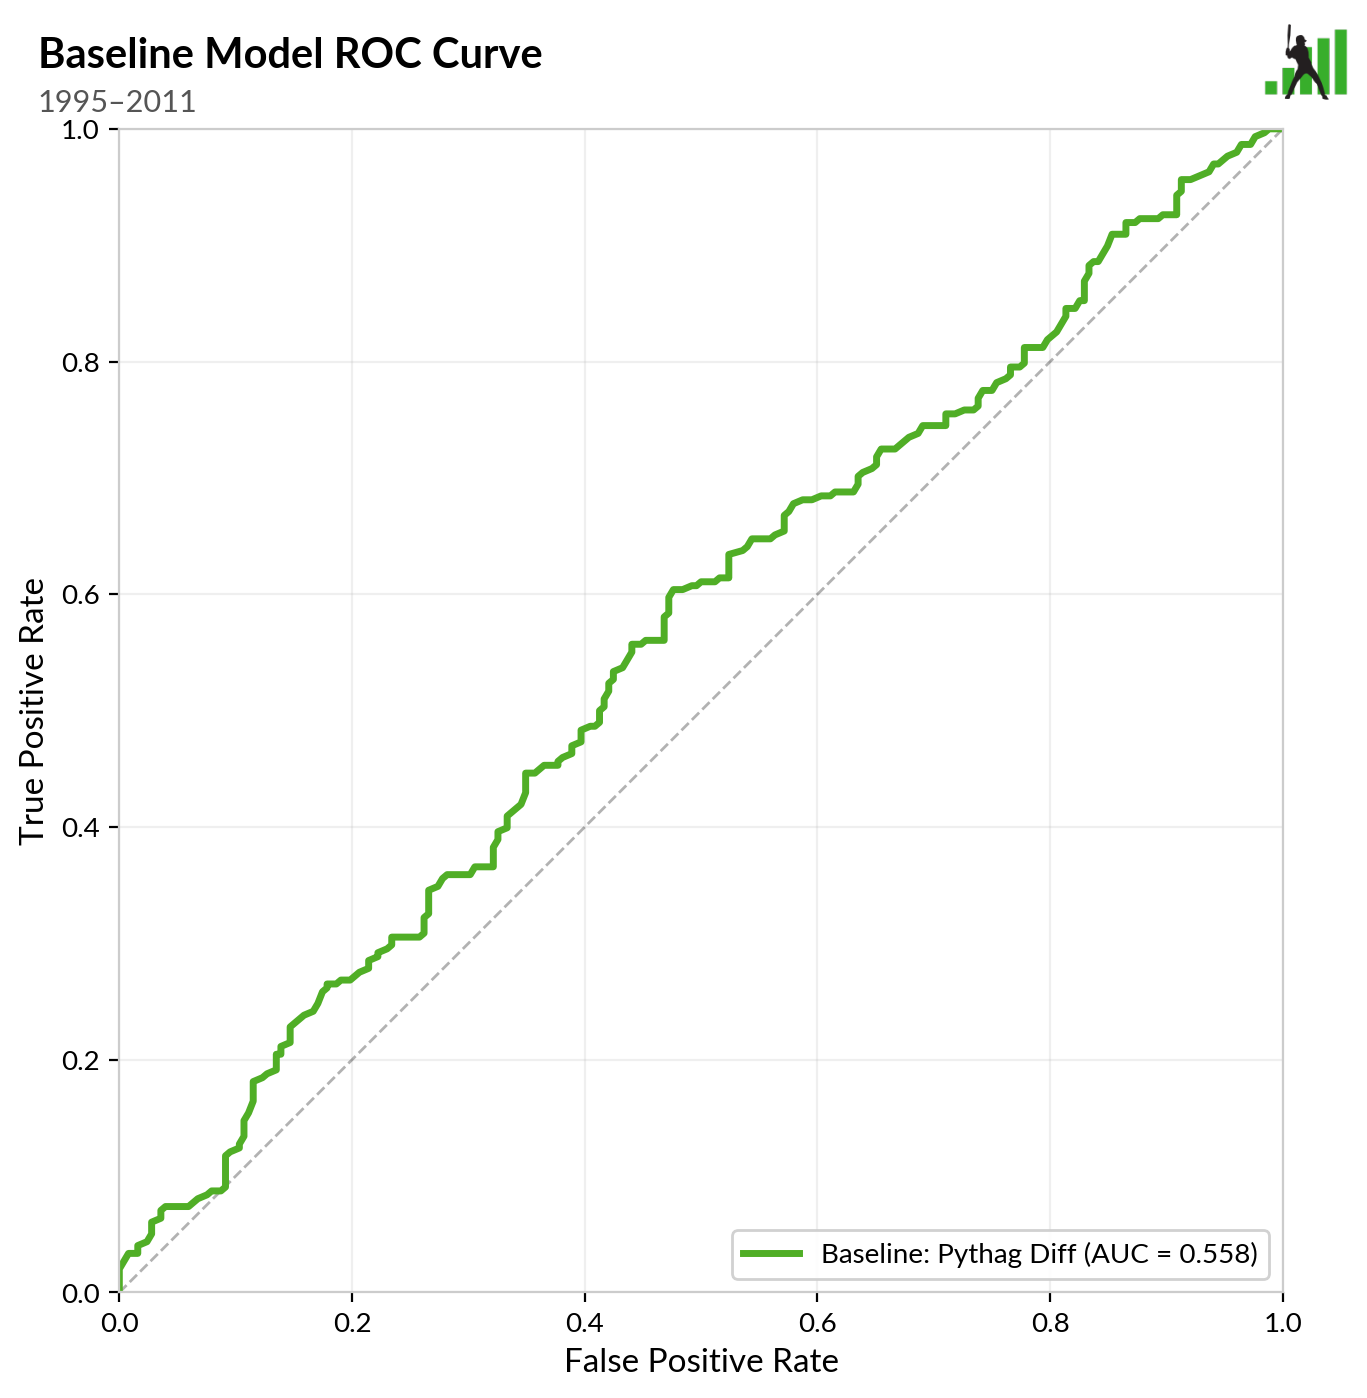
Dan picked these graphs because they’re easy to intuit visually. The more area below the line, the better: You want it to go up and to the left of the diagonal, essentially. This isn’t a great fit, but the truth of the matter is, predicting the winner of baseball games is an inexact science.
That was 1995-2011. Here’s 2012-2025:
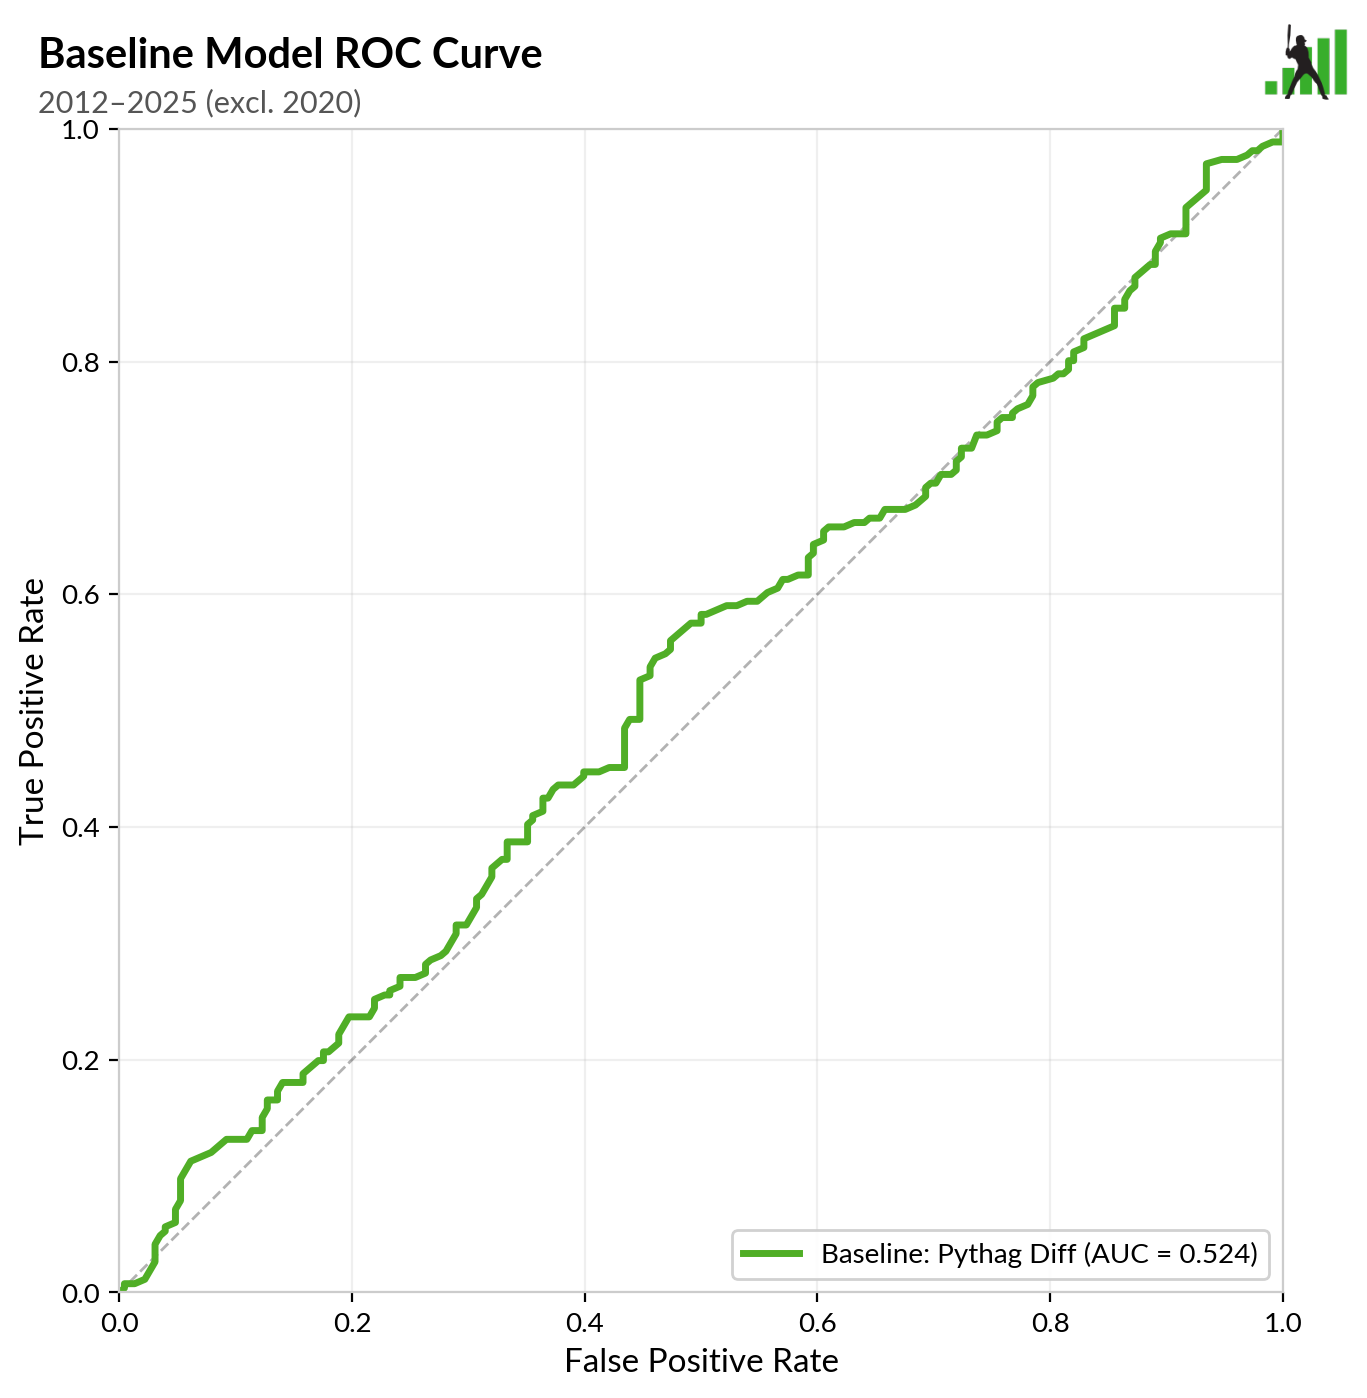
In other words, using Pythagorean expectation to predict the winner of playoff games isn’t working as well as it used to. This makes sense to me, though I can’t point to a smoking gun in the data. Teams treat the regular season differently than the playoffs. There’s no particular reason that the formula that turns regular-season run scoring into an estimation of team talent has to work perfectly for out-of-sample games. It’s a regression that assumes every run scored by a team is equally indicative of its talent. We know that’s not quite true – it’s just an abstraction of reality we’re willing to accept. It’s not shocking that Pythag might be an imperfect reflection of baseball, because it was literally designed as an imperfect reflection of baseball. It still works fairly well, and it still captures a lot about what’s going on, but the linkages don’t seem to be as clean anymore.
Now we get to the interesting part. I gave the model a new piece of information – the WAR accrued by each team’s top five players during the regular season. I asked it to predict the outcome of each game with that new information in hand and then compared it to the Pythag-and-home-field “baseline” version. I’ve drawn the baseline curve in gray and the curve that uses knowledge about each team’s best five players in green:
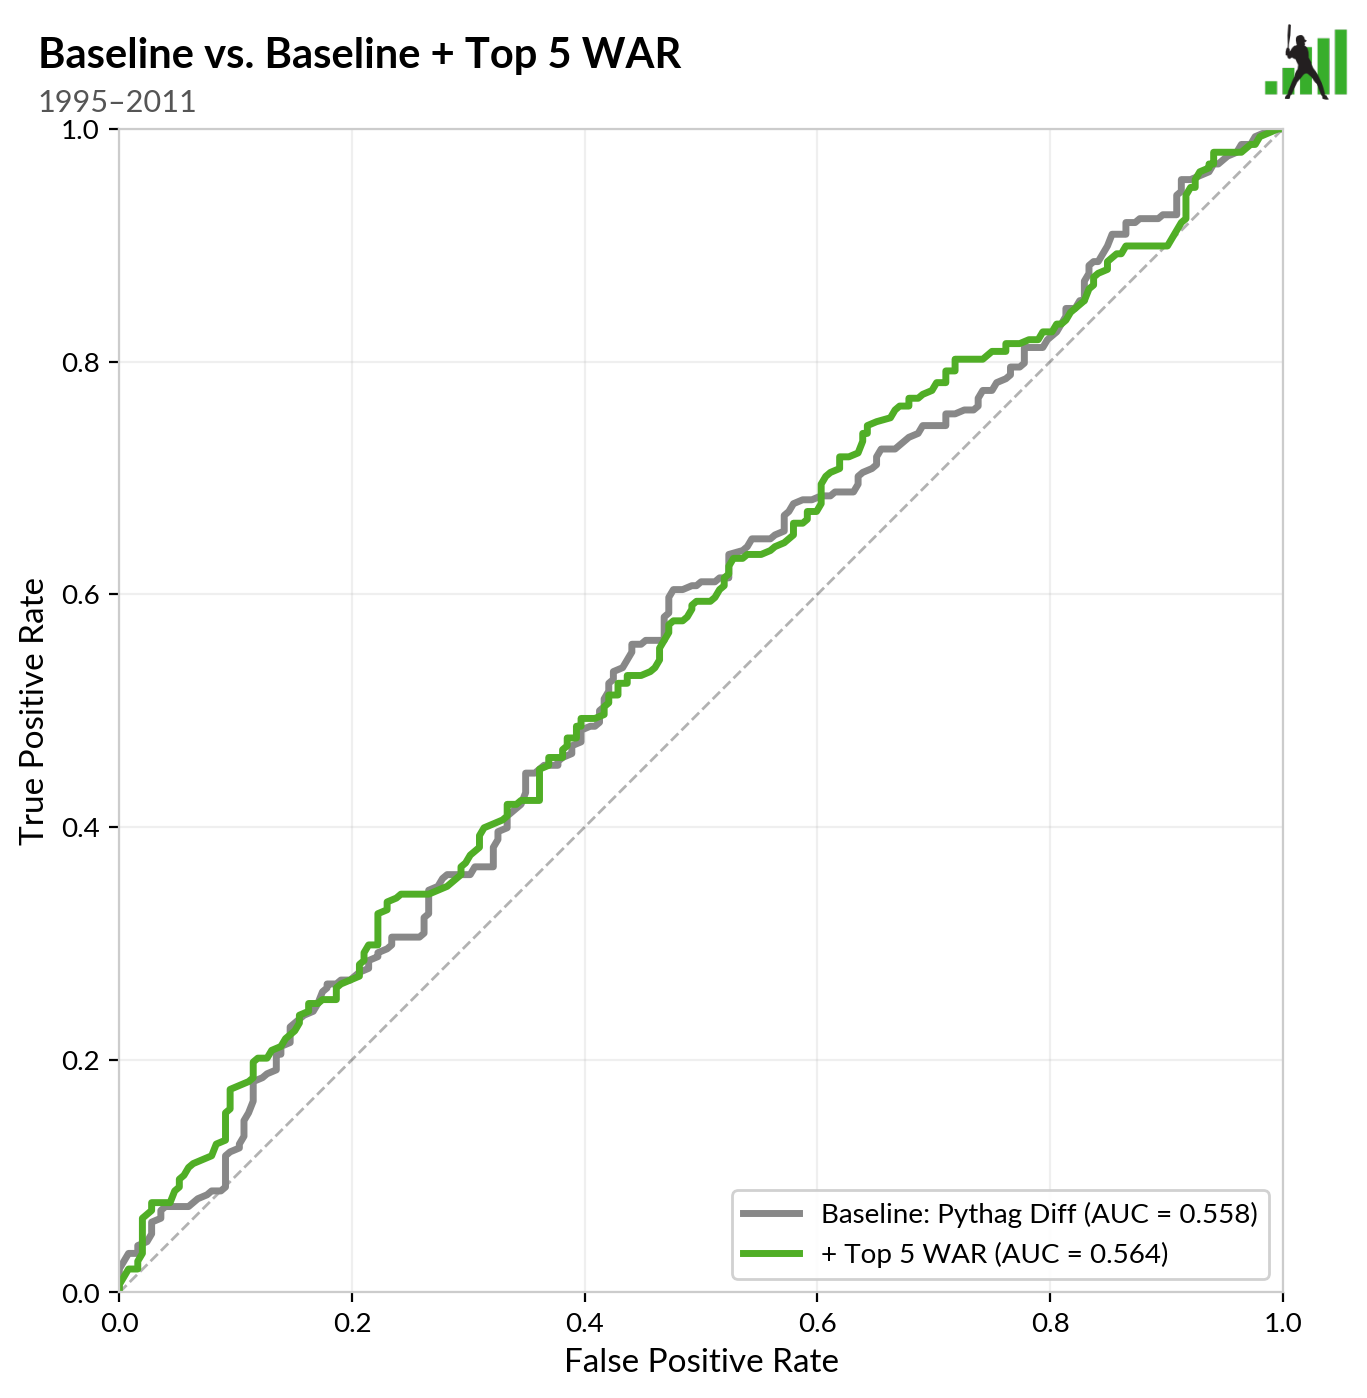
In the 1995-2011 era, the baseline model performed well enough that adding an additional feature didn’t help much. The ROC curves are basically the same – the AUC value you see reported there is the area under the curve. But the same hasn’t been true in the expanded playoff era:
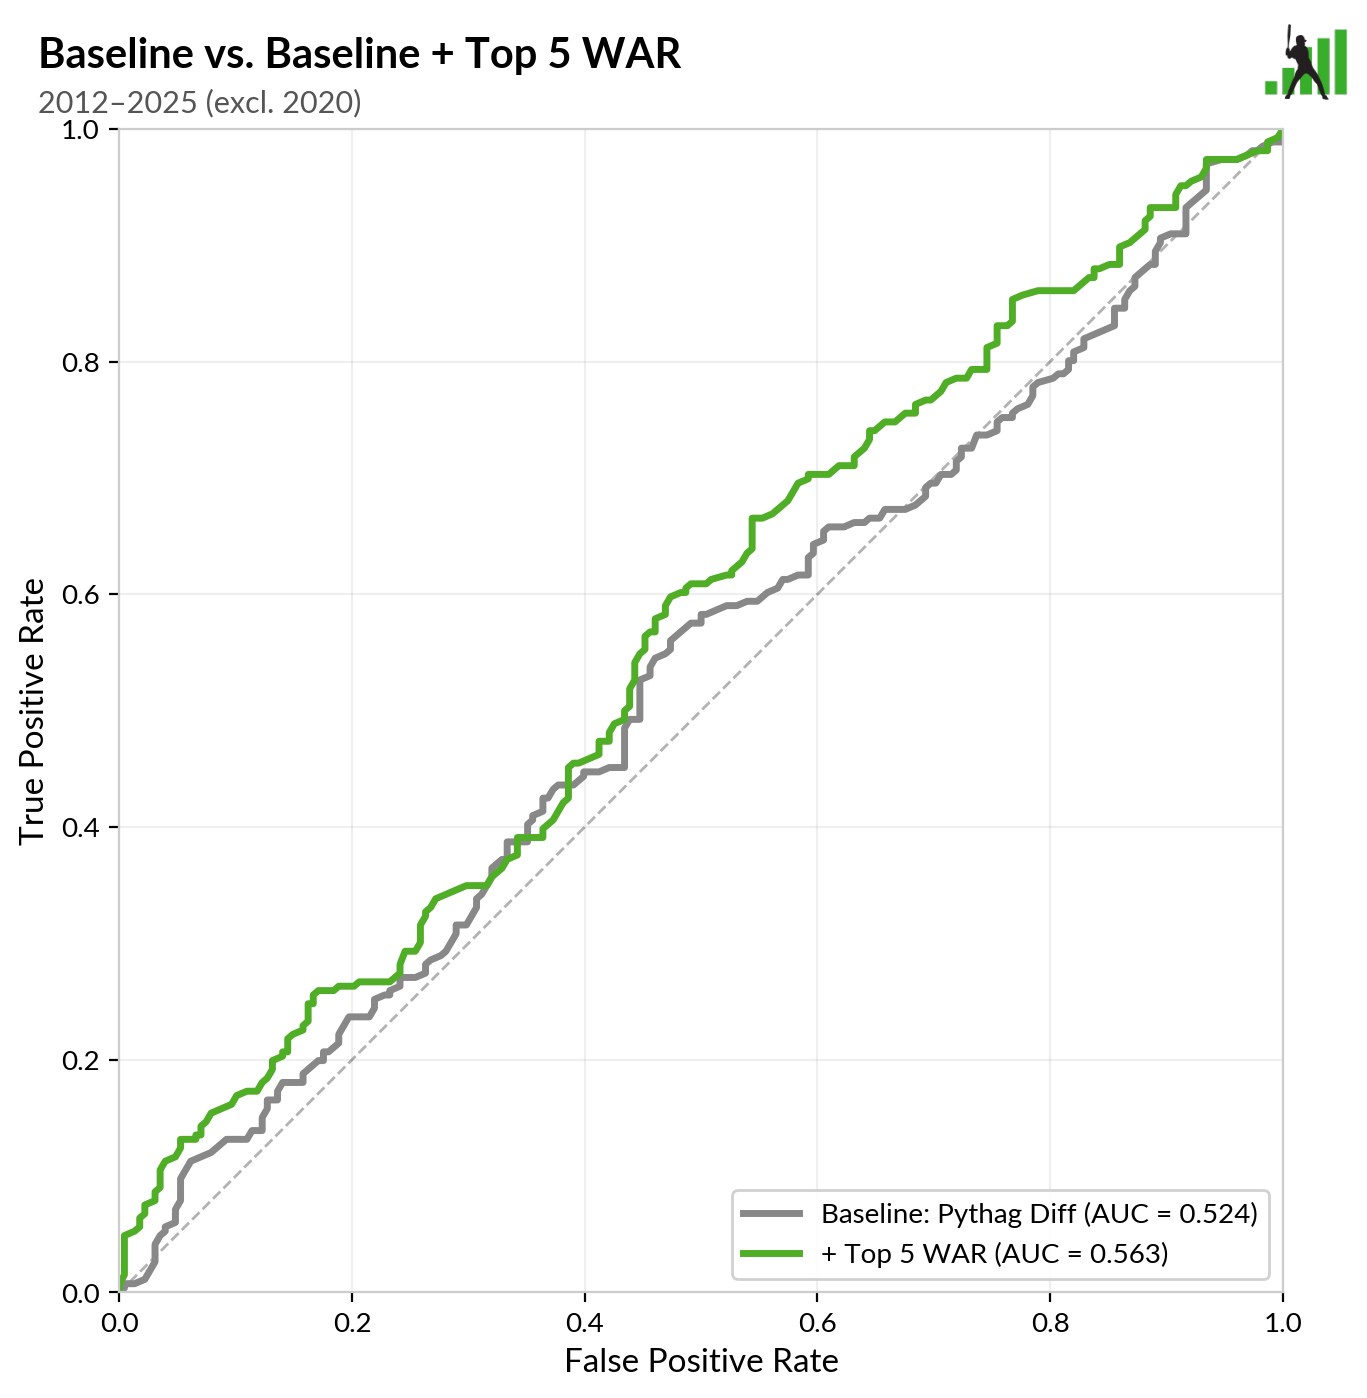
My plain-English interpretation of the data is that while knowing how many runs a team scored and allowed explains some of how that team will perform in the playoffs, it’s explaining less than ever, and how good its best players are seems to add some relevant information. That information has never hurt; it’s just more necessary than it was before when it comes to predicting how a team will do in the playoffs.
Honestly, this makes sense if you stop and think about it. I ran a common sense test to confirm what I think is going on. I took the share of playing time accrued by each player in the playoffs and then forced regular-season playing time to mirror those exact fractions. In other words, if a team’s rotation shortened from five to four pitchers in the playoffs, I redid its regular-season numbers assuming that playing time distribution. I kept per-plate appearance and per-inning statistics constant and allocated 100% of the team’s full regular-season playing time.
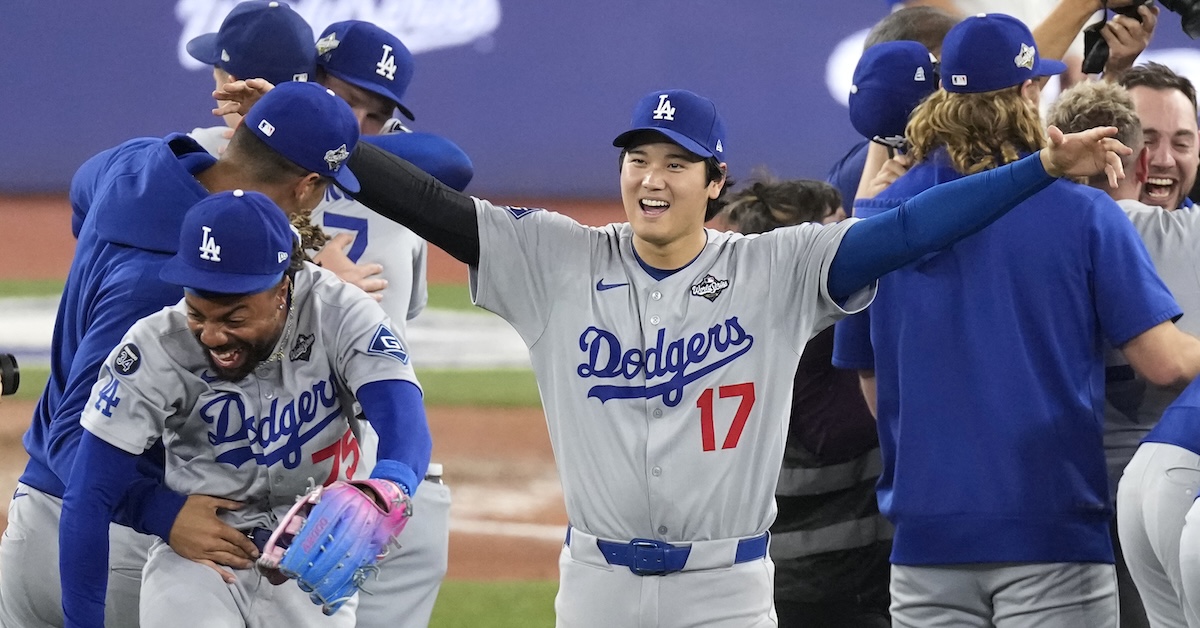
In the 2025 regular season, the Brewers racked up an impressive 46.8 WAR. The Dodgers were hardly better, checking in at 49.8 WAR. But when these two teams entered the playoffs, something changed. The Brewers played a squad that, over 162 games, would have produced an estimated 53.1 WAR. They cut out a few part-time backups, redid the bullpen, and generally improved around the margins. The Dodgers played a squad that would have accumulated 67.5 WAR over a full season. They remade their rotation almost completely and played their best hitters more. The Dodgers and Brewers had very similar run differentials in the regular season. But those squads weren’t the ones who played in the postseason, and the Dodgers had another gear available.
Is that exactly the same as measuring the WAR of only the top five players on a team? No, but it’s certainly correlated. And as a supporting effect, I tried some less-severe slices: WAR of the top 10 players on a squad, WAR of the top 15 players on a squad, an HHI coefficient, and various other measures of team composition. The more players I threw into the mix, the weaker the effect got. Using the WAR of the top 10 players still gave me a statistically significant result, but only barely so. Moving to the top 15 meant no significance. Measuring only the sixth to 15th players added no predictive power at all. In other words, knowing something about the best players on a team has been helpful for making playoff predictions in the double-digit-playoff-team era.
It’s worth mentioning that knowing this effect exists isn’t the same as having a model that captures that effect well. The AUC/ROC method measures how well a model ranks outcomes ordinally, not how confidently it predicts those outcomes. It doesn’t test calibration, merely the ability to distinguish broadly regardless of calibration. And while these values are clearly better than chance, they’re nowhere near providing actionable single-game predictions. There is a structural pattern across 500 or so games in the multiple wild-card era that suggests that knowing a team’s best players gives you additional valuable information about that team’s chances, and that teams with better stars outperform in the playoffs relative to what you’d expect if you only looked at run differential in the regular season. I can’t say more than that – but I think that’s a strong conclusion nonetheless.
Ben is a writer at FanGraphs. He can be found on Bluesky @benclemens.
This is a theory I always had behind the A’s playoff failures in their last two runs from 2012-2014 and 2018-2020.
They were solid teams with few weak spots but fewer star level performers compared to other playoff teams.
That second window had Chapman, Semien, and Olson. Less famous than some others, but not a bad core of star players. Aside from the Dodgers, who are just loaded top to bottom, if you look at the winners of the past several World Series, anecdotally it seems like a mixed bag. Obviously if you look at two teams with a bunch of average to good first division starters and then one has a couple superstars, that team will be better. But there aren’t a lot of actual stars and scrubs World Series winners.
Here’s a loaded question- Does the fact 2 of those 3 (Semien, Chapman) got an unusually large portion of their WAR/value by defense mean anything?
Trying to think it threw logically & I can see a case that differences in defensive value may mean less in the postseason- No trying guys at new positions, more defensive subs near the end of games for those that aren’t as good, the attention/effort level is better for all.
Maybe nothing..but, something that crossed my mind.
Fewer balls in play with more strikeouts from better pitchers pitching more.
Is there really fewer balls in play? Yes better pitchers pitching more but they also pitch against the best lineups in playoffs.
This is great. It makes sense: having great depth (supporting a high replacement floor) without a great ceiling (stars) limits playoff potential. Better to sneak into the playoffs with healthy stars (Phillies?) than roll into the playoffs with great depth (the Brewers/Rays model). Note that the Dodgers have…both (looking at you Tommy Edman $72mm).
Brewers/Rays are just the best teams doing this, but its basically model for the poorest 20 teams in the league who dont have enough money to pay more than 1-2 real stars on the roster.
Because it’s baseball I like the odds the Brewers get “lucky” in one of these appearances and win it all.
The last Cardinals team to win the title had a good bit of the Brewers tinge to it and figured out the Tigers couldn’t field a bunt.
*second to last Cardinals team to win the title.
Most recent cardinals team to win the title just hit the everloving hell out of the ball. Pujols had the fourth highest ops+ on his own team, which is nuts! And that doesn’t count Freese, who went on an all-time heater that October.
But anyway, in 2014ish Fangraphs wrote an article on Cardinals Devil Magic that basically found the Cardinals had pulled off about as many 1 in 10 and 1 in 100 etc comebacks as you’d expect from a random distribution. It turns out that when you get more bites at the apple, you’re more likely to see some of those crazy tail outcomes.
It seems like this analysis is suggesting that you are more likely to need those tail outcomes if you are a depth-based team. I’d be interested in seeing an analysis of how much those extra chances for good tail outcomes are worth vs a team that goes all in and maxes championship probability for a few years, at the cost of the championship probability of the couple years to follow.
I was one of the commenters asking this question, so thank you for this piece! Very interesting read.
But something is nagging at me after the first read, and I think it’s this: Does this methodology really isolate the effect of having stars vs. depth from just being a better team overall that didn’t play its stars as much during the regular season (due to injuries, load management, whatever)? Of course we would expect that type of team to do better in the postseason.
To me anyway, it’s not as much a question of Brewers vs. Dodgers, but Brewers vs. an equally good overall team that has better players 1-5 but worse players further down on the roster. I’m not sure that last element was captured. Just thinking out loud…
I mean, look, I’m not generally a complainer, but come on. You have a better methodology? Let me hear it. I spent a while designing this one. If you don’t actually want an answer to the question, you don’t have to ask, but if you ask that question, get this, and go “Eh, no, doesn’t really answer my question,” you didn’t really want an investigation of it in the first place, you just wanted to have an opinion about it.
Jeez. That escalated quickly. I apologize – I wasn’t complaining, I was really just thinking out loud, trying to engage in a dialogue. I obviously don’t have the qualifications or the brainpower to do the study myself. Just wanted to discuss, that’s all.
I think you’re on the right track and honestly the example given shows a bit of limitation in this. Yes, the Brewers and Dodgers had similar WAR in the regular season. But, did anyone ever think they were similarly talented teams?
It’s not exactly breaking news that having a bunch of role players perform better than expected during the season doesn’t lead to playoff success.
Allow me to flesh out my response further. The thing that you’re saying is covered by the methodology. The Brewers and Dodgers had very similar run differentials, very similar WAR, very similar everything that measures team strength in one number. The Dodgers clearly didn’t have as much depth as the Brewers because if they did, they’d have more WAR. Their depth players were not as good. The Brewers were able to achieve the exact same team quality as the Dodgers, as measured by every way we measure regular season team quality. I understand that one team has Shohei Ohtani, but if you’re looking for a way to define ‘an equally good team that has better players 1-5 and worse players down the roster’, well, that’s what we’re doing here by looking at Pythagorean record plus WAR of top five players.
It doesn’t feel great to me when I spend a long time working up this study and then you spend one line saying ‘nice piece’ and then nine picking nonexistent methodological holes in it without any suggestions of what might be better and follow by using an ‘of course’ to basically say that my conclusion was obvious. I also did not respond well to ‘just thinking out loud…’ because that’s something trolls say when they want to provoke you and then throw in plausible deniability at the end. You surely did not deserve the level of vitriol I gave you – but I think that if you actually want an answer to the question you asked, it would have behooved you to think through your objections a bit more before responding, because the way they were phrased made me feel as though you chose not to engage with the question. When you say ‘prove it’ in a comment, and I prove it, and you follow up by saying ‘I don’t accept your proof, do more’, it just does not feel good.
This response is certainly better than your first, but I think there are some underlying issues here that are not being addressed. First of all, as the presenter and a paid employee, you have an obligation to provide customer service on some level, and that means ‘being the bigger man,’ whatever that means given the context. You say in this response they should think more before responding, but I am not sure that is true. However, I AM sure YOU should have thought more before sending the response you sent previously. You are being paid, after all, and professionalism is expected from you.
Even in this more measured response you still act kind of superior and insinuate that the previous commenter is no more than a troll, or, at the very least, acting like one. Then you throw in something about them not having a better methodology or offering one. Thats not the job of the commenter, its your job! You are the one being paid to produce results and write about them. The commenter is here to offer the perspective of a reader.
But that isnt even the most egregious issue. That would be your final line. You claim that you ‘proved it’ and you did not. You offered evidence toward something, but based on the comments I have seen, as well as my read through of the article, not only is it far from proof, it is not effectively addressing the question that was asked. That last part is the key. Your analogy is completely off, and you are either intentionally misrepresenting what was said, or failing at critical reading. He clearly did not say ‘do more’; what he said was ‘address the question I asked.’ Those two things are not the same. He also never even implies that he does not accept what you wrote (proof or not).
You are well within your rights to say that this is what you could do on the subject, or that you do not wish to do more, or really any explanation as to why you do not want to explore this further. But based on the public exchanges available here you should not be throwing stones.
For an attempt at a constructive suggestion, maybe something like this: Compare the baseline to the sum of the WAR/600 for everyone on the playoff roster. That could account for guys like Glasnow and Yesavage, who miss a lot of time but are going to pitch at a high level in the playoffs.
On the other hand, it might not be able to tell the difference between “guy got hurt and wasn’t available in the playoffs” and “fifth and sixth starter got left off the playoff roster,” which could be an issue when we’re trying to test the hypothesis that having decent depth helps in the regular season but not the playoffs.
Hey Ben!
Having spent my life between the Northeast and Ireland, I will spontaneously combust if I ever call anyone else out on their tone!
I WOLD say that an interesting alternative would be to use “Number of X+ WAR/600 players” and/or “Number of Players projected for X+ WAR/600 the following year” rather than “WAR of Top 5 Players.”
I don’t have the Python skills to do this quickly or the time to brute force it via Excel/SPSS…but I think it would be an incredibly interesting follow up!
Feels like a distinction without a difference to me.
It’s a good question, but I do not believe what you are describing is different than what the article is assessing.
I think I know why you thought this though, it’s the Dodgers example. The Dodgers are an extreme example because several of their starters were injured in the regular season and completely healed in the playoffs. But the 2023 Rangers are more what we usually see. The Rangers gave Ezequiel Duran, Josh Smith, Travis Jankowski, and Robbie Grossman nearly 1400 PAs in the regular season and only 30 in the postseason. That’s a drop from about 20% of the PAs in the regular season to about 4.5% in the postseason, and that’s not even counting the PAs given to other marginal players who didn’t show up in the postseason at all: Bubba Thompson, Sam Huff, Sandy Leon, JP Martinez…
You just need a lot more players to get through the regular season. Guys get hurt and / or tired over a long period of time. In the playoffs you get a ton of time off and teams just play their best guys.
Yeah, that could be. As another commenter noted, the Dodgers example could also throw the perception off because in addition to their stars, they *also* have better depth.
Yeah, it felt at the time like the 2025 Dodgers’ playoff roster “levelling up” that is highlighted here as confirmation of the theory was more about them actually all being healthy in October, not a matter of the playoff format letting them focus on their stars. I don’t think you’d see as stark a result applying the same approach to the 2024 Dodgers, for instance.
Unless the star is a choke artist playoff dropper like Aaron Judge, in which case you’re doomed
LOL
At risk of slicing and dicing the data too much and being in need of multiple test correction, I do wonder if aces matter more. Is WAR/162 for the top 2 pitchers more predictive than hitter WAR? And for position players, is offensive WAR more predictive than defensive WAR?
This is very cool! I think if anything this underestimates the effect of having stars (a good top 5). Given the premise that stars are playing less for one reason or another, the WAR they accrue is also diminished. The playoff roster full season WAR analysis is a really nice way to show that.
The thing that I’m struggling with reading through this feels a little dumb, but: how do we get from the individual “predictions” to this curve? I intuitively understand what it means on a general basis, but what I don’t follow (and my admittedly limited research wasn’t able to provide) is that given the following:
How does that create the curve in the figures? The axes are true positive rate and false positive rate, so what are the individual points representative of? Single game predictions?
Please forgive me if it’s something obvious, and I’m just being dense this morning, but I’m just not processing something here.
It helps me to think of it as “if I’m accepting this many false positives, here’s how many true positives I can get.” It’s only concerned with ordinal ranking, so it just picks a yes/no winner for each game
Thanks for the suggestion — that is more or less how I conceptualized it, but I guess the question I’m trying to ask was more procedural than that. I suspect the answer I’m looking for is more of a math wonk sort of thing that requires a bit more space than here to explain. I’ll do some more research and see if I can wrap my brain around it.
Incredible thinking! Love these types of analyses!