Archive for January, 2017

Finding the Next Brandon Moss

Of course it’s true that major league teams want to find a young player to fill the shoes of an older player, all other things being equal. The younger player has more upside, and is likely to be cheaper. So of course, despite the fact that Brandon Moss has been a top-fifteen slugger over the last five years, of course teams would rather find the next Moss. It’s probably not that easy, though.

Read the rest of this entry »


Relocation Less Common in MLB Than NFL, Other Leagues

In 1972, the Washington Senators packed up and moved down to Texas to become the Rangers. In the 45 years since the Senators’ departure, however, only a single other Major League Baseball franchise has relocated: the Montreal Expos (owned by MLB at the time) moved to Washington before the 2005 season and became the Nationals.

During that same 45-year period, meanwhile, the National Football League has seen the relocation of franchises on nine occasions (10 if Oakland completes their move to Las Vegas). The National Hockey League has featured nine moves of their own (including one merger); the NBA, eight.

There are quite a few reasons for MLB’s stability relative to the other leagues, including antitrust protection, willing local governments, and a little bit more patience when it comes to stadium issues. And baseball hasn’t always possessed such geographic consistency. Consider: the creation of the Rangers actually marked the end of a 20-year period that saw quite a bit of movement throughout Major League Baseball. Rarely did a move leave a city without a franchise — and for those cities left without teams, all had new teams in short order — but there was activity nonetheless. The graph below illustrates MLB’s history of relocation and expansion.

From 1903 to 1953, the league featured all the same clubs without change. In the early 50s, however, three different two-team cities lost the weaker of their clubs, as the Boston Braves, Philadelphia Athletics, and St. Louis Browns moved to towns without franchises. An even more notable exodus occurred when the Dodgers and Giants left New York for California. As populations shifted, it was only natural for baseball to move westward.

The Yankees had New York to themselves for just four seasons before MLB approved the creation of the Mets. The addition of a franchise in Houston marked the first baseball club in Texas. When Washington moved to Minnesota, the league gave the nation’s capital a new team without missing a single season. After Milwaukee moved to Atlanta, Kansas City moved to Oakland, and the brand new Seattle Pilots moved to Milwaukee following Bud Selig’s purchase of the team, MLB found new franchises for those cities, Seattle’s seven-year wait marking the longest.

Read the rest of this entry »


Travis Sawchik FanGraphs Chat – 1/16/17

12:01
Travis Sawchik: Greetings, everyone. Welcome to Episode No. 2 of the Sawchik Chat…. Long way to go to catch up to EW podcast.

12:01
mtsw: Are we, savvy baseball fans, really meant to believe Jose Bautista is turning down bigger offers to return to Toronto? These “better offers” seem about as real as your middle school buddy’s Canadian girlfriend.

12:02
Travis Sawchik: Players, of course, generally take the best offer, so I doubt Bautista would take a lesser offer to remain in TOR. As Dave Cameron wrote last week, it appears the market for Bautista-types has over-corrected

12:03
Justino: What can you tell me about Trevor Clifton?

12:04
Travis Sawchik: If the Cubs begin to develop pitching, if more arms take jumps like Clifton did in ’16, then the rich get a whole lot richer. The Cubs have not developed much of their own pitching to date, one of the few weak areas

12:04
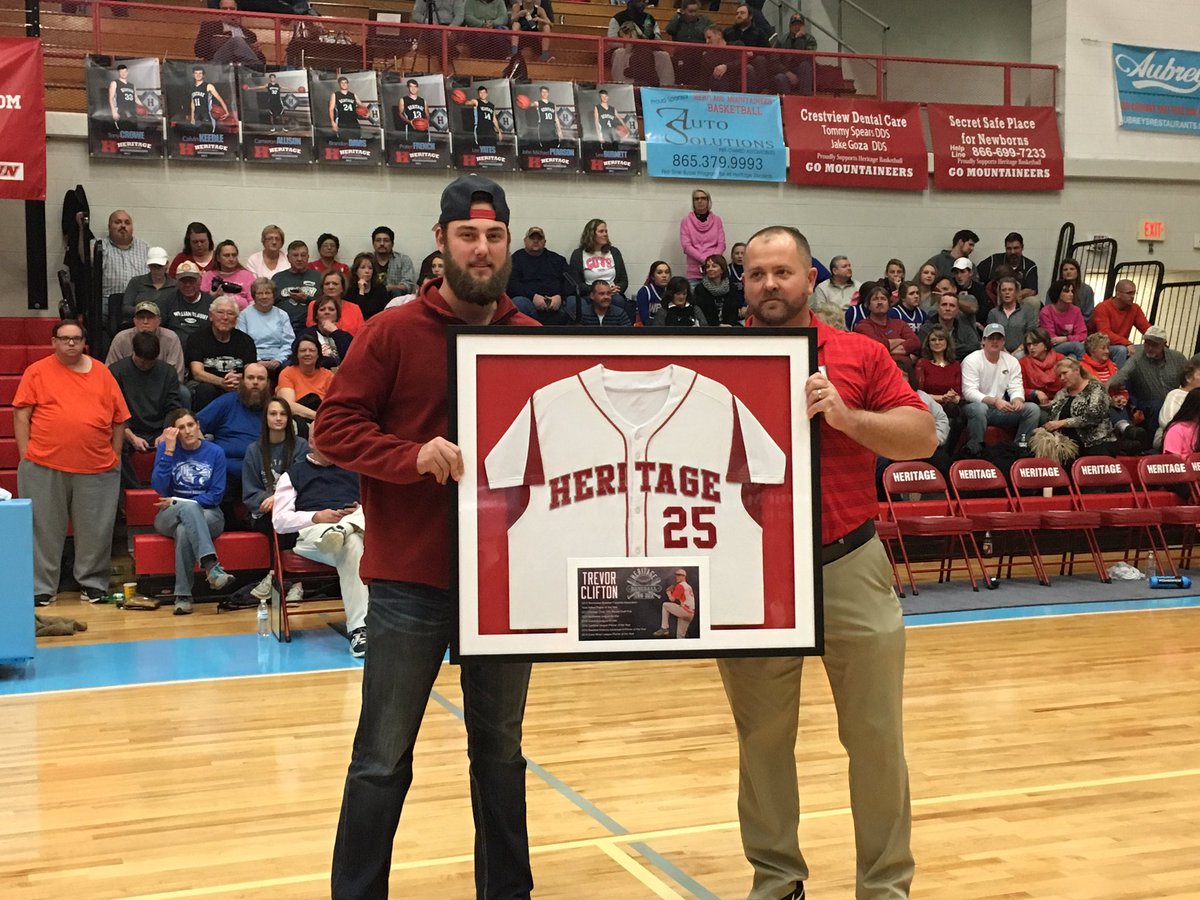
Travis Sawchik: I can also tell you it appears Clifton had his number retired:

Reigning #Cubs Minor League Pitcher of the Year Trevor Clifton gets his No. 25 retired at Heritage.
17 Dec 2016

Read the rest of this entry »


2017 MLB Arbitration Visualization

It’s that time of year again! This past Friday was the filing deadline for arbitration-eligible player contract offers. Once these numbers are published, I like to create a data visualization showing the difference between the team and player contract filings. (See the 2016 version here.) If you are unfamiliar with the arbitration process here’s the quick explanation from last year:

Teams and players file salary figures for one-year contracts, then an arbitration panel awards the player either with the contract offered by the team or the contract for which the player filed. More details of the arbitration process can be found here. Most players will sign a contract before numbers are exchanged or before the hearing, so only a handful of players actually go through the entire arbitration process each year.

The compiled team and player contract-filings data used in the graph can be found at MLB Trade Rumors.

Three colored dots represent a different type of signing: yellow represents a mutually-agreed contract signed to avoid arbitration, red represents the award of the team’s offer in arbitration, and blue represents the award of the player’s offer. A gray line represents the difference in player and team filings. Only players with whom teams exchanged numbers on January 13, 2017 will have grey lines. These can be filtered by clicking the “Filed” button.

The “Signed” button filters out players who have signed a contract for 2017; this will change as arbitration hearings occur. Finally, “All” includes every player represented in the graph. This year Jake Arrieta and Bryce Harper had the two largest contracts ($15.367M and $13.625M, respectively), but they both signed contracts before the filing deadline. This causes changes on the x-axis scale on the “Signed” and “All” tabs compared to the “Filed” tab, which is scaled to contracts under $10M.

The chart is sorted either by contract value or by the midpoint of the arbitration filings. The midpoint is the average of the two contracts and determines which contract the arbitrator awards based on his assessment of the relevant player’s value. The final contract value takes precedent over the midpoint since this represents the resolved value. Contract extension details will be written out over the data points. For our purposes, an extension is a multiyear deal that can’t be shown on the graph, since we are looking only single-year contracts for 2017.

Read the rest of this entry »


2017 ZiPS Projections – Miami Marlins

After having typically appeared in the very famous pages of Baseball Think Factory, Dan Szymborski’s ZiPS projections have been released at FanGraphs the past few years. The exercise continues this offseason. Below are the projections for the Miami Marlins. Szymborski can be found at ESPN and on Twitter at @DSzymborski.

Other Projections: Arizona / Atlanta / Boston / Chicago AL / Chicago NL / Cleveland / Detroit / Houston / Kansas City / Los Angeles AL / Los Angeles NL / Milwaukee / Minnesota / New York AL / St. Louis / San Diego / San Francisco / Seattle / Tampa Bay / Toronto / Washington.

Batters
In every season from 2011 to 2014, right fielder Giancarlo Stanton (484 PA, 3.8 zWAR) produced the highest WAR total among Miami’s field players. In 2015, he produced the second-highest WAR total on the club — less due to his own shortcomings, however, and more to the .383 BABIP that allowed Dee Gordon (606, 2.1) to record a career-best offensive season. Stanton was almost unassailably the club’s top position player for a period of five years.

The 2016 campaign marked a departure for Stanton, however, from the top of the club’s leaderboard. Limited by injury to just 470 plate appearances, Statnton also produced the worst offensive season of his career. He finished sixth on the team in wins. At the same time, Christian Yelich (638 PA, 3.8) recorded his second four-win season over the last three years. Now the two receive the same win projection, is the point of these whole two paragraphs.

One note: Yelich is located at center field on the depth-chart image below, Marcell Ozuna (602, 2.5) in left — because that seems like the club’s probable alignment in 2017. The two are projected at the opposite positions, however. Generally speaking, there’s about a 10-run difference in the positional adjustment between left and center over the course of a full season. That would render Yelich (projected for +6 runs in left) about a -4 defender in center; Ozuna (projected for -3 runs in center), a +7 fielder in left.

Read the rest of this entry »


Could Scouting Use a Pivot to the Pacific?

The signing of Eric Thames and the projections subsequently produced for him represent two of the more interesting, if lower-profile, developments of the offseason. Since Thames took his quick left-handed swing across the Pacific, he’s become one of the top sluggers in the hitter-friendly Korea Baseball Organization.

If you have 30 free minutes you can watch all 47 of his 2015 home runs thanks to YouTube:

https://www.youtube.com/watch?v=B8GheLGD98g

Despite having already played in the majors, Thames is something of a mystery, a curiosity, in transitioning from a foreign professional league. If the projections are accurate, however – and his Davenport translations are pretty close to other, former international unknowns like Jose Abreu, Yoenis Cespedes and Jung Ho Kang – then the Brewers have themselves a steal.

In the cases both of Cespedes and Kang, who played in foreign leagues that draw fewer scouts, analytics played a considerable role in the decision to sign them. Analytics and projections also played a significant part in the Thames signing, as Brewers GM David Stearns told David Laurila in the latter’s Sunday notes this weekend.

Kang was the first KBO hitter to make the jump directly to the majors. There were no direct comparisons. But plenty of South Korean stars had played in the Japan’s Nippon Professional Baseball Organization, so the Pirates looked at their production in Japan and then studied the more sizable sample of NPB position players who have played in the majors.

Back in 2013, the A’s were also creative in projecting Cespedes, then a trailblazing Cuban defector, as detailed by Ben Reiter in Sports Illustrated.

“[Farhan] Zaidi built a model that analyzed not just the grades the scouts had given to Cespedes on the usual eight-point scale, but also the scouts themselves. Say three guys have a six power on him, three guys have seven power on him. What kind of minor leaguers or major leaguers do those guys have those grades on?”

The A’s did not miss a chance to scout Cespedes when access was available. The Pirates did send scouts over to evaluate Kang in addition to video analysis (though Kang’s off-the-field issues were apparently not discovered). Still, recent success stories of players signed from foreign pro leagues are analytics-heavy because they’ve had to be. There are few scouting resources committed to South Korea and Japan. Cuba has been difficult to scout due to political reasons.

But what are MLB clubs missing at the professional and amateur levels by not having more of a scouting presence in places like South Korea? And why are such areas not heavily staffed?

Read the rest of this entry »


Sunday Notes: Baseball Scotland, Projections, Posada, more

Football — what we Americans call soccer — rules Scotland’s sporting scene. Rugby runs a distant second, while golf, which was invented in St. Andrews, probably ranks third in terms of popularity.

Baseball barely registers a blip in the country’s sporting consciousness. But that doesn’t mean it isn’t played there. An organization called Baseball Scotland is keeping it alive, with hopes of increasing both interest and participation.

I learned more from one of its members while I was in Glasgow over the holidays.

Xander Harrison, a 24-year-old financial services analyst, plays for the Glasgow Comets. Over pints of Tennent’s Lager at a City Centre watering hole, Harrison told me that Baseball Scotland was formed in 2007 by the Edinburgh baseball club, which previously had teams in the British Baseball Federation, but had become disgruntled with the league organization and costs. There had also been a recognized BBF Scotland Division, and before that a Scotland Division in the old British Baseball League.

There is no organized baseball in the Scottish school system. Harrison began playing around the age 11, when he joined a youth league formed by the Glasgow Baseball Association. His team — one of eight in the league at the time— was the White Sox. That led to his becoming a fan of Chicago’s South Side club. Read the rest of this entry »


FanGraphs Audio: Dayn Perry Saves Christmas

Episode 709
Dayn Perry is a contributor to CBS Sports’ Eye on Baseball and the author of three books — one of them not very miserable. He’s also the unlikely hero on this edition of FanGraphs Audio.

Don’t hesitate to direct pod-related correspondence to @cistulli on Twitter.

You can subscribe to the podcast via iTunes or other feeder things.

Audio after the jump. (Approximately 1 hr 13 min play time.)

Read the rest of this entry »


The Best of FanGraphs: January 9-13, 2017

Each week, we publish north of 100 posts on our various blogs. With this post, we hope to highlight 10 to 15 of them. You can read more on it here. The links below are color coded — green for FanGraphs, brown for RotoGraphs, dark red for The Hardball Times and blue for Community Research.
Read the rest of this entry »


2016 Hitter Contact-Quality Report: NL Left Fielders

As the long dormant Hot Stove season shows signs of flickering to life, we continue our position-by-position look at hitter contact quality. Last week, we looked at a rather moribund group of AL left fielders; today, it’s their NL counterparts, whose 2016 production was much more significant. As a reminder, we’re utilizing granular exit-speed and launch-angle data to measure how position players “should have” performed in comparison to their actual stat lines.

Read the rest of this entry »