Charles LeClaire, Jerome Miron, Vincent Carchietta – Imagn Images
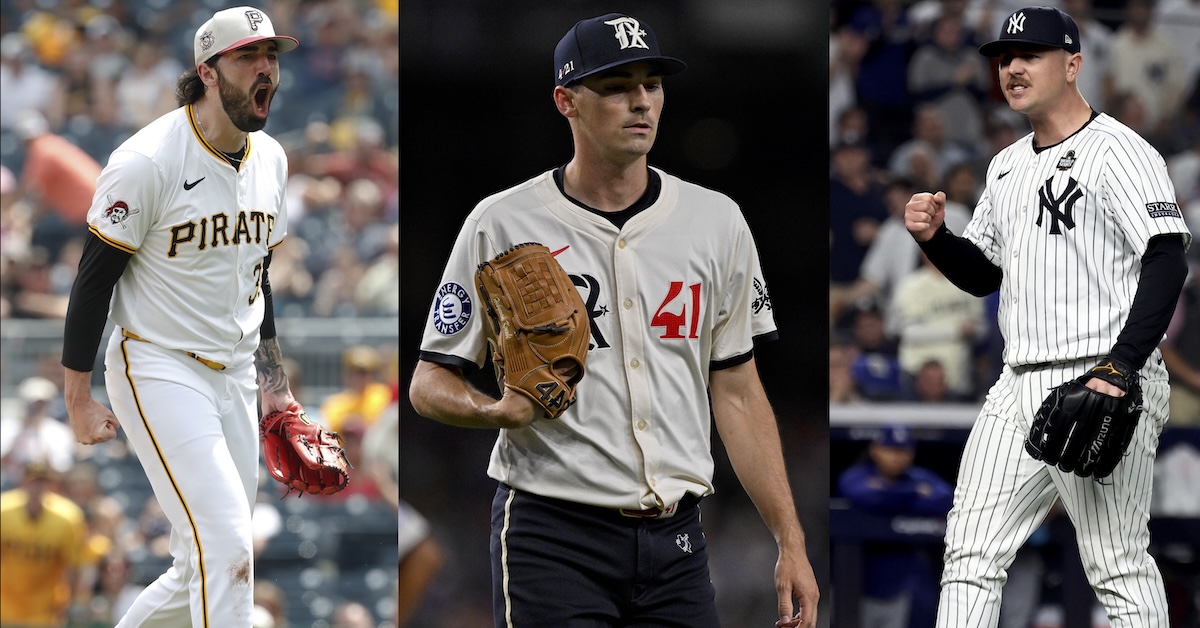
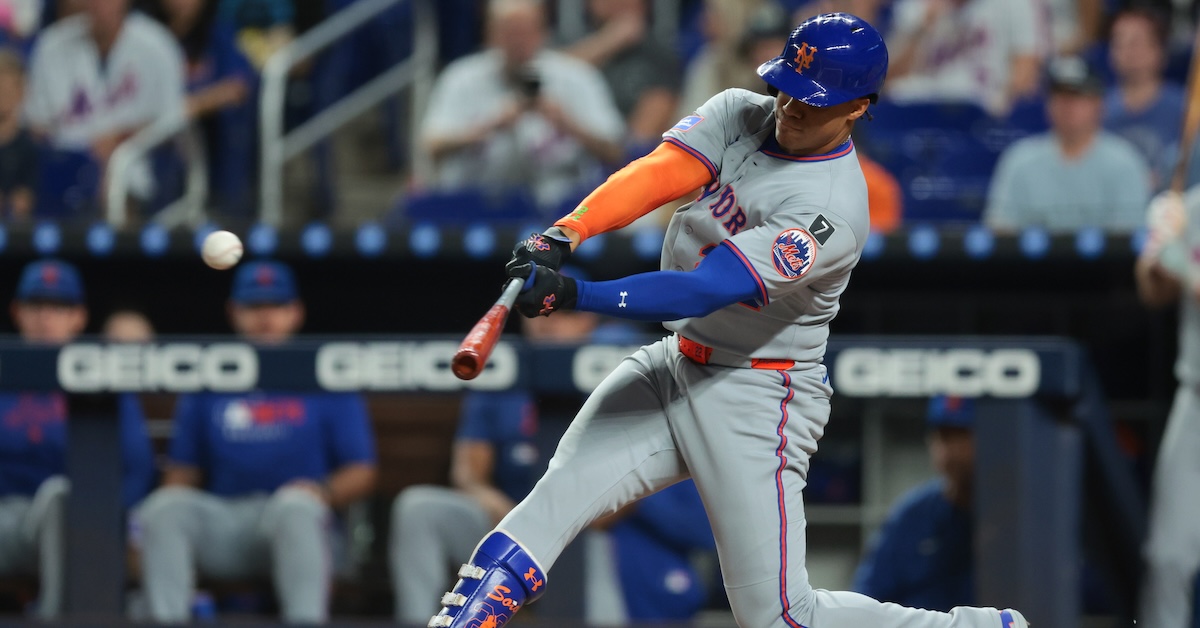
Every winter, the shiniest free agents on the market capture the attention of baseball fans everywhere. “Ooh, could you imagine Kyle Tucker in my team’s colors?” That’s a fun conversation regardless of which team you root for. But most teams aren’t going to sign Kyle Tucker. Most teams aren’t going to sign a top 10 free agent, period. Indeed, come June and July, there’s a good chance that the free agent signing you’re going to either laud or rue will involve some reliever you’d never heard of six months prior. So let’s meet a batch of pitchers who are going to make fans remember their name, one way or another, in 2026: Hoby Milner, Mark Leiter Jr., and Colin Holderman.
I used to think of Hoby Milner as one of the unending wave of Brewers who looked unbeatable in navy and gold and unspectacular elsewhere, but as it turns out, that was unfair to him. He departed the upper Midwest for the first time since 2020 last winter, signing a $3 million deal with the Texas Rangers after Milwaukee non-tendered him. Far from crashing out, though, he spun another solid season, his fourth in a row, while handling 70.1 innings of the highest-leverage work of his career. He finished the season with a 3.84 ERA and a 3.39 FIP, pretty much a dead ringer for his career numbers.
Why, then, is his deal with the Chicago Cubs for just one year and $3.75 million? It’s because he’s an extreme lefty specialist, and that skill set generally comes with a limited market. Milner isn’t a traditional late-inning reliever, a matchup-proof flamethrower. He has enormous platoon splits, triple the league average for lefty pitchers over a fairly substantial sample. It’s for exactly the reason you’d expect: Milner throws sidearm and with little velocity, relying on a sweeper that he throws nearly half the time against lefties to tie them into knots. Read the rest of this entry »
Two months ago, the Blue Jays marauded their way through the playoffs despite a bullpen they preferred not to touch with a thirty-nine-and-a-half-foot pole. They started the offseason by adding to the rotation, with Dylan Cease the big name acquisition and KBO MVP Cody Ponce an interesting flier. Now, they’ve turned their attention to relief pitching, and they’re working every angle there. They selected hard-throwing relief option Spencer Miles in the Rule 5 draft, traded for sidearmer Chase Lee, and late last week added the piece de resistance, the weirdest reliever in baseball. That’s right: Tyler Rogers and Toronto agreed to terms on a three-year, $37 million deal with a vesting option that could push it to four years and $48 million.
I’m legally obligated to lead any article about Rogers by mentioning his unconventional delivery. He throws upside down, it’s true. He throws in the low-to-mid-80s as a result, with movement that resembles nothing else in baseball. It’s hard to wrap your head around how his pitches move. His slider has huge positive vertical break; it’s a regular slider turned upside down. His fastball, naturally enough, breaks downward, which results in some incredibly counter-intuitive at-bats; despite being about 10 miles an hour faster, it falls meaningfully more than the slider on its path homeward.
With that out of the way, forget what Rogers throws like for a while. I’m sure that’s interesting to the Blue Jays, but what actually matters at the end of the day is how effective he is. He’s very effective, as it turns out. His career 2.76 ERA is flattered slightly by all his years calling spacious Oracle Park home, but not as much as you’d think. His 67 ERA- is a top-15 mark among relievers since his 2019 debut, and I actually think ERA- punishes him, because his specific game doesn’t benefit as much as most pitchers from a big outfield. He gets a ton of grounders. He perennially runs a low BABIP allowed, and it’s no fluke; batters just can’t square him up. Read the rest of this entry »
The Winter Meetings historically mark the beginning of the signing period for marquee free agents, and this week has seen several stars agreeing to big contracts. But there were also plenty of little deals among the titans, and one of them in particular fascinates me. That deal: The Braves signed Mike Yastrzemski to a two-year, $23 million contract, with a club option for a third year, as Jon Heyman first reported.
There’s a lot to unpack with this one, but we might as well start with Yastrzemski. The 35-year-old outfielder is nothing if not consistent. In a 2025 split between the Giants and the Royals after a deadline deal, he logged his seventh straight season with a WAR total between 1.5 and 2.5. It was his fifth straight year with a wRC+ between 99 and 111, and the third of those five years where it was exactly 106. He played his usual solid outfield defense, and the Royals even felt confident enough in him to occasionally use him in center field. If he’s your best outfielder, your outfield probably isn’t all that good. If he’s your third-best guy, it’s probably great.
But while Yastrzemski’s season looked like the others in terms of his overall line, it was a tale of two halves. In San Francisco, he started slowly and never really got going. He posted the worst contact quality marks of his career while struggling to a below-average line. Then he went to Kansas City and went on a huge heater, for lack of a better way to describe it. Everything got better all at once. Yastrzemski’s barrel rate increased from 7.1% to 10.9% at the same time that his swinging strike rate declined from 8.0% to 5.4%. That’s a neat trick if you can pull it off, and as a result, he hit more homers in KC than in SF in half the plate appearances, all while cutting his strikeout rate to an otherworldly 11.8% and also walking 13.4% of the time. Read the rest of this entry »
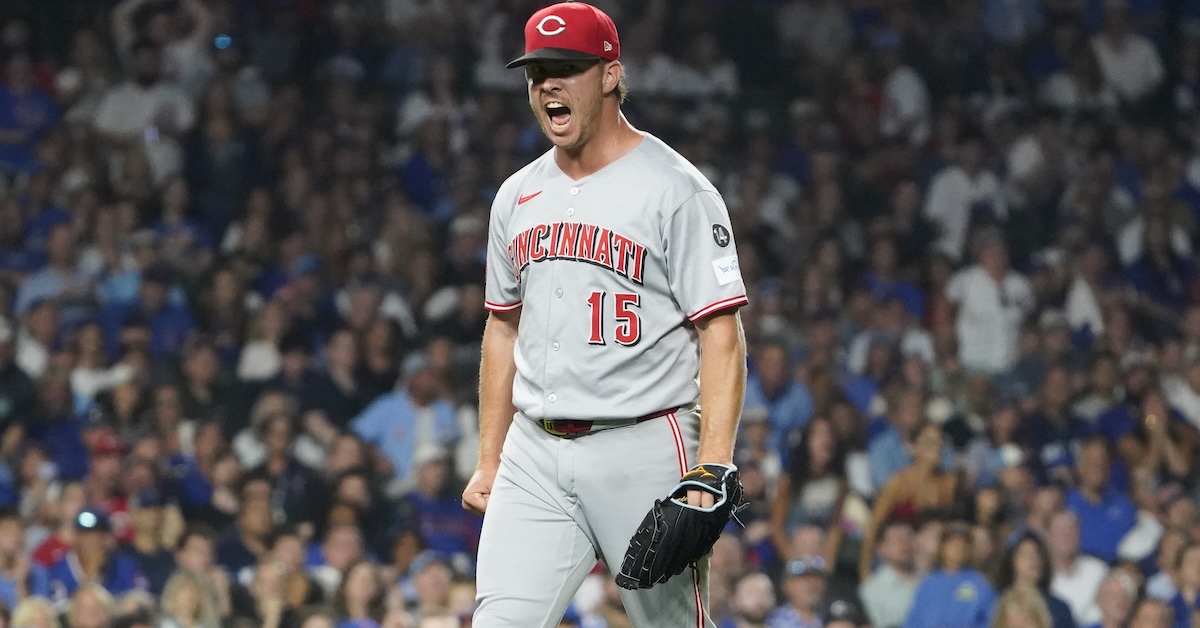
It’s been a busy December for free agent relievers. Ryan Helsley and Devin Williams, two of the most interesting names on the market, eachsigned with new clubs, and they each got multi-year guarantees despite shaky 2025 results. The next shoe to drop wasn’t quite as heralded of an option, but he too got multiple years and beat market consensus. The signing in question: Emilio Pagán and the Reds agreed to a two-year, $20 million deal, with an opt out after the first year.
Pagán was a far more effective reliever in 2025 than either of the two splashier names ahead of him. He had one of the best seasons of his career at age 34, in fact: 68 2/3 innings pitched, a 2.88 ERA and 3.72 FIP in hitter-friendly Cincinnati, and 32 saves in his first full-time closing job since 2019. He bounced back from an injury-interrupted 2024 with better fastball velocity and better pitch shape across the board, and got richly rewarded for it with a 30% strikeout rate. Is he homer-prone? You bet, thanks to a 0.51 GB/FB ratio. But a .200 BABIP and a solid HR/FB% (10.8%) meant that he actually allowed fewer homers per nine innings (1.31) than his career mark (1.51), and not by a small amount, despite pitching in a launching pad.
When things are going well for him, Pagán makes everyone think they can hit a home run, then pulls the rug out. He runs his four-seamer high and spots a heavy splitter off of it, a classic fly ball pitcher mix. It’s one of those strategies that looks awful when it isn’t working, and yet seems to come through most of the time anyway. More specifically, Pagán went through a three-year stretch of terrible form from 2020-2022, posting a 4.61 ERA and 4.71 FIP. Then he broke out in 2023 and has been solid since. The weirdest part of it all? His stuff and command metrics barely budged between those two wildly different stretches.
Reversals like that go a long way toward explaining why reliever performance is so difficult to predict. When Pagán has it, he’s a worthy late-inning reliever. His ERA- was 40th among relievers last year, and it’s 60th over the past three years, even with his ineffective 2024 in the mix. He’s pitched like you’d expect a closer or setup man to, in other words. His FIP tells a broadly similar story, and I’m willing to believe that pitchers with his extreme tendencies outperform their FIP in the long run. If you get good Pagán, he’s a very useful bullpen piece, the kind any team would love to have in the bullpen and many fringe contenders would love to have as a closer.
That’s the calculus from the Reds’ perspective. They’ve managed their payroll tightly in the early years of Elly De La Cruz’s team control window, hovering around the $100 million mark with wiggle room in either direction. With that budget constraint in mind, the top five or so relievers in this free agency class were presumably off the board. The next tier down is a mixture of interesting pop-up arms, aging closers, and reclamation projects. Would you rather have Kenley Jansen or Pagán? Seranthony Domínguez? Kyle Finnegan? Phil Maton? Maybe Drew Pomeranz? I think I’d take Pagán or Jansen over the field – I ranked them that way in my Top 50 Free Agents list – and as an added bonus, he’s already familiar with Cincinnati. I’d take Raisel Iglesias over him – rankings, again – but he signed for one year and $16 million, probably outside of this team’s price range. The Reds probably could’ve gotten some solid lefty specialists for the $10 million or so annual salary that they gave Pagán, but that’s not what they were in the market for this winter. They needed a bankable closer, and in the aisle they were shopping in, there weren’t that many options.
This team really does need relief arms. The Reds didn’t have to cover many bullpen innings in 2025, but even then they struggled to piece it all together. Pagán, Tony Santillan, and Graham Ashcraft formed an effective three-headed monster at the top, but the rest of the pen was ineffective even in limited time. With a bandbox for a home stadium, it’s hard to expect a similarly limited need for relief pitching in 2026. This was the path of least resistance for a team that really does need to do something to challenge for the NL Central title in 2026 and build on its surprising 2025 Wild Card berth.
Now, the risks? They’re real. It was only a year ago, after his down 2024 performance, that Cincinnati fans were lamenting Pagán’s decision to pick up his player option for 2025. More innings and a .200 BABIP turned that frown upside down, but it’s not like it’s impossible to imagine an ineffective Pagán. Would you be shocked if he had an uneven, homer-prone 55 innings in 2026 and then picked up his option? I certainly wouldn’t be. We just saw that!
That leaves me in the situation of liking this deal more for Pagán than for the Reds, and yet I’d make this offer if I were in their shoes anyway. Figuring out which relievers will be good in a year’s time is incredibly difficult. If it were easy to solve, the Dodgers wouldn’t have signed Tanner Scott and Blake Treinen last winter and then spent this entire October hiding them. Despite that difficulty, relievers are integral to a contending club. If you aren’t winning the close games, it’s hard to make the playoffs. The Reds likely wouldn’t have done that last year if not for Pagán.
With that backdrop, what were the Reds supposed to do? Sign a different, similar guy for slightly less? Sign two reclamation projects on one-year, $5 million deals? It’s not even like the second year is that much of a disaster; in a year’s time, they’re going to be contending with a core built around De La Cruz and looking for relievers, and I don’t think the market rate is likely to plummet in the meantime or anything. Sure, you might get bad Pagán in 2026 and then have him opt in, but the inherent volatility of relievers means that even that isn’t a tragedy. It worked out last time!
There’s some chance that Cincinnati could have waited longer, negotiated more stingily, and reached a slightly more team-friendly deal with him. So far, Pagán is the early signing whose market has most outstripped my projections. But who cares? What were the Reds going to do, save a million dollars or two? From their perspective, the risks were greater, because if they dragged their feet in negotiating with Pagán and he signed elsewhere, they’d suddenly be sifting through a variety of relievers they’re presumably less interested in with a strong need to find a deal. I’d prefer to overpay slightly for a guy I’m comfortable with than hunt for unknown bargains to fill an essential role, and it seems the Cincinnati front office thinks similarly.
I’m not convinced that this is a great long-term way to run a team. It certainly wouldn’t be my preference in a vacuum; I’m a Rays/Dodgers/Brewers-style bullpen guy at heart. I love reclamation projects and throwing a lot of relievers at the wall to see what sticks. I love betting on guys with elite stuff and seeing if they can figure out how to throw strikes, or betting on guys with elite command and seeing if they can figure out how to throw harder.
I’m also not running the Reds, staring at two superstars in De La Cruz and Hunter Greene and trying to make the playoffs again after a miracle run. Sure, it would be great to build an incredible pitching development system from the ground up. But it’s December, and the season starts in four months, and that’s not enough time to overhaul an entire organization, not even close. The Reds needed a reliever. They got a guy they’re comfortable with at a rate that won’t force them to cut back elsewhere. Maybe it’s a slight overpay, and maybe he’s more volatile than his 2025 results would suggest, but for the Reds? He’s just what they needed.
Last week, MLB announced the distribution of the pre-arbitration bonus pool. You probably saw roughly one headline from this: Paul Skenes earned a record $3,436,343 bonus for his spectacular sophomore season. That is indeed great news, in my opinion. Skenes was one of the most exciting and best players in baseball in 2025, and a compensation system that more closely aligns skill with salary is a no brainer to me. But while Skenes’ record haul drew the headlines, the vast majority of the $50 million pool was spread widely; 101 players received bonuses, with all 30 teams boasting at least one awardee.
I’m here to tell you that I think this is a wonderful development. The fund, established in the most recent collective bargaining agreement, takes in $1.67 million from each team every year to fund its $50 million payout. It hands some of that money out to award winners, from $2.5 million for Skenes’ Cy Young Award win down to $150,000 for Daylen Lile’s fifth-place Rookie of the Year finish. The rest goes to the top 100 pre-arbitration players in a WAR formula jointly calculated by MLB and the MLBPA according to a set ratio.
This didn’t feel like a huge part of the CBA at the time it was signed, but in my opinion, it’s been an incredible boon for the game. Baseball’s compensation system has always been out of whack. The service time system limits all pre-arbitration players to the minimum salary, more or less. Teams do occasionally award salaries slightly greater than the minimum ($760,000 in 2025), but generally by a de minimis amount: The Pirates paid Skenes $875,000 this year, for example.
That flat structure means that under the old system, Skenes would have earned roughly $1.6 million in 2024 and 2025, instead of the $7.2 million he’s pocketed under the new system. You can’t convince me that that’s a bad thing. Cristopher Sánchez is an even better example, because unlike Skenes, he didn’t have a huge signing bonus as an amateur — not to mention all the ancillary income the Pittsburgh superstar earns through his various endorsement deals as one of the most recognizable players in the sport. Sánchez just eclipsed three years of service time; through the end of 2024, the Phillies had paid him around $2.5 million in salary for his first two-plus major league seasons. He signed a contract extension that paid him $3.55 million in 2025, bringing his career contractual earnings up to roughly $6 million. Thanks to the bonus pool, though, he’s received an additional $3.5 million over the last three years. That’s a huge difference, and in a clearly good direction for money to flow. Read the rest of this entry »
I never pitched in Little League, but I remember many of the lessons our coach imparted to this day. Most specifically, I remember him harping on “hard in and soft away.” This was silly. Nobody on my team could throw a curveball, and even from my youthful perspective, no one could throw anything hard either. We all mostly struck out or walked; pitchers with command were pretty much untouchable in my small-town East Tennessee league. But we’re losing the plot here – as it turns out, that advice is omnipresent in baseball, from little leagues to the majors.
I’ve always been enamored with this simple and yet fascinating rule of thumb. Why does it work? Does it work, even? What’s so special about “in” and “away” relative to pitch speed? I’ve never quite found a satisfactory way to classify it. But while I was taking a look at contact point data last week, I came up with an idea for how to measure this. When you look at the data, the evidence has been there all along.
I focused on the “hard in” aspect of the adage, because major leaguers throw so many different secondaries that honing in on what “soft” meant seemed impossible. To that end, I devised a quick test to see how conventional wisdom behaves in practice. I defined “inside” and “outside” pitches by removing the middle third of the plate, then extending out nine inches past the edge of the strike zone in both directions. I looked at sinkers and four-seamers thrown in these areas to define “hard in” and “hard away.” Read the rest of this entry »
I’ve long been interested in measuring the value of making an out. Different outs count differently, and yet pretty much every baseball statistic you can imagine ignores that fact. I’m not just talking about advanced ones like wRC+ or wOBA, though those do indeed treat all outs as equal. I’m talking about basic things like batting average, on-base percentage, and slugging percentage. No one says, “Well, he batted .320, but some of those outs were in bad situations, so it was more like batting .313.” That’s not how we think about offensive statistics.
But just because we don’t count outs differently doesn’t mean that they all have the same value. This is obviously true. Striking out with a runner on third and fewer than two outs is a tragedy. Hitting a run-scoring groundout in the same situation gets the batter a long series of fist bumps back in the dugout. But when it comes to wRC+ or batting average, that distinction doesn’t show up.
There are good reasons for existing statistics to work the way that they do. Batters don’t control who’s on base and how many outs there are when they come to the plate. They don’t control whether there are fast runners on base, or whether the outfield has arms so weak that anyone could score from third base on a fly ball. In the same way that a home run is a home run is a home run, statistics that try to measure batter skill treat all outs the same. But still… I wanted to know more. Read the rest of this entry »
Friday was a key deadline in the offseason calendar: the last day that teams could non-tender players instead of offering them a contract in arbitration. It’s something of an annual tradition. Once a year, a bunch of guys whose names inspire you to think “oh, he’s not bad” nonetheless get non-tendered because their performance doesn’t measure up to their projected salary. This year, the non-tender group was larger than I’m used to, so I think it merits a recap.
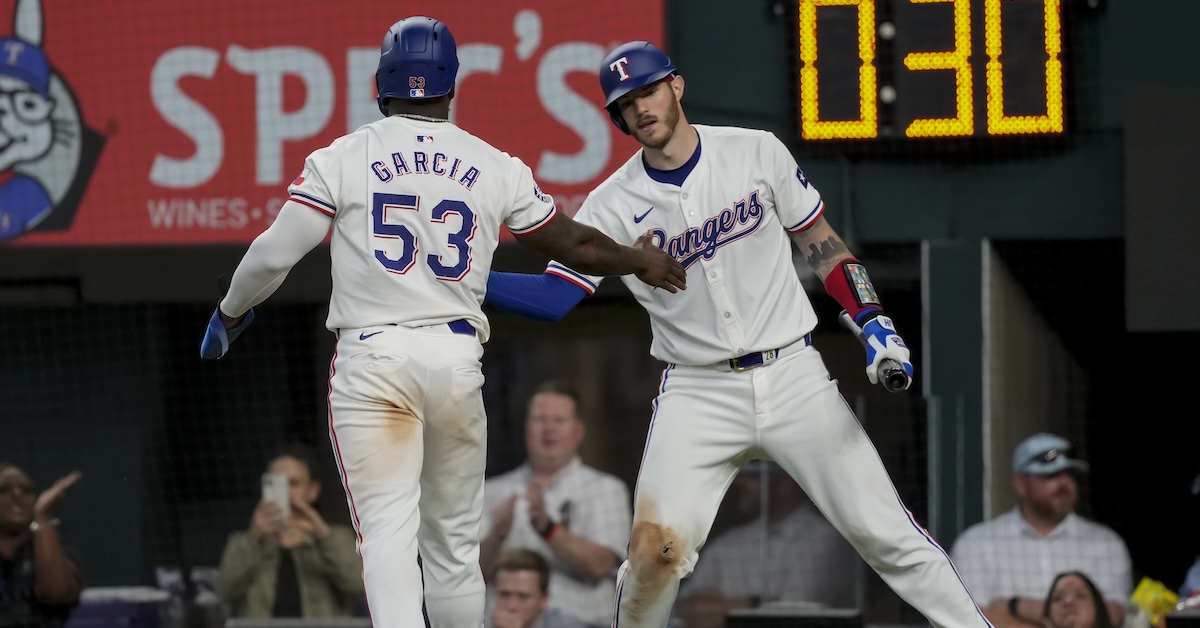
One classic archetype of the players who get non-tendered is the older breakout who then regresses toward the mean in subsequent years. An example: Adolis García, probably the most famous player in this group, burst onto the scene as a 28-year-old rookie in 2021, piling up 10.6 WAR in his first three full seasons. He starred on the 2023 World Series champion Rangers, blasting eight home runs and a record 22 RBI, and taking home ALCS MVP honors.
The next two years weren’t so halcyon, with García posting an aggregate 89 wRC+ and 0.6 WAR. Heading into his age-33 season, it’s hard to expect a return to his peak form; our projection systems think he’s more of a fourth outfielder than an everyday starter these days. The problem, from Texas’ standpoint, is that García earned $9.25 million this season in his second year of arbitration. He stood to make at least that much in his last pass through arb. The Rangers quite reasonably looked around for alternatives. Several free agent corner outfielders with similar projections were available, and probably for less. And Texas likely went into the Friday deadline with some idea that the Marcus Semien/Brandon Nimmo salary swap was on horizon, which meant fewer outfield openings; given that backdrop, García’s non-tender isn’t a big surprise. Read the rest of this entry »
I was in Hawaii this past weekend, taking a nice vacation to wind down from the end of the baseball season, when I found myself thinking about intercept points. Weird? Overly baseball obsessed? Maybe. But in my defense, a kid at the pool kept swinging at a Wiffle ball almost hilariously late, spraying it “foul” every time. “Oh look, the next Luis Arraez,” I thought, before going back to my umbrella-adorned drink. But that stuck with me, and when I got home, a database query leapt out of my head fully formed, like Athena after Zeus’ headache.
Where is the optimal place to make contact with the ball? It depends on who’s swinging. Statcast measures every single swing’s contact point relative to a hitter’s center of mass, and that data clearly shows that there are many ways to succeed. That’s always stymied me as I’ve looked into swing path data. But that small child gave me an idea when he got off the best swing I’d seen all day, a Wiffle ball line drive that would have been a screamer down the left field foul line (he was batting lefty). Because his normal swing was so late, his best contact was ever so slightly less late. What if I bucketed hitters based on their own swings to look for swing timing clues?
I took every batter who produced 300 or more batted balls (foul balls or balls in play) in 2025. For each of those hitters, I took aggregate statistics for all of their results, then also split their batted balls into three groups: deepest contact point, middle contact point, and farthest forward contact point. You can think of it as late, on time, and early, adjusted for that player’s swing. The later you start your swing, the more you “let it travel,” the deeper your contact point relative to your center of mass. The earlier you start, the more you “get out in front,” the farther forward you make contact. Read the rest of this entry »
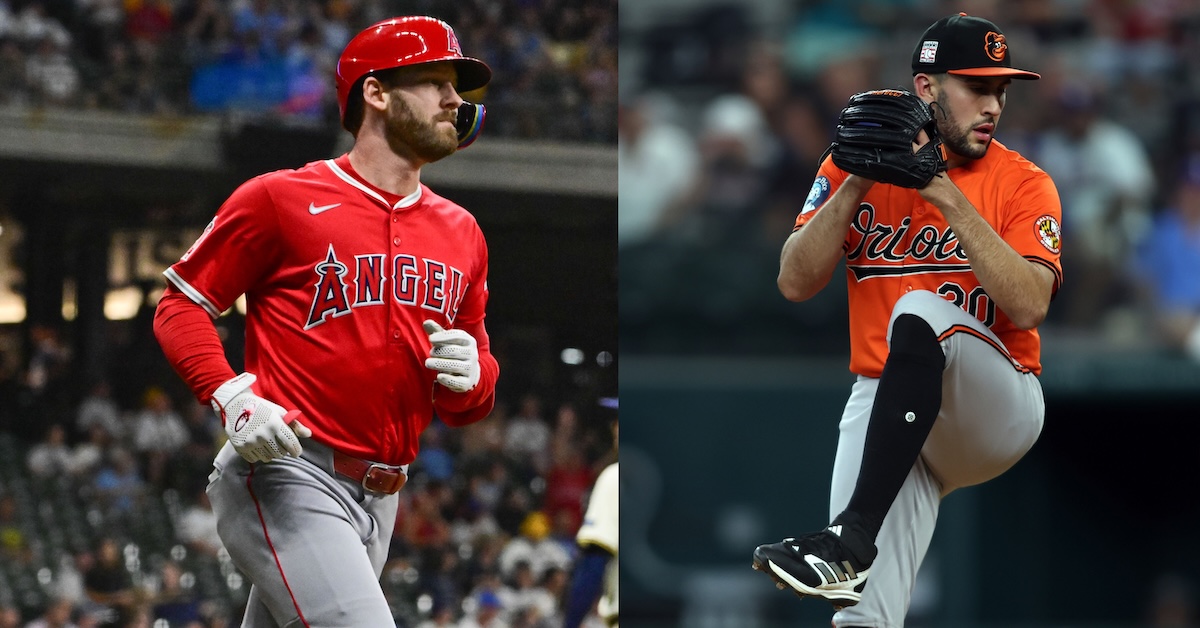
November is supposed to be a sleepy time of the offseason, with qualifying offers and 40-man roster shenanigans the main points of interest. This year has had a few fun surprises, though. First, Josh Naylor returned to the Mariners on a five-year deal, a surprise less in terms of destination than timing – these sorts of contracts normally wait until December. Now, we have a bona fide challenge trade: The Orioles are sending Grayson Rodriguez to the Angels in exchange for Taylor Ward.
Rodriguez, one of the top pitching prospects in baseball a few years ago, is also one of the toughest players in the majors to evaluate. The potential is there. He has multiple putaway secondaries, a lively fastball he can command to multiple parts of the zone, and he’s athletic enough that his command has trended upwards from fringe to average, with the kind of trajectory that makes you expect more to come. If you’re looking for an ace, you’re probably looking for someone whose skills roughly look like this.
On the other hand, unavailability is the worst ability, to twist the tired old saying ever so slightly. Rodriguez has struggled to stay on the field in his time in the majors, and that’s putting it lightly. He missed a good chunk of 2022, his last minor league season, with a lat strain. He then missed half of 2024 with two different shoulder injuries, while another lat strain and bone spurs in his elbow cost him the entirety of the 2025 season. At this point, three of his last four seasons have been severely curtailed by major injuries, including recurring shoulder problems. Read the rest of this entry »