Author Archive

Grading My Pre-Season Predictions

Before the season started, I made a series of bold-ish predictions about what would happen in baseball this year. I focused on things that were unlikely but possible, unexpected playoff teams or players that you’ve heard of but didn’t expect to be great. You can find those eight predictions here and here.

Today, I’m grading myself on these predictions. The season is still going, but we’re close to the end, and reading about pre-season speculation will soon take a deserved back seat to actual playoff baseball. I’m assigning each of the predictions a grade of a win, a push, or a loss. Fair warning: I’m grading myself on a curve. Coming close on a high-percentage prediction is clearly a loss. Getting something half right when it was a 40-to-1 shot? I’ll claim half credit whether I deserve it or not. That’s simply how this goes — doing your own grading comes with advantages. Let’s get to the predictions. Read the rest of this entry »


Ben Clemens FanGraphs Chat – 9/27/21

Read the rest of this entry »


Juan Soto, Your Favorite Hitter’s Favorite Hitter

There are tons of great hitters in the game today. Vladimir Guerrero Jr. is having the breakout season presaged by his pedigree and minor league success. Shohei Ohtani has 45 home runs and somehow also pitches. Fernando Tatis Jr. has a .618 slugging percentage and plays shortstop. I haven’t even mentioned the old guard of “best hitters” — Mookie Betts, Bryce Harper, and ringleader Mike Trout.

They’re all great — and they’re all worse than the best overall hitter on the planet, Juan Soto. Soto is comical. He put on a rookie performance for the ages, and has done nothing but improve since then. The Ted Williams comps he’s drawn aren’t given out lightly. All those wonderful hitters — and Wander Franco, and whoever else you want to name — are looking up at him.

Normally, I’d try to write a “here’s how he does it” article. That doesn’t work with Soto. How does he do it? My best guess is that he’s a time-traveling wizard from the future who set his sights on being the best hitter he could be. Since I’m not an expert in either time travel or wizardry, you’ll have to settle for three vignettes about Soto’s unparalleled excellence. Read the rest of this entry »


The Continued Decline of the Intentional Walk

I’m on record as being against intentional walks in most situations. That’s hardly some bold claim — over the last 15 years, they’re on a steady downward path as front offices and managers come to grips with the ills of extra baserunners. That’s not to say there’s never a good situation for a free pass, but those situations are few and far between.

Why pinpoint the last 15 years as the timeframe for this drop-off? In 1955, the first year where we have intentional walk totals, teams issued roughly 7.5 intentional walks per 1,000 plate appearances. In 2002, they issued 7.8 intentional walks per 1,000 PAs. Sure, there were peaks and valleys in between, but the data hardly indicated a trend. Take a look at the number of intentional walks issued per 1,000 plate appearances each year since 1955:

One note: I’ve excluded 2020 because of the universal DH, which created a meaningfully different backdrop for intentional walks — walking a decent hitter to face a pitcher is one of the best uses of the tactic.

I could end this article right there. That’s a convincing chart — the year with the least frequent intentional walks is 2021, and the year with the second-least is 2019. They’re roughly equivalent — four walks per 1,000 in 2019, 3.8 in ’21 — but even so, the writing is on the wall. Give the game 20 years, and we’ll surely see even fewer. Read the rest of this entry »


Mike Zunino Powers Up

If you want to figure out who the most fearsome power hitters in the majors are, you can consider any number of criteria. The longest home runs? The hardest-hit batted balls? Those both make some sense. The raw number of home runs? Sure, why not? Personally, I like to look at barrels per swing — how frequently a given batter converts a swing into loud contact.

That’s often what we’re asking when we think about sluggers. If you hit 30 bombs but do it by swinging frequently and putting the ball in the air with average raw, that’s not really what I’d consider a slugger. Similarly, if you almost never make contact, I don’t care too much what happens when you do. Turning swings into smashed baseballs? That’s pretty much what I want to see.

The statistic has the added bonus of mostly passing the sniff test. Vladimir Guerrero Jr. and Shohei Ohtani are in the top 10. So are Ronald Acuña Jr., Fernando Tatis Jr., Yordan Alvarez, and Max Muncy. Some of this year’s fun surprises — Byron Buxton and Joey Votto — are on there, too. Aaron Judge is 11th. Who tops the list? I’m glad you asked:

Barrel-per-Swing Leaders, 2021
Player Barrels Swings Barrels/Swing
Mike Zunino 47 657 7.2%
Ronald Acuña Jr. 44 620 7.1%
Max Muncy 58 844 6.9%
Fernando Tatis Jr. 67 987 6.8%
Shohei Ohtani 72 1107 6.5%
Vladimir Guerrero Jr. 70 1089 6.4%
Josh Donaldson 55 867 6.3%
Byron Buxton 24 395 6.1%
Joey Votto 54 907 6.0%
Yordan Alvarez 57 955 6.0%

That’s right: Mike Zunino is, by this metric at least, the best pure power hitter in baseball. He’s having a whale of a season, too, hitting .209/.296/.553, good for a strange-looking 131 wRC+. Though he’s barely above the Mendoza line, he’s clubbing enough homers (and it’s really just homers — he only has 10 doubles) and taking enough walks (9.4%) to make up for his ghastly 35.6% strikeout rate. Read the rest of this entry »


Liam Hendriks, Still Underrated

The White Sox have been so consistently the class of their division this year that it’s easy to lump their individual performances together. The offense? Scintillating. The starters? Carlos Rodón and Dylan Cease have been pleasant surprises that turned the rotation from good to one of the best in baseball. The bullpen? It’s been great, and almost forgettable in its greatness, with a top-10 ERA, a top-five FIP, and piles of strikeouts, grounders, and pop-ups.

You probably know that Liam Hendriks is the ringleader. He was a key offseason addition, coming off of a superb 2020 for Oakland. But you might not have noticed how good his three-year run has been. He has been one of the best handful of relievers in the game — again. He’s done it while throwing a ton of innings — again. Put it all together, and this recent run of excellence gives him a strong claim as one of the best relievers of the 21st century.

One way you could try to contextualize Hendriks’ string of excellence is by looking at three-season stretches by relievers. The king of this metric is, naturally enough, Eric Gagne. From 2002 to ’04, he was a machine, throwing 82.1 innings each year and delivering an aggregate 1.79 ERA, 1.57 FIP, and a whopping 11.7 WAR. That number hardly sounds like a reliever, but most relievers don’t deliver seasons like Gagne’s. He’s head and shoulders above the rest of the list:

Best 3-Season Reliever Stretches
Player Years 3-Season WAR 3-Season ERA 3-Season FIP
Eric Gagne 2002-2004 11.7 1.79 1.57
Joe Nathan 2004-2006 8.7 1.97 2.02
B.J. Ryan 2004-2006 8.6 2.04 2.11
Eric Gagne 2003-2005 8.5 1.77 1.52
Dellin Betances 2014-2016 8.3 1.93 1.97
Eric Gagne 2001-2003 8.2 1.71 1.66
Craig Kimbrel 2011-2013 8.1 1.48 1.43
Kenley Jansen 2015-2017 8.1 1.81 1.59
Aroldis Chapman 2014-2016 8 1.72 1.45
Robb Nen 2000-2002 8 2.28 2.21

Hendriks places a solid 23rd in all three-season totals this century. It’s hard to crack this list, though. For one thing, plenty of relievers double up by having two excellent seasons sandwiched by two okay seasons. Gagne isn’t the only name on there more than once; there are plenty of Kimbrels, Riveras, Chapmans, and the like in the top 25.
Read the rest of this entry »


Ben Clemens FanGraphs Chat — 9/20/21

Read the rest of this entry »


Choose Your Own Lineup Adventure: On-Base vs. Slugging

Let’s get right down to the question that all baseball analysis is asking at its core: Which of these two players would you rather have on your team, all else being equal?

Two Mystery Players
Player AVG OBP SLG wOBA
Player A .319 .387 .469 .371
Player B .267 .328 .556 .372

It’s a close one, right? That’s largely because I decreed it to be so; these aren’t real players, just stat lines I made up that have the same wOBA. Who would you rather have? They’re extremely different, of course; one gets a ton of value from walks and singles, with some doubles sprinkled in for good measure. You can surmise that the other gets a ton of value from home runs — look at that slugging percentage — but does worse elsewhere.

Oh yeah, a few other caveats. These are underlying talent levels; you might look at Player A and say that the BABIP can’t continue, or Player B and say the HR/FB rate can’t be real, but for our purposes, these are the lines they’ll put up over 1,000 PA, or 10,000, or 1,000,000. This is their real skill level. Given that, in most cases, it doesn’t matter much which one you choose, because they’re about the same. That’s the point of wOBA, after all.

That’s not a very interesting answer, so I decided to go deeper. I constructed a generic American League lineup. I removed intentional walks so that we’re comparing apples to apples. The result looks like this:

Generic Batting Order
Order BA OBP SLG wOBA
1 .261 .328 .423 .325
2 .256 .324 .423 .323
3 .255 .332 .458 .339
4 .255 .325 .453 .333
5 .248 .319 .431 .323
6 .240 .308 .408 .309
7 .233 .294 .399 .299
8 .227 .289 .371 .287
9 .228 .293 .360 .285

I threw that lineup into a lightly modified version of my lineup simulator, a short snippet of code that lets you put in a lineup (based on the probability of each outcome every time they bat) and get an estimate of how many runs they’d score per game. This one comes out to 4.53 runs per contest, which is close enough to the actual AL average for my purposes. Read the rest of this entry »


The Best Bunts of the Year, Part Two

Yesterday, I compiled the worst bunts of the season. They were bad in various ways — poor execution, great defense, a spot where failing was particularly painful — but they all cost their team dearly. Today, we’re looking at the opposite: the bunts that have added the most value.

As a refresher, this absolute gem was the best bunt of the first third of the season:

That perfect execution of an audacious plan is the platonic ideal of a bunt. If every successful bunt this season was like that, this would be a really fun series to write. A well-placed bunt is art; post five of those, and I could skate by with almost no commentary and let the GIFs do the talking.

Sadly, that’s not quite the case. There’s quite a bit of bad defense this time around — plenty of errors in the top five. That’s just how bunts work: they’re designed to force the defense to make a play, and while defenders are excellent, they’re not automatons. A sacrifice bunt that works as planned is never going to be one of the best plays a team can make — it’s designed to minimize variance, neither as bad as a strikeout nor as good as a single. The best bunts of the year by WPA, then, need to either score runs without surrendering outs or feature dubious fielding.

So yeah, some of these bunts aren’t perfectly placed gems that the defense has to eat. Some of them are just players making bad throws or bad decisions. As a palate cleanser, though, take a look at this beautiful honorable mention. Read the rest of this entry »

The Worst Bunts of the Year, Part Two

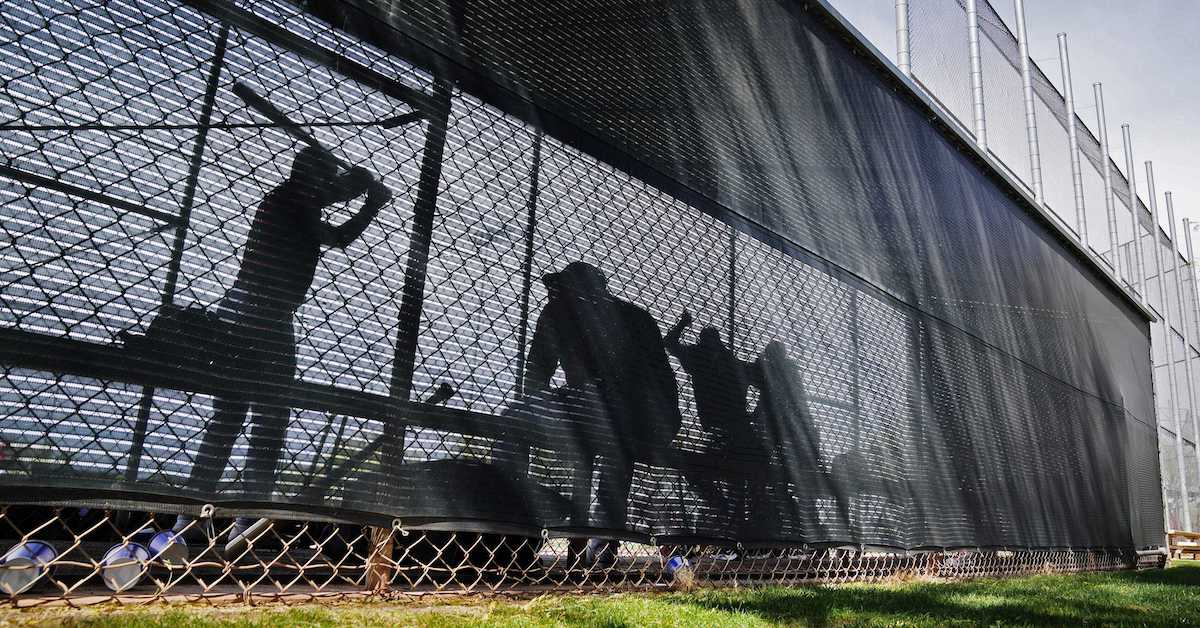
Earlier this year, I took a look at the worst (and best) bunts of the year. I couldn’t help myself. It’s simply too much fun to watch the best-laid bunting plans go down in flames, while a perfectly executed bunt is one of the most exciting plays in baseball.

Originally, I planned on waiting until the end of the season to update both lists. I forgot something, though: the end of the season is really busy and fun as it is. Playoff races, individual awards, wondering where the Mets went so wrong. There are already innumerable annual traditions to write about at season’s end. Instead, I decided to get a head start on these standout bunts, and circle back if one improbably beats them out for the worst (or best) bunt of the year.

As a reminder, here was the worst bunt of the first third of the season:

That one was really bad, both in execution and outcome. It cost the Cardinals dearly — more than a quarter of a win by WPA. It’s not easy to lose so much value in a single play on offense. With that in mind, I’ll be answering a bonus question for each bunt in this list: was it worse than José Rondón’s ill-fated attempt? Without further ado, let’s get bunting. Read the rest of this entry »