Daily Graphing – Orlando Hernandez
Pending commissioner approval, the White Sox will send Orlando “El Duque” Hernandez to the Diamondbacks along with Luis Vizcaino, and minor league outfielder Chris Young in exchange for Javier Vazquez and cash. A few weeks ago, I wrote about how Javier Vazquez was back on track to being a dominant pitcher and the only thing stopping him was his home run problem. Let's just say his new home, U.S. Cellular Field, isn't going to help him get his home runs under control.
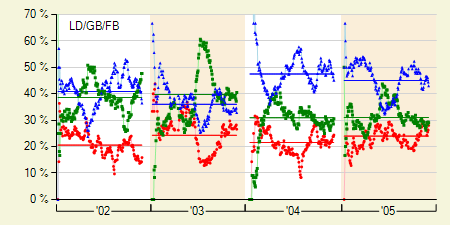
Orlando Hernandez on the other hand is coming of yet another injury plagued season. After missing the entire 2003 season with a torn rotator cuff, he had an excellent return in mid 2004 by going 8-2 with a 3.29 ERA. However, his 2005 season was an entirely different story where he went 9-9 with a 5.12 ERA, the worst of his career. Let's see if there are any signs that point to him improving in 2006.
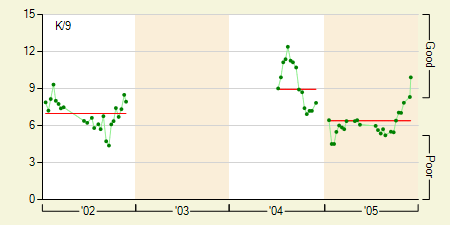
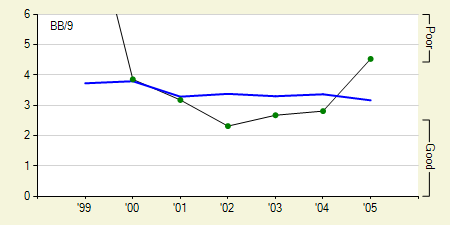
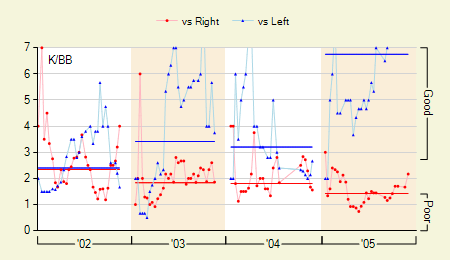
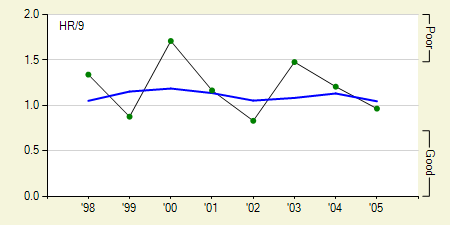
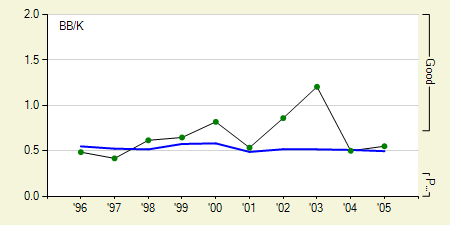
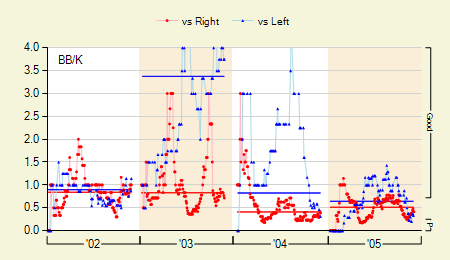
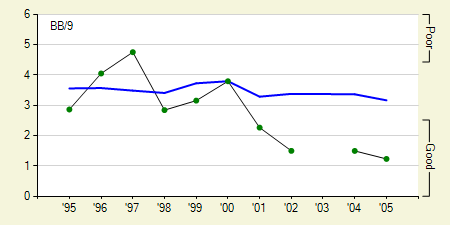
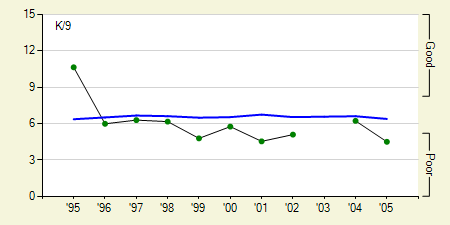
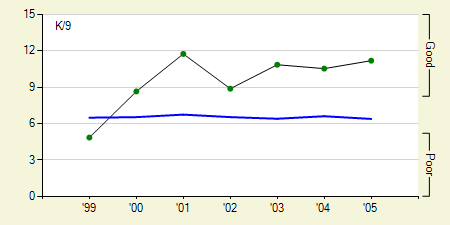
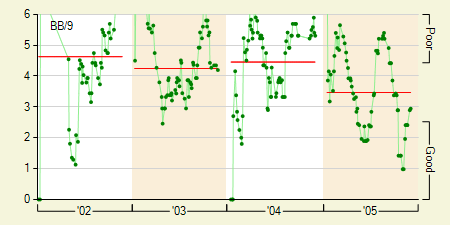
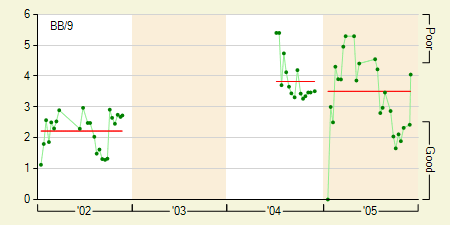
His strikeouts per 9 innings (K/9) were down to a career low 6.4. While that's not an awful K/9 by any means, the decline is somewhat worrisome. The good news is he showed significant improvement starting in mid August. In his last 8 appearances he had a K/9 of 8.2 in 33 innings of work. He also experienced a similar end of season decrease in his walks per 9 innings (BB/9). Over those same 8 outings he had a BB/9 of 2.6 opposed to 3.9 over his previous 16 outings.
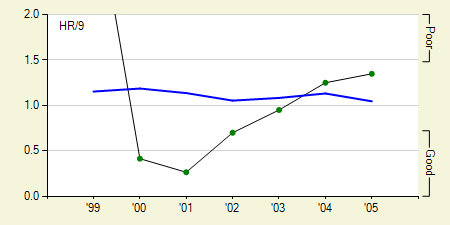
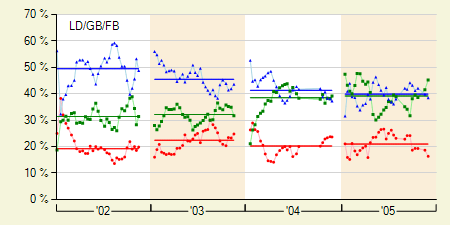
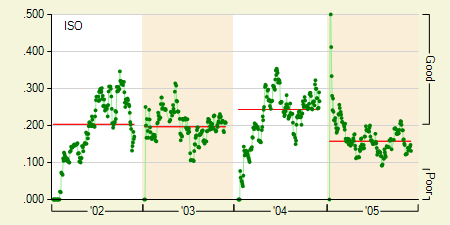
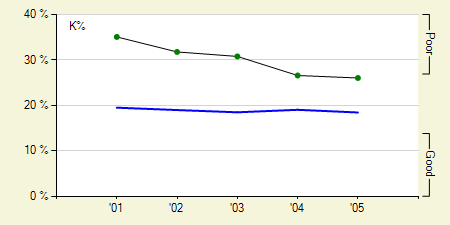
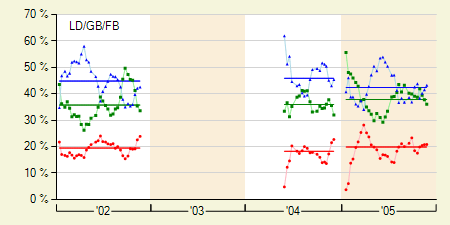
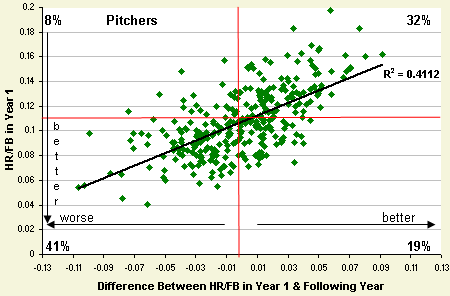
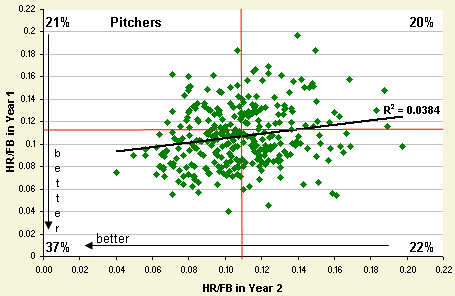
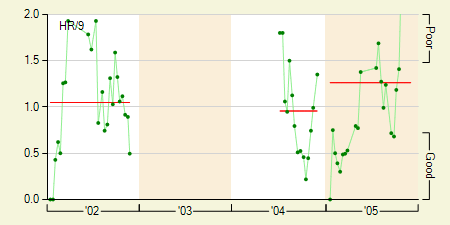
Unfortunately, neither his improvement in strikeouts or walks was reflected in his ERA because he allowed a whopping 9 home runs in those final 8 appearances. That made for a ridiculously high home run to fly ball percentage of 19%.
I seriously doubt Orlando Hernandez will do as poorly next year as he did in 2005. His improved strikeouts and walks at the end of the season suggest he still has what it takes to be a successful pitcher, but at age 36 you have to wonder how much gas he has left in the tank. If he's unable to stay healthy as a starter, the Diamondbacks might consider moving him to the bullpen where he'd have a lessened workload. He has the credentials to make an excellent setup man, or he could serve as a closer if needed.