US Flag Bunting
US Flag Bunting
US Flag Bunting
US Flag Bunting
US Flag Bunting
US Flag Bunting
US Flag Bunting
US Flag Bunting
US Flag Bunting
US Flag Bunting
US Flag Bunting
US Flag Bunting
US Flag Bunting
US Flag Bunting
US Flag Bunting
US Flag Bunting
US Flag Bunting
US Flag Bunting
US Flag Bunting
US Flag Bunting
US Flag Bunting
US Flag Bunting
US Flag Bunting
US Flag Bunting
US Flag Bunting
US Flag Bunting
US Flag Bunting
US Flag Bunting
US Flag Bunting
US Flag Bunting
US Flag Bunting
US Flag Bunting
US Flag Bunting
US Flag Bunting
US Flag Bunting
US Flag Bunting
US Flag Bunting
US Flag Bunting
US Flag Bunting
US Flag Bunting
US Flag Bunting
US Flag Bunting
US Flag Bunting
US Flag Bunting
US Flag Bunting
US Flag Bunting
US Flag Bunting
US Flag Bunting
US Flag Bunting
US Flag Bunting

Author Archive

Szymborski’s 2024 Booms and Busts: Pitchers

Troy Taormina-USA TODAY Sports

With the start of the season a little over two weeks away, it’s time for one of my most beloved/hated/dreaded annual traditions: making my picks for breakouts and busts. For those of you who haven’t read one of these pieces in the past, these are my picks for the players who are the most likely to change the general consensus about them over the course of the 2024 season. And since we’re talking about generally low-probability outcomes — this isn’t a list of players with better or worse projections than last year — there’s no exercise with more potential to make me look super smart… or dumb. For every Jordan Montgomery or Dylan Cease who makes the breakouts list, there’s a Yusei Kikuchi or Sam Howard pick that I definitely wish I could forget I made!

As usual, let’s start with a quick table of the triumphs and humiliations of last year’s picks.

Szymborski Breakout Pitchers – 2023
Pitcher K/9 BB/9 HR/9 FIP ERA ERA- WAR
Hunter Greene 12.2 3.9 1.5 4.25 4.82 105 2.0
Brandon Pfaadt 8.8 2.4 2.1 5.18 5.72 130 0.3
Graham Ashcraft 6.9 3.2 1.4 5.06 4.76 103 1.5
Tanner Scott 12.0 2.8 0.3 2.17 2.31 53 2.8
Josiah Gray 8.1 4.5 1.2 4.93 3.91 89 1.6
Roansy Contreras 7.2 4.2 1.4 5.19 6.59 148 0.1
Dustin May 6.4 3.0 0.2 3.23 2.63 62 1.2
Brayan Bello 7.6 2.6 1.4 4.54 4.24 93 1.6

Szymborski Bust Pitchers – 2023
Pitcher K/9 BB/9 HR/9 FIP ERA ERA- WAR
Sandy Alcantara 7.4 2.3 1.1 4.03 4.14 94 2.9
Robbie Ray 8.1 13.5 0.0 5.96 8.10 198 0.0
Corey Kluber 6.9 3.4 2.8 7.11 7.04 155 -0.8
Johnny Cueto 6.7 2.6 2.9 7.02 6.02 137 -0.7
Craig Kimbrel 12.3 3.7 1.3 3.81 3.26 74 1.1
Mike Clevinger 7.5 2.7 1.1 4.28 3.77 87 2.2
Chris Bassitt 8.4 2.7 1.3 4.28 3.60 85 2.6
Kyle Freeland 5.4 2.4 1.7 5.30 5.03 100 1.2

It wasn’t a great year for breakouts, as the only one I’d really call a true win was Tanner Scott, who was one of the elite relievers in baseball. While some of the pitchers that didn’t really break out had silver linings — Hunter Greene pitched better than his actual ERA and Brandon Pfaadt had a kick-ass postseason — I can’t say that our collective opinions of any of the other pitchers changed drastically in 2023. Except maybe Roansy Contreras, in the wrong direction. The busts went quite a bit better — for me, anyway — with arguably six of the eight considered disappointments for their teams in 2023. But it’s certainly less satisfying to have your pessimism be confirmed rather than your optimism.

The Breakouts

Edward Cabrera, Miami Marlins
The fact that Edward Cabrera walks a lot of batters is, of course, a Very Big Deal. But there’s so much talent bubbling underneath the surface that it’s hard to not feel that if something clicks, he could be one of the top 10 pitchers in the league. Despite his frequent command problems, Cabrera misses bats, and not just by blowing away batters with velocity. Sometimes, these inconsistent young pitchers with velocity have trouble getting strike three – Nathan Eovaldi was a classic example of this early in his career – or batters don’t actually chase them out of the strike zone. These aren’t Cabrera’s problems, and he isn’t getting hit hard, either. His biggest problem has been falling behind in the count; his first-strike percentages in the majors have been dismal, and that’s an important number in terms of predicting future walks. But at least both he and his team are quite aware of this. The fact that he’s missed a lot of time due to injuries could also explain his command issues. For all of this organization’s flaws in other areas, it has a strong record of developing pitchers with similar profiles to Cabrera. With more experience, he should be able to figure things out at the big league level.

Alas, Cabrera’s case is complicated by a shoulder impingement that was diagnosed recently following an MRI. It remains to be seen how much time he’ll miss, though it seems certain he’ll start the season the IL. I like him enough that I’m still keeping him on this list; hopefully, his prognosis won’t get worse upon further evaluation.

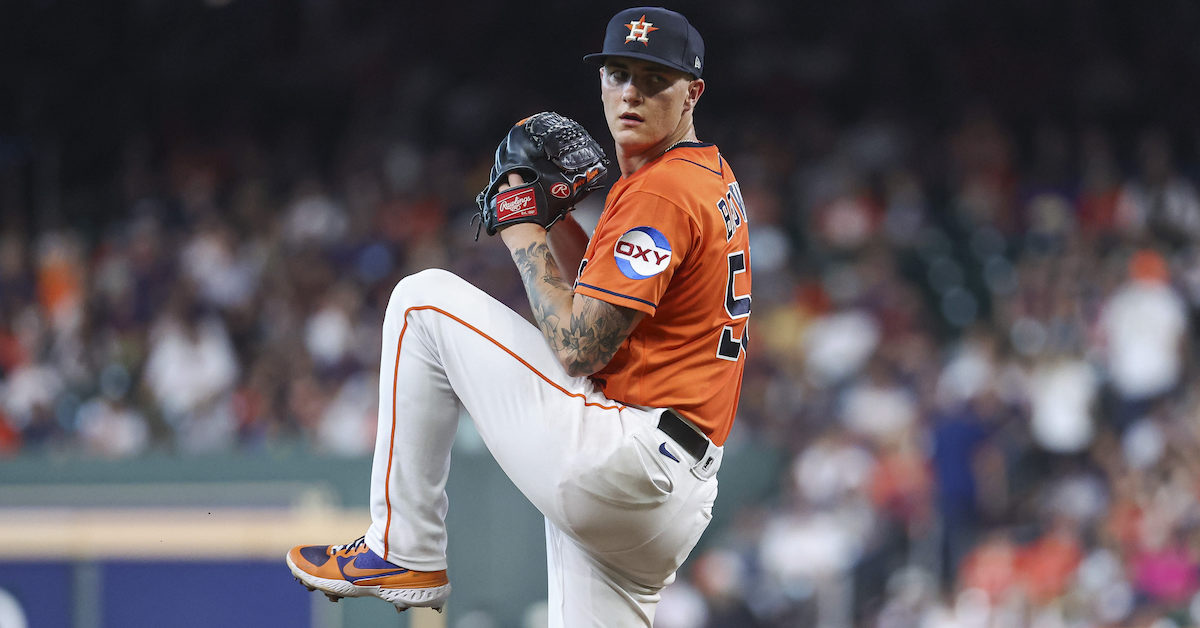
Griffin Canning, Los Angeles Angels
Aside from Shohei Ohtani and Mike Trout, the 2023 Angels were rarely watchable. So you’ll be forgiven if you didn’t realize that Griffin Canning quietly had a successful return last season from a stress fracture in his back that had kept him out of action for nearly two years. Not only was he a competent mid-rotation starter, he actually added a tick to his fastball and had a career best strikeout rate. As the season went on, hitters chased him out of the strike zone more frequently than in previous years, which is necessary for a pitcher like Canning, who will never dazzle anyone with pure velocity.

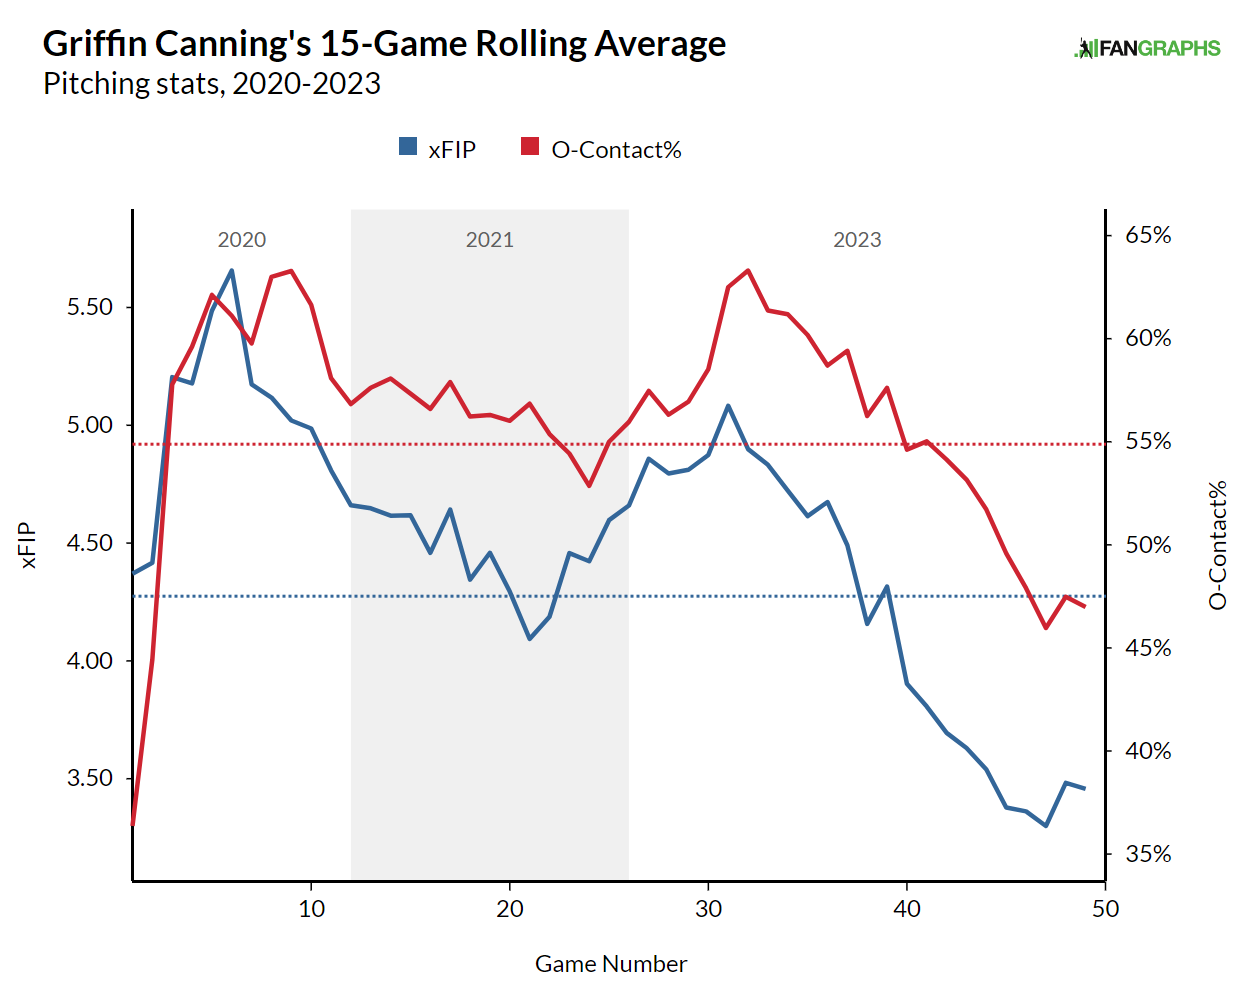
Canning still has a tendency to leave a pitch hanging in the wrong place – especially with his curve – but in his second full season back, I’m hopeful he can make progress there. I think there’s a real shot he ends the season considered a solid no. 2 starter instead of an afterthought.

Graham Ashcraft and Hunter Greene, Cincinnati Reds
Screw it, I’m taking them again! Since I’m sort of cheating by having the same reasoning two years in a row, I’ll make them split a single breakout pick. Both still have two wipeout pitches, but each still has an issue holding him back. Greene had trouble at times last season when he left his four-seamer over the middle of the plate; despite his heater’s 98.3 mph average velocity, nine of the 19 home runs he allowed came on four-seamers in the heart zone. Meanwhile, Ashcraft struggled to strike batters out. Both pitchers have made significant tweaks to their repertoires. Ashcraft added a changeup, and Greene started throwing a curveball and a splitter in the offseason. They can’t both not break out again, right? If it doesn’t work out, I may take them for a third year simply out of stubbornness.

Nick Pivetta, Boston Red Sox
No name at the top of 2023 stuff leaderboard may be more surprising than Nick Pivetta’s, especially if, like most people, you didn’t pay a lot of attention to the Red Sox in the second half of last season. Pivetta lost his starting job in mid-May, went to the bullpen and added a sweeper. The new pitch turned his season around and he returned to the rotation for good in September, making five starts to close the season. In those final five outings, he recorded 38 strikeouts and just five walks across 30 innings. Most encouragingly, Pivetta pitched seven scoreless innings in each of his final two starts. He had the fourth-biggest jump in Stuff+ from the first half to the second half. And you can see it in the results.

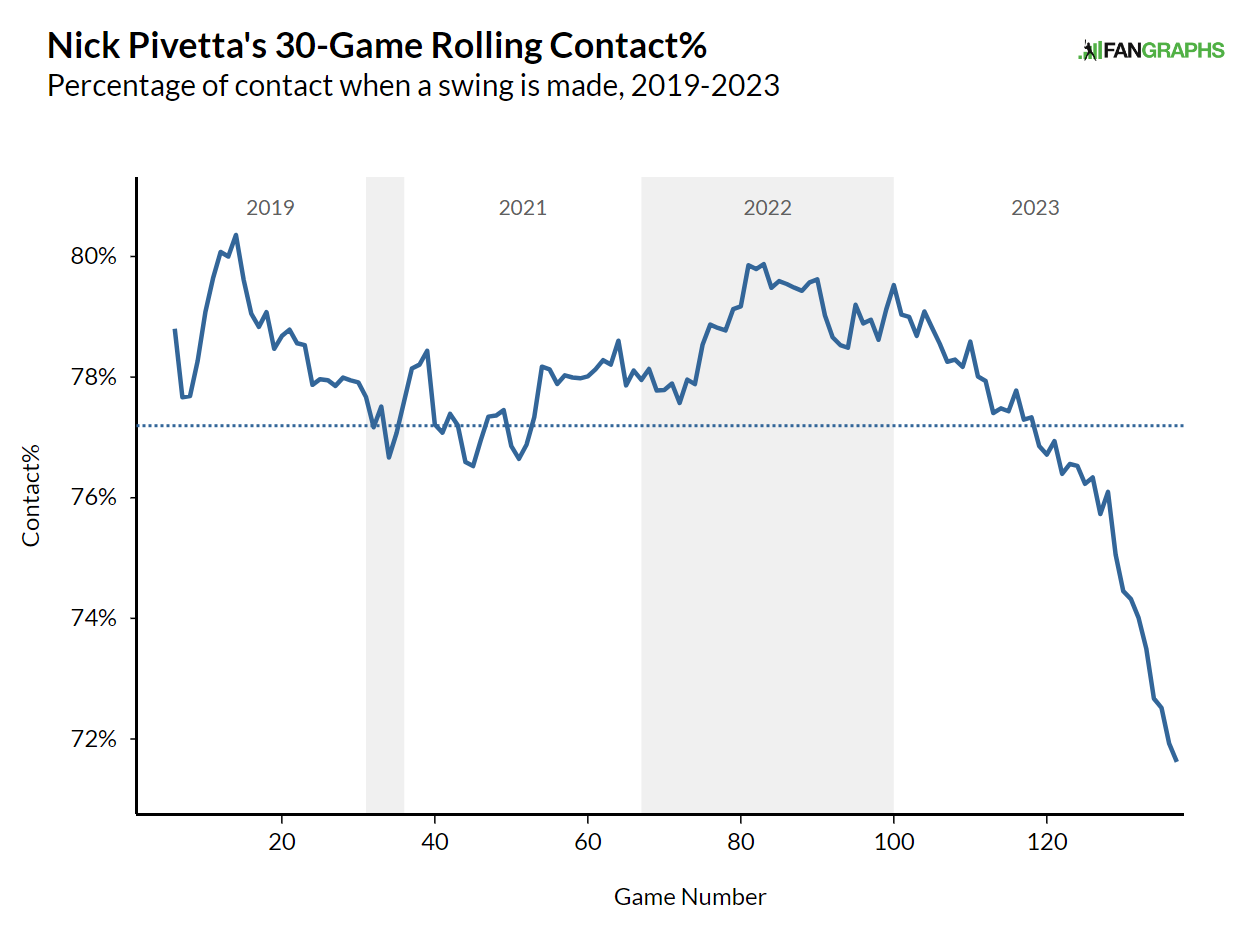
ZiPS is less optimistic about Pivetta than I am. I’m going to call ZiPS wrong on this one, and hope I won’t have to eat those words in six months.

Hunter Brown, Houston Astros
With his six-pitch repertoire and top-prospect status, Hunter Brown was an exciting addition to the Astros rotation last year. At times, he looked worthy of the hype — he struck out more than 10 batters per nine innings — but overall he was a bit of a disappointment, as he posted a 5.09 ERA in 31 outings (29 starts). That said, there are signs that he was a bit unlucky: Opponents had a high BABIP against him, and he allowed home runs at a much higher rate (1.50 HR/9) than he had at any point as a professional. Additionally, considering he threw nearly 30 more innings (155.2) than in any previous season (126.1), he may have just been gassed at the end of the year. Through his first 23 games (22 starts), which spanned 125.1 innings, he had a 4.16 ERA and 3.92 FIP. Over his final eight games (seven starts), he posted an abysmal 8.90 ERA and 6.26 FIP, with more than a third of the home runs he gave up (nine of 26) coming during that final stretch.

MacKenzie Gore, Washington Nationals
Of the three true outcomes, home runs have always had a weird relationship with pitchers. Strikeout and walk rates tend to be stable numbers, so it’s typically meaningful whenever they fluctuate drastically, whereas home run rates are extremely volatile. So volatile, in fact, that xFIP, a stat that has one of the more bizarre central conceits — “Let’s just assume that every pitcher has the same ability to prevent homers.” — actually has predictive value relative to stats that take a pitcher’s home run rate as gospel. As a result, “Let’s look for a pitcher who is pretty good but allows too many damn homers,” has proven to be a sneaky good way to predict breakouts, such as Corbin Burnes and Dodgers-era Andrew Heaney. MacKenzie Gore misses bat and he’s made great strides in improving his command, so I’m betting that he’ll wrangle the round-trippers too.

Shintaro Fujinami, New York Mets
OK, it’s admittedly scary to put Mets in the breakout category, especially a Met who had an ERA above seven his first season in the majors. Shintaro Fujinami’s seven starts last year were an unmitigated disaster, but he pitched a good deal better from the bullpen. Now, his 5.14 ERA as a reliever isn’t exactly cause to hang the Mission Accomplished banner, but the .209/.319/.351 line he allowed in relief comes out to a fairly respectable runs created ERA of 3.70. Given that, his velocity, and his history in Japan, I’m willing to give him a mulligan for 2023. A good reclamation project for the Mets.

Kyle Nelson, Arizona Diamondbacks
Have you seen his slider? The double whammy of a very high home run rate (12 in 56 innings) and a high BABIP (.324) served to keep Kyle Nelson’s ERA relatively high in what could very well have been his breakout season. And even then, all it took was a brutal September to dive bomb his seasonal numbers. If Nelson finishes with an ERA above four in 2024 over at least 30 innings, I’ll eat a full order of Cincinnati chili, and as those that are familiar with my can attest, that’s not something I relish doing. No, I’m not promising something crazy like eating my hat or a 1995 Ford Taurus.

The Busts

Gerrit Cole, New York Yankees
Let’s get two things out of the way first: This has nothing to do with the sudden MRI for his elbow, and this doesn’t mean I think Gerrit Cole will be a lousy pitcher. But there are some warning signs in his 2023 profile, despite his winning the AL Cy Young, and I think all the projection systems have been picking up on it. A sudden drop in strikeout percentage is usually a blaring klaxon, and it was supported by a similar decline in his plate discipline stats; the contact rate against Cole was his highest since he played for the Pirates. And whereas he had a couple weirdly high home run seasons while pitching well, that metric was oddly low in 2023 and it was not matched with changes in exit velocity or fly ball/groundball tendencies. In other words, his low home run rate hid several indicators of a looming decline, and we can’t count on that coverup to continue. I still think Cole is a top 10 pitcher, but it’s hardly a guarantee that he’ll be a five-win pitcher again this season.

Blake Snell, Someone Eventually
Hey, if I’m going to pick one Cy Young winner, why not go for the pair? Blake Snell will keep striking out tons of guys, but he gives up a lot of free bases, and one of the key factors that kept his ERA so low was some fairly extreme splits with runners on vs. bases empty, and that isn’t a long-term characteristic. Also, his .256 BABIP allowed won’t be easily repeated. Sidestepping the WAR vs. RA9-WAR fights after about five months of them, Snell’s not likely to be the best pitcher in the league in 2024. And it doesn’t appear that teams are jumping at the opportunity to pay him as if that were the case, either; I doubt his agent, Scott Boras, would be publicly expressing Snell’s willingness to sign a short-term contract otherwise. Snell’s a very good pitcher, but he’s just not this good.

Bryan Woo, Seattle Mariners
I’m a fan of Bryan Woo, and he certainly had a terrific rookie season for a pitcher with almost no experience in the high minors. He advanced so quickly that I didn’t even have a preseason projection for him last year! But despite the success and little grumbling from any of the projection systems, I’m not quite sure he’s a finished product yet. One worry is how fastball reliant he was. Lefties absolutely torched Woo in the majors last year, and it’s easier to simply dismiss that when it’s not from a pitcher without a killer offering to fight against the platoon disadvantage. At least he’s certainly aware that he needs to develop his changeup more. If Bryce Miller’s splitter works out, maybe Woo should consider cribbing his notes.

Matt Manning, Detroit Tigers
I buy the Tarik Skubal dominance, but with Matt Manning, not so much. Low strikeout pitchers can survive in the majors, but the ones who do are generally the ones who keep the ball down and don’t get hit very hard. Manning doesn’t really do either at this point. The numbers ZiPS uses aren’t the same as Statcast’s xStats, but Manning’s 5.00 zFIP was nearly as bleak as the xERA that Statcast produced (5.48). I’d say “when in doubt, learn a splitter,” but that’s mostly because of my long-term stanning of Kevin Gausman. I’m generally optimistic about the Tigers this year, but I think Manning’s ceiling looks pretty low from here.

Emilio Pagán, Cincinnati Reds
I’ve already talked about Emilio Pagán this offseason, but it wouldn’t show a lot of guts if I didn’t put the pitcher I deemed “my least favorite signing of the offseason” on my busts lists, now would it? If anything Pagán is the exact reverse of the Burnes-Heaney rule I talked about in the breakouts. It’s true that last year, he set career worst marks in contact rate against, average exit velocity, and strikeout rate, but he also had the lowest home run rate of his career, allowing five homers instead of his normal baker’s dozen or so. And he’s going to play his home games in a bandbox (the Great American Ballpark) for the first time ever. Pagán had the fifth-lowest batting average against in the majors on barrels/solid contact hits last year, and compared to the four pitchers ahead of him (Alexis Díaz, Will Vest, Trevor May, and Devin Williams), Pagán allowed those types of contact at nearly twice the rate. As a whole big leaguers batted .614 on barrels and solid contact hits in 2023. Pagán is likable and generally popular with fans, and I’m certainly not rooting against him, but he has a history of being worse than Bill Murray at stopping gophers.


Dan Szymborski FanGraphs Chat – 3/7/24

12:00
Avatar Dan Szymborski: Ojn time!

12:00
Avatar Dan Szymborski: On time!

12:01
the person who asks the lunch question: what’s for lunch?

12:01
Avatar Dan Szymborski: Nothing as last Thursday was an eating day

12:01
Avatar Dan Szymborski: Well, I had a pickle, but that doesn’t count because pickles are like 5 calories

12:02
GoBirds: In his prospects chat Eric referred to you as Danny.  Are you a Danny?  Should we call you Danny?  Do we need to establish greater social connection first?  Bring you chili or a cat?  Danny Z sounds like you could be cool, maybe a DJ or something.

Read the rest of this entry »


FanGraphs Spotlight: Reduce Data Headaches with the Magic of Custom Reports and Leaderboards

As David Appelman mentioned in yesterday’s State of the Union, over the next month we’re going to be highlighting some of FanGraphs’ features, sometimes off the beaten path, that can help you have a more productive, entertaining visit to our fair website. Today, I want to highlight some of our custom data options.

There are lots of ways to use FanGraphs, but as an individual of rather numerate inclination, I tend to get a lot of data from the site. I did that back when I was blogging at Baseball Think Factory and writing for ESPN, and I certainly haven’t curtailed that impulse as an employee of FanGraphs. Quite often, it’s simply easier for me to get things directly from the site than to go through my massive hoard of invariably unhelpfully named spreadsheets and databases. And one thing that I use a lot is the custom reports feature. We have so much data all over the site that it’s no simple matter to just get one massive export to rule them all, and in the Dark Mode, bind them. Read the rest of this entry »


Big Wheel Keeps on Turning in Philadelphia

Mark J. Rebilas-USA TODAY Sports

It’s been a while since the Phillies have had to worry about the front of their starting rotation, which over the past four seasons has been anchored by co-aces Zack Wheeler and Aaron Nola, though last year it was uncertain how much longer that stability would continue: Nola became a free agent at the end of last season and Wheeler’s contract was set to expire after the 2024 campaign.

But Philadelphia acted swiftly to keep both pitchers around. After re-signing Nola before Thanksgiving, the Phillies announced on Monday that they had extended Wheeler through the 2027 season. The three-year deal is reportedly worth $126 million, and in terms of its $42 million average annual value, it is the largest extension in baseball history.

Wheeler, who turns 34 in May, has been one of the best starting pitchers in baseball since he joined the Phillies in December 2019 on a five-year, $118 million contract. Over the last four seasons, he leads the majors with 19.3 WAR. If RA9-WAR is more your style, Wheeler has the second highest mark in that span despite pitching in front of what often has been a lackluster Phillies defense behind him. He also ranks fourth among qualified starters in FIP (2.90) and innings (629.1), and 11th in ERA (3.09). Last year, he made 32 starts, allowing a 3.61 ERA and 3.15 FIP over 192 innings, enough for a spicy 5.9 WAR.

Top Starting Pitchers, 2020-2023
Name IP ERA FIP WAR RA9-WAR
Zack Wheeler 629.3 3.06 2.90 19.3 18.1
Corbin Burnes 622.3 2.86 2.84 17.9 18.8
Kevin Gausman 611.3 3.15 2.82 17.3 14.6
Aaron Nola 650.7 4.00 3.30 16.6 11.5
Gerrit Cole 664.0 3.08 3.27 15.1 17.3
Max Scherzer 544.7 2.94 3.32 13.8 16.6
Sandy Alcantara 661.0 3.13 3.46 13.8 16.6
Logan Webb 611.0 3.28 3.10 13.8 13.2
Luis Castillo 605.0 3.44 3.47 13.4 12.7
Shane Bieber 502.0 2.98 3.03 12.5 14.1
Framber Valdez 604.7 3.19 3.39 12.5 14.6
Dylan Cease 585.0 3.58 3.70 12.3 11.5
Yu Darvish 573.3 3.63 3.51 12.3 12.5
Max Fried 484.7 2.66 3.03 12.1 16.3
Zac Gallen 587.3 3.26 3.45 12.1 15.6
Sonny Gray 495.0 3.35 3.31 11.8 12.4
Brandon Woodruff 473.3 2.76 3.13 11.8 15.3
Pablo López 534.0 3.57 3.43 11.3 11.7
Jacob deGrom 254.7 2.12 1.77 11.2 10.0
Jordan Montgomery 568.3 3.61 3.64 11.1 11.2

It’s hard to overstate the Wheeler’s importance to the Phillies. When he arrived, Philadelphia was better than it had been during its first five years of rebuilding, when it posted a .427 winning percentage from 2013–17, but it was still barely a .500 club. The Phillies remained stuck in neutral for Wheeler’s first two years, but their rotation improved immediately; after ranking 23rd in the majors in starting pitching WAR in 2019, Philadelphia ranked third in ’20 and fourth in ’21, a year in which Wheeler finished second in the NL Cy Young voting.

The Phillies finally broke through in 2022 and made up for lost time. That year, they won the NL pennant and came within two games of winning the World Series, and they were one win away from making a second consecutive World Series appearance last year. Wheeler has been excellent in the playoffs, too: He has a 2.42 ERA and 2.72 FIP over 11 postseason games (10 starts).

Simply, between his regular season and postseason dominance, the Phillies could not afford to risk losing Wheeler in free agency, even if that meant giving him the most lucrative per-year extension ever.

That said, ZiPS expects Wheeler to decline over the next few years, though that is more based on the inherent health risks that come with a pitcher in his mid-30s, rather than his overall ability. The computer would want to pay him about $30 million per season, but this organization, with its talented but aging core, is firmly in win-now mode. The “Stupid Money” Phillies of all teams weren’t going to let a dollars per WAR figure prevent them from extending their best pitcher.

ZiPS Projection – Zack Wheeler
Year W L ERA G GS IP H ER HR BB SO ERA+ WAR
2024 11 7 3.61 29 29 172.0 155 69 16 48 172 121 4.5
2025 9 7 3.80 26 26 154.0 145 65 16 43 148 115 3.5
2026 8 7 4.06 24 24 144.0 143 65 16 43 133 107 2.9

Whether or not the Phillies win the World Series in the next several years, Wheeler and Nola will go down as one of the greatest pitching duos in team history, along with Curt Simmons and Robin Roberts, Steve Carlton and Larry Christenson, and Jim Bunning and Chris Short. Even if both head to different teams at the end of their new contracts, they still project to be in the top 10 of all-time Phillies pitchers.

ZiPS Projection – Phillies Starters
Pitcher Team WAR
Steve Carlton PHI 75.0
Robin Roberts PHI 62.6
Aaron Nola PHI 51.3
Grover Alexander PHI 50.8
Cole Hamels PHI 40.5
Curt Schilling PHI 38.6
Curt Simmons PHI 33.5
Jim Bunning PHI 31.2
Chris Short PHI 30.7
Zack Wheeler PHI 28.2
Eppa Rixey PHI 24.2
Larry Christenson PHI 22.2
Cliff Lee PHI 21.9
Tully Sparks PHI 20.6
Jimmy Ring PHI 20.4
Rick Wise PHI 19.4
Al Orth PHI 18.9
Charlie Ferguson PHI 18.4
Charlie Buffinton PHI 17.7
Jack Taylor PHI 16.9

At least to my eyes, there aren’t any red flags in Wheeler’s profile that the computer didn’t consider. His breakout seasons came with the Mets, but he didn’t become a true ace until he joined the Phillies. With New York, Wheeler relied on a sinker that threatened to take the hands off right-handed hitters, but he lacked the pinpoint command of the pitch that he has found in Philadelphia, where he has also added a sweeper that maddeningly looks a lot like that sinker as it approaches the plate — until it breaks in the opposite direction. With the Phillies, he has become much better at landing his curve just below the bottom of the strike zone, which has helped him against lefties. Wheeler still throws pretty hard, but he also is much more than just a grip-and-rip hurler. That should help him survive and continue to thrive when his velocity dips as he ages.

Just in case you’re not convinced at this point about the consequences of the Phils not having Wheeler, I ran a quick sim of the 2024 season using the ZiPS projections. ZiPS currently projects the Phillies to have a 56.2% chance of going to the playoffs and 14.4% odds to win the NL East. In the simulations that the Phillies fail to get 20 innings from him (about 6.2% of sims), resulting in a lot more innings from Spencer Turnbull and Mick Abel, the Phillies only made the playoffs 37.1% of the time, and their probability to win the division chopped nearly in half, to 7.6%.

With only Matt Strahm and Jeff Hoffman eligible for free agency after 2024, the front office can start addressing their next challenge, putting together enough young talent to transition the franchise to its next core of players without having to endure another interregnum of rebuilding. But, like the threat of a headache after a night of drinking, that’s a tomorrow problem. For today, keeping Wheeler in town keeps the party going.


Dan Szymborski FanGraphs Chat – 2/29/24

12:07
Avatar Dan Szymborski: Ack, I’m here!

12:07
Avatar Dan Szymborski: Got lost fuming on Twitter

12:08
Placido Polanco fan club president: Just read Ben Clemens’ article about team depth. Don’t the ZiPS projected standings account for depth? Does ZiPS handle depth differently than the way proposed in Ben’s article?

12:08
Avatar Dan Szymborski: Sort of. ZiPS always has a generalized model that varies the playing time availability of top players so sometimes those Plan Bs or Cs or Ds get a lot more playing time than you expect

12:09
Avatar Dan Szymborski: For example, in that one run in the AL projections that I alluded to for the O’s, the O’s mostly ended up with David Banuelos and Michael Perez catching

12:09
Harry Lime: Can you suggest any articles that talk on late round players for deep drafts? thx

Read the rest of this entry »


ZiPS 2024 Top 100 Prospects

Allan Henry-USA TODAY Sports

For the ninth time (in 10 years — it’s a long story), we’ve reached the point in the offseason where I run down the ZiPS Top 100 prospects. For those wandering in who may hear “ZiPS” and think of the University of Akron or possibly the popular Cincinnati burger spot, ZiPS is a computer projection system that crunches a lot of data about players and attempts to peer through the fog that obscures the future. You can read more about the system here or in MLB.com’s executive summary.

ZiPS prospect projections aren’t an attempt to supplant scouting. Rather, they try to be a supplement to scout-generated lists. There’s a lot of uncertainty in lower-level minor league stats that isn’t present at the upper levels. As such, non-statistical information about players takes on added value. ZiPS doesn’t seek to be the one-ring-to-bind-them-all-unified-field-theory-giant-Katamari-Damacy-ball of prognostication; it aims to give the very best data-generated predictions possible, for people to use, ignore, mock, or worship according to their personal tastes and worldview. Read the rest of this entry »


The 2024 Pre-Spring Training ZiPS Projected Standings: National League

Jeff Curry-USA TODAY Sports

With the Dodgers reporting for pitchers and catchers today, this week seems like a good time to run ZiPS projections for all 30 teams. I covered the American League projections yesterday, so today is all about the National League. Let’s be clear up front: These are not the final preseason projections, but they’re the best expression of how ZiPS sees the NL right now. After all, several marquee free agents remain unsigned and rosters will surely change between now and the start of the 2024 season.

These standings are the result of a million simulations, not results obtained from binomial, or more competently, beta-binomial magic. The methodology isn’t identical to the one we use for our playoff odds, which were released Wednesday, meaning there naturally will be some notable differences in the results.

So how does ZiPS calculate the season? Stored within ZiPS are the first- through 99th-percentile projections for each player. I start by making a generalized depth chart, using our Depth Charts as a jumping off point. Since these are my curated projections, I make changes based on my personal feelings about who will receive playing time as filtered through arbitrary whimsy my logic and reasoning. ZiPS then generates a million versions of each team in Monte Carlo fashion (the computational algorithms, that is — though it would be fun to don a tuxedo and play chemin de fer like James Bond).

After that is done, ZiPS applies another set of algorithms with a generalized distribution of injury risk that changes the baseline plate appearances or innings pitched for each player. ZiPS then automatically and proportionally “fills in” playing time from the next players on the list to get to a full slate of PAs and innings.

The result is a million different rosters for each team and an associated winning percentage for each million of them. After applying the new strength of schedule calculations based on the other 29 teams, I end up with the standings for each of the million seasons. I promise, this is much less complex than it sounds.

The goal of ZiPS is to be less awful than any other way of predicting the future. The future is tantalizingly close but beyond our ken, and if anyone figures out how to deflect the astrophysicist Arthur Eddington’s arrow of time, it’s probably not going to be in the form of baseball projections. So we project probabilities, not certainties.

Over the last decade, ZiPS has averaged 19.6 correct teams when looking at Vegas preseason over/under lines. I’m always tinkering with methodology, but most of the low-hanging fruit in predicting how teams will perform has already been harvested. ZiPS’ misses for teams from year to year are uncorrelated, with an r-squared of one year’s miss to the next of 0.000562. In other words, none of the year-to-year misses for individual franchises has told us anything about future misses for those franchises.

2024 ZiPS Projected Median Standings – National League East
Team W L GB Pct Div% WC% Playoff% WS Win%
Atlanta Braves 95 67 .586 71.3% 21.4% 92.7% 17.4%
Philadelphia Phillies 85 77 10 .525 13.9% 41.2% 55.0% 3.6%
New York Mets 83 79 12 .512 8.9% 34.4% 43.3% 2.3%
Miami Marlins 81 81 14 .500 5.9% 28.4% 34.3% 1.5%
Washington Nationals 66 96 29 .407 0.0% 0.8% 0.9% 0.0%

That ZiPS likes the Atlanta Braves can hardly be considered a surprise considering they won 104 games last year, all projection systems everywhere love them, and I’ve been warning non-Braves fans that this would be the likely result all winter. What else is there to say? They’re a great team and there’s no scary number two in the division.

The Phillies project just slightly worse than last year, partially due to some aging risk in their prime offensive players, but more likely than not — really, unless they lose either Zack Wheeler or Aaron Nola to injury — they are going to be a playoff team. Catching the Braves isn’t a futile gesture — we’re talking a roughly one-in-seven chance — but they’ll need some help from Atlanta to win the division.

ZiPS doesn’t think the Mets did enough to patch up their rotation, but if their starting pitchers are better than expected, they should contend for a wild card. The Marlins project a little worse than New York, but they have a high variance in their projected outcomes; their pitching is elite, and that could be enough to make a pretty lousy offense almost unimportant — as was the case last year when they snagged a wild card berth.

Last year, the Nationals remained within bullhorn distance of .500 for much of the late summer, but they aren’t good enough to take a big step forward in 2024. Washington has the worst ZiPS projection for any National League team.

2024 ZiPS Projected Median Standings – National League Central
Team W L GB Pct Div% WC% Playoff% WS Win%
St. Louis Cardinals 83 79 .512 33.2% 15.7% 48.9% 2.9%
Chicago Cubs 81 81 2 .500 23.5% 15.2% 38.6% 1.9%
Milwaukee Brewers 80 82 3 .494 20.5% 14.3% 34.8% 1.5%
Cincinnati Reds 79 83 4 .488 16.0% 12.7% 28.8% 1.1%
Pittsburgh Pirates 75 87 8 .463 6.8% 7.1% 13.9% 0.3%

While it may seem like a relief that ZiPS is hedging enough here that I won’t get blamed too badly, no matter what happens, I also won’t get much credit! Fans have a tendency to overrate teams when things are going well and underrate teams when they’re not, and I think the Cardinals are a good example of this. The additions outside of Sonny Gray don’t send a tingle down your spine, but they did successfully patch up the rotation, which was a gaping wound for most of last season. Paul Goldschmidt, 36, and Nolan Arenado, who turns 33 in April, might not be as good as they once were, but if they age gradually instead of all at once, St. Louis should have the necessary depth in its lineup to score enough runs to compete in such a weak division. ZiPS isn’t alone here.

Shota Imanaga is my favorite signing this winter, but the Cubs are probably still one more starting pitcher away from being the favorite in this division. I’d certainly like more ambitious solutions at first base or catcher. In recent weeks, the Brewers patched some of their roster holes, signing first baseman Rhys Hoskins, starting pitcher Jakob Junis, and backup catcher and DH Gary Sánchez, but they also opened up a larger, newer one when they traded ace right-hander Corbin Burnes for infield prospect Joey Ortiz and left-hander DL Hall. Ortiz should get the chance to play every day, and Hall could be the latest dominant arm fermented by Milwaukee’s reliever brewery, but the Brewers will feel the absence of Burnes in 2024.

There’s a lot to like about the Reds’ future, but they haven’t done much this offseason to address their shortcomings. They have a logjam of guys who get a lot of their value playing third base, but instead of using some of those players as trade pieces to upgrade elsewhere, the Reds are going to shove them all into the lineup at various other positions, such as first base, DH and corner outfield. That isn’t a particularly lucrative plan. Cincinnati’s starting pitching could be very good, but there is a quite a bit of variance with this group due to consistency and/or injury concerns. A few bad “rolls” here and the rotation could become awful quickly.

The Pirates aren’t a depressing team and have some interesting players to watch, like shortstop Oneil Cruz, outfielder Bryan Reynolds, and third baseman Ke’Bryan Hayes. But they do have some holes to fill at other positions, and their starting pitching staff probably peaks at OK. ZiPS is a bigger fan of their bullpen.

2024 ZiPS Projected Median Standings – National League West
Team W L GB Pct Div% WC% Playoff% WS Win%
Los Angeles Dodgers 93 69 .574 66.2% 21.8% 88.1% 13.9%
Arizona Diamondbacks 84 78 9 .519 16.6% 34.8% 51.4% 3.3%
San Francisco Giants 82 80 11 .506 11.2% 29.9% 41.1% 2.1%
San Diego Padres 79 83 14 .488 5.9% 21.2% 27.1% 1.0%
Colorado Rockies 67 95 26 .414 0.1% 1.0% 1.1% 0.0%

The Dodgers are clearly the best team in the NL West, but they’re not invincible. The team’s pitching plan to have about 15 really talented pitchers and hope nine or so are healthy at any given time could work out tremendously – as it has in recent years – but there’s certainly some risk there. It’s hard to capture in preseason projections, but the Dodgers will likely be aggressive in making trades to remedy flaws that pop up with their pitching staff during the season.

Arizona is a good team, but as is the case with the Rangers, there’s a serious risk of overrating a team because of a World Series appearance. The Diamondbacks were an 84-win team last year and their outlook for 2024 would’ve been about the same if the Brewers had eliminated them in the first round rather than vice-versa. That said, Arizona made several moves this offseason and, as a result, appears to be a better team overall than it was last year (and they were a team I talked up quite a bit).

The Giants are underwhelming, in part because they’ve missed out on most of the big free agents they’ve gone after, but that doesn’t mean they are bad. They are solid enough that they could make a wild card push, and their floor is higher than many think. But they need some more production in their lineup, and behind Logan Webb, there are a lot of moving parts in the rotation.

Replacing Juan Soto is a nearly impossible task, so it’s unsurprising that the Padres are projected to take a step back this season. ZiPS projects both the offense and the pitching to rank somewhere in the 17 to 21 range, depending on playing time assumptions. And while San Diego has repaired its farm system quicker than many (including this writer) expected, that doesn’t exactly help much for 2024.

The Rockies aren’t going to the postseason and will probably be well out of the playoff picture by mid-April. But at least they didn’t do anything this offseason to make their long-term outlook worse, which is kind of an improvement. I’m mildly hopeful that they take the proper lesson from the Nolan Jones trade and make it an organizational priority to acquire every interesting 25-year-old from a team that is unsure what to do with him.

2024 ZiPS Projected Playoff Wins – National League
To Win 10th 20th 30th 40th 50th 60th 70th 80th 90th
NL East 88.7 91.2 93.0 94.6 96.2 97.8 99.5 101.7 104.7
NL Central 82.8 84.9 86.4 87.7 89.0 90.3 91.7 93.4 95.9
NL West 87.2 89.6 91.4 92.9 94.4 96.0 97.7 99.8 102.7
To Win 10th 20th 30th 40th 50th 60th 70th 80th 90th
NL Wild Card 1 86.1 87.6 88.7 89.7 90.7 91.6 92.7 94.0 95.9
NL Wild Card 2 83.3 84.6 85.6 86.5 87.3 88.1 89.0 90.0 91.5
NL Wild Card 3 81.2 82.5 83.4 84.2 84.9 85.7 86.5 87.4 88.7

And here we have the simple chart – which I’ve been including in all of these ZiPS projected standings, except the times I forget – to show what win totals likely will make the playoffs, rather than the highest median win projection.


Dan Szymborski FanGraphs Chat – 2/8/24

12:01
Avatar Dan Szymborski: If you can’t do the chat time, don’t do the chat crime

12:02
Avatar Dan Szymborski: I don’t know what that means either, like most things out of my mouth

12:03
the person who asks the lunch question: what’s for lunch?

12:03
Avatar Dan Szymborski: Nothing, this isn’t an eating Thursday

12:03
Andy Dufresne: Are you bullish on Correa exceeding his projections now that the foot (and septum) are fixed?

12:03
Avatar Dan Szymborski: Mildly so? I tend to be skeptical over “OK, this fixes the injury thing for good” things

Read the rest of this entry »


The 2024 Pre-Spring Training ZiPS Projected Standings: American League

Reggie Hildred-USA TODAY Sports

With the Dodgers reporting for pitchers and catchers on Friday, this week seems like a good time to do run ZiPS projections for all 30 teams. Let’s be clear up front: These are not the final preseason projections – and an ancient curse I saw suggests that if you quote them as such, ghosts will eat your lymphatic system – but they’re the best expression of how ZiPS sees the league right now. After all, several marquee free agents remain unsigned and rosters will surely change between now and the start of the 2024 season.

These standings are the result of a million simulations, not results obtained from binomial, or more competently, beta-binomial magic. The methodology isn’t identical to the one we use for our playoff odds, which were released yesterday, meaning there naturally will be some notable differences in the results.

So how does ZiPS calculate the season? Stored within ZiPS are the first- through 99th-percentile projections for each player. I start by making a generalized depth chart, using our Depth Charts as a jumping off point. Since these are my curated projections, I make changes based on my personal feelings about who will receive playing time as filtered through arbitrary whimsy my logic and reasoning. ZiPS then generates a million versions of each team in Monte Carlo fashion (the computational algorithms, that is — no one is dressing up in a tuxedo and playing chemin de fer like James Bond).

After that is done, ZiPS applies another set of algorithms with a generalized distribution of injury risk that changes the baseline plate appearances or innings pitched for each player. ZiPS then automatically and proportionally “fills in” playing time from the next players on the list to get to a full slate of PAs and innings.

The result is a million different rosters for each team and an associated winning percentage for each million of them. After applying the new strength of schedule calculations based on the other 29 teams, I end up with the standings for each of the million seasons. I promise, this is much less complex than it sounds.

The goal of ZiPS is to be less awful than any other way of predicting the future. The future is tantalizingly close but beyond our ken, and if anyone figures out how to deflect the astrophysicist Arthur Eddington’s arrow of time, it’s probably not going to be in the form of baseball projections. So we project probabilities, not certainties.

Over the last decade, ZiPS has averaged 19.6 correct teams when looking at Vegas preseason over/under lines. I’m always tinkering with methodology, but most of the low-hanging fruit in predicting how teams will perform has already been harvested. ZiPS’ misses for teams from year to year are uncorrelated, with an r-squared of one year’s miss to the next of 0.000562. In other words, none year-to-year misses for individual franchises has told us anything about future misses for those franchises.

2024 ZiPS Projected Median Standings – American League East
Team W L GB Pct Div% WC% Playoff% WS Win%
Baltimore Orioles 90 72 .556 36.4% 38.5% 74.9% 8.4%
New York Yankees 88 74 2 .543 25.5% 40.0% 65.6% 5.9%
Toronto Blue Jays 88 74 2 .543 24.5% 39.1% 63.6% 5.6%
Tampa Bay Rays 83 79 7 .512 9.7% 29.9% 39.5% 2.1%
Boston Red Sox 79 83 11 .488 3.9% 18.1% 22.0% 0.8%

I’m from Baltimore, but I would hope last year’s projection miss would disavow anyone of the notion that I weight these team standings toward my personal preferences. The Orioles – and last year’s Orioles – do a bit better in my methodology than others, I suspect because of the weight I deal with depth. In those seasons in which they lose players, especially offensive ones, the team’s depth keeps the falloff from being too dire. Even in simulation no. 452,331, in which the O’s lose both Gunnar Henderson and Adley Rutschmann to season-ending injuries before the first game, the team still finished 84-78!

The Yankees have significant downside given how much of their punch is tied up in a handful of players, but the reports of their death are quite premature. Juan Soto will provide a huge offensive boost this year, even if they don’t re-sign him after the season. They also added two other outfielders, Alex Verdugo and Trent Grisham, who are better than everybody they ran out there last year, with the exception of Aaron Judge.

ZiPS likes Toronto’s rotation and expects the return of Kevin Kiermaier to help, but without Matt Chapman, it sees third base as a major downgrade from last year. The Rays almost always get the most out of their depth, but ZiPS isn’t sure how much production they will get from their DH spot or how they will cobble together their rotation without Tyler Glasnow.

The Red Sox aren’t a dreadful team, but they’re merely OK in a division that has four good-to-great teams. That being said, they’re just good enough that they still have slightly better than a one-in-five chance of making the playoffs.

2024 ZiPS Projected Median Standings – American League Central
Team W L GB Pct Div% WC% Playoff% WS Win%
Cleveland Guardians 85 77 .525 42.4% 13.6% 56.0% 3.9%
Minnesota Twins 85 77 .525 42.1% 13.6% 55.7% 3.8%
Detroit Tigers 77 85 8 .475 10.3% 7.3% 17.7% 0.5%
Kansas City Royals 74 88 11 .457 4.7% 3.9% 8.6% 0.2%
Chicago White Sox 66 96 19 .407 0.4% 0.4% 0.7% 0.0%

ZiPS projects Cleveland to be relatively even with Minnesota, in large part because it likes the rotation trio of Shane Bieber, Triston McKenzie, and Tanner Bibee more than other projection systems do. ZiPS doesn’t see the Guardians as significantly below average at any position — Andrés Giménez remains a ZiPS favorite — and it thinks their bullpen is underrated. The Twins won the division fairly comfortably last year, but remember, they won only 87 games and just lost the AL Cy Young runner-up, Sonny Gray, in free agency. The Jorge Polanco trade came from a surplus of infield talent, but the additions of Anthony DeSclafani and Justin Topa won’t compensate for Gray’s loss to the rotation. If you like Carlos Santana, the team’s “big” offseason signing, I’d recommend you not look at the projection for him.

The projections still see more upside for Detroit’s pitching than its hitting, though after Spencer Torkelson’s surge last summer, ZiPS does expect him to keep improving in his third big league season. The Tigers are good enough that they can make a serious run at .500, but they’ll need some good fortune to get enough offense.

The Royals get credit for being active in free agency this offseason, signing veteran starting pitchers Seth Lugo and Michael Wacha, reliever Will Smith, slugger Hunter Renfroe, and utility man Adam Frazier, among other players. That said, those are the types of moves a team makes when it already has a strong core in place and is ready to contend, and, at least as ZiPS sees it, the Royals aren’t quite there yet. That’s not the worst thing in the world, considering they just signed shortstop Bobby Witt Jr. to the longest, most valuable extension in franchise history.

ZiPS has the White Sox as one of the worst teams in baseball, with little to look forward to outside of Dylan Cease, Luis Robert Jr., and the hope that Yoán Moncada and Eloy Jiménez get back on track. This organization is in a very dangerous position in that, like the Rockies a few years ago, I’m not sure it truly understands where it stands.

2024 ZiPS Projected Median Standings – American League West
Team W L GB Pct Div% WC% Playoff% WS Win%
Houston Astros 89 73 .549 43.3% 26.5% 69.8% 7.3%
Texas Rangers 86 76 3 .531 28.0% 28.4% 56.4% 4.5%
Seattle Mariners 85 77 4 .525 23.0% 27.4% 50.4% 3.5%
Los Angeles Angels 79 83 10 .488 5.6% 13.2% 18.9% 0.6%
Oakland A’s 63 99 26 .389 0.0% 0.1% 0.1% 0.0%

ZiPS still sees the Astros as the class of the AL West, thanks to the massive concentration of talent in the heart of their lineup. It wasn’t a busy winter for Houston, but the big addition, Josh Hader, gives a boost to the bullpen. The Astros, though, are not unstoppable. They have a lot of viable arms in the rotation, but the upside isn’t what it was three or four years ago, even if Justin Verlander has another strong season left in his arm.

The Rangers are a well-built team, but a lot of their offensive talent is on the wrong side of 30, and last year was probably the best case scenario for a few of their hitters. Their starting pitching is weaker now than it was at the end of 2023. ZiPS did account for the late-season returns of Max Scherzer, Jacob deGrom, and Tyler Mahle to reinforce the rotation, but all those games without them count, too, and as of this writing, Texas has not re-signed or replaced Jordan Montgomery.

ZiPS likes a lot of what the Mariners did this offseason. It projects Jorge Polanco as a moderate plus at second base and Luis Urías to be an effective replacement for Eugenio Suárez. Gregory Santos is in the top tier of projected relievers, though his projection will come down just a tad once a fixed error in the ZiPS database propagates to our player pages.

It will be nice for the Angels to get full seasons from Zach Neto and Nolan Schanuel, and the team has spent its offseason quietly beefing up its bullpen. But losing Shohei Ohtani is going to hurt.

I believe I have talked about all the major league teams in the AL West and surely did not forget anyone.

2024 ZiPS Projected Playoff Wins – American League
To Win 10th 20th 30th 40th 50th 60th 70th 80th 90th
AL East 89.2 91.4 93.0 94.4 95.7 97.1 98.5 100.2 102.7
AL Central 82.7 85.1 86.8 88.3 89.7 91.2 92.8 94.7 97.3
AL West 86.7 89.0 90.6 92.1 93.5 94.9 96.4 98.2 100.8
To Win 10th 20th 30th 40th 50th 60th 70th 80th 90th
AL Wild Card 1 87.3 88.8 89.9 90.9 91.8 92.8 93.9 95.1 97.0
AL Wild Card 2 84.6 86.0 86.9 87.8 88.6 89.5 90.3 91.4 92.9
AL Wild Card 3 82.5 83.8 84.7 85.5 86.2 87.0 87.8 88.8 90.2

One thing that drive me nuts about the discourse of the ZiPS projections is when someone looks at the top median projection and gets very angry with me that some division can be won with 89 or 90 wins. Since most of the tweets on this subject have an aspect for Mature Audiences Only, I’ve translated an example into something suitable for polite company.

Verily, Szymborski, thou art bereft of wit! How dare thee proclaim that a mere tally of 89 victories shall secure the Astros dominion over the AL Wast! Thy discourse betrays a lamentable ignorance, akin to that of a common dullard. Thy prognostications, I dare say, are as worthless as the dregs of a shire-reeve’s larder after Michaelmas!

Yes, the Astros have the best median projection in the AL West at 89 wins, but that doesn’t mean 89 wins will actually win the AL West. This last chart shows the probabilities that X number of wins will take the division or wild card spot in question. So, 89 wins might win the AL West, but only about 20% of the time. The Orioles project to 90 wins, but in the 36.4% of scenarios in which they won the AL East, they averaged 95.3 wins.


Royals Sign Bobby Witt Jr. To Franchise-Record Extension

Peter Aiken-USA TODAY Sports

The Kansas City Royals committed to the largest contract in franchise history on Monday, signing shortstop Bobby Witt Jr. to an 11-year extension worth $288.8 million. In addition to the guarantee, which runs through the 2034 season, there’s a three-year club option worth $89 million that would bring the total value of the deal to $377 million if exercised. Witt gets some options of his own, with four opt-out opportunities from 2030 to 2033 (the seventh, eighth, ninth, and 10th seasons of the deal). The 23-year-old Witt had a breakout 2023 season, hitting .276/.319/.495 with 30 homers and 49 stolen bases, good for 5.7 WAR, a mark that ranked third among shortstops behind only Corey Seager and Francisco Lindor.

Suffice it to say, I was floored when news of this deal hit Monday afternoon. Money may not go as far as it used to, but a nearly $300 million commitment is still a pretty large one, with fewer than 20 contracts in league history exceeding $250 million in guaranteed cash. A contract this big would still be a massive story in New York or Los Angeles; in the context of Kansas City baseball, the discovery of extraterrestrial life would probably get booted from the front page in favor of this deal. To say the Royals don’t typically enter into pacts like this would be an epic understatement. We’re talking about a franchise that had never given out even a $100 million contract, with the largest previous deal being Salvador Perez’s 2021 extension that guaranteed him $82 million over four years. Triple the size of Perez’s bag of cash and you still have enough left over to make a stack of hundred dollar bills about 140 feet high.

The Royals picked the right player to play Rich Uncle Pennybags with. Witt is the team’s best young player since Carlos Beltrán about 20 years ago. Back then, the Royals valued him so highly that after agreeing in principle to a three-year, $25 million contract, ownership decided to blow up the deal by trying to pull back a million dollars. A year later, Beltrán was traded in a three-way swap that netted the organization Mark Teahen, Mike Wood, and John Buck, who combined for about seven total WAR as Royals. Two decades later, Beltrán has a good shot at making the Hall of Fame — the biggest obstacle is his involvement in Houston’s trashcananigans — and if he gets a plaque, it may be with NY on the cap, not KC.

Witt isn’t some stathead favorite who snuck in a great season on the back of a spike in walks and crazy one-year defensive numbers (though we’ll get to his defense in a minute) — he was one of the top amateurs in the country, and as a pro prospect, he was one of those rare players who the scouts, the numbers crowd, and the computers all relished. He so electrified the atmosphere in spring training in 2021 that the Royals might have given serious thought to having him basically skip the whole upper minors.

While the Royals were probably right to develop Witt traditionally, assigning him to Double-A in 2021, they cleared the decks to get him a full-time spot in the lineup for 2022. Adalberto Mondesi’s presence resulted in Witt starting off at third base, but Mondesi’s ACL tear opened up the shortstop job, which Witt has mostly held since. A .254/.294/.428 line in his rookie campaign wasn’t phenom material, but as a 22-year-old shortstop, it was still enough to place him around average at the position, with a whole lot of unexplored ceiling remaining. Let’s crank up the time machine and jump back to his long-term ZiPS projections before last season:

ZiPS Projections – Bobby Witt Jr. (Pre-2023)
Year BA OBP SLG AB R H 2B 3B HR RBI BB SO SB OPS+ DR WAR
2023 .265 .313 .462 565 88 150 35 5 22 86 35 134 25 110 -6 2.6
2024 .269 .320 .470 583 94 157 37 4 24 91 39 131 24 114 -5 3.1
2025 .273 .325 .475 598 99 163 38 4 25 95 42 129 24 116 -5 3.4
2026 .276 .329 .482 608 103 168 39 4 26 97 44 127 22 120 -5 3.7
2027 .278 .332 .484 608 104 169 39 4 26 97 45 125 20 121 -5 3.9
2028 .277 .334 .480 602 104 167 38 3 26 95 47 122 18 121 -5 3.8
2029 .277 .333 .478 592 101 164 38 3 25 94 46 121 17 120 -5 3.6
2030 .277 .334 .477 577 98 160 37 3 24 91 45 118 15 120 -6 3.5
2031 .277 .333 .476 578 97 160 37 3 24 91 44 119 14 119 -7 3.3
2032 .276 .332 .473 558 93 154 35 3 23 86 43 116 13 118 -7 3.0
2033 .276 .331 .467 537 87 148 34 3 21 82 41 112 11 117 -8 2.7
2034 .274 .329 .460 511 81 140 32 3 19 76 38 108 9 114 -9 2.3

Assuming the reduced salary figures for his pre-free agency years, ZiPS would have offered 11 years and $282 million to cover Witt through the 2034 season, though without the opt-out years, which do add significant value for most players. And remember, that projection isn’t what the computer suggests knowing how last season went — this is before 2023.

While this projection did a decent job of pegging Witt’s 2023 offense (with a projected OPS+ of 114 vs. an actual OPS+ of 120 and a wRC+ of 115), the computer didn’t see his defensive improvements coming. Originally, it was up for debate whether Witt’s future in the majors would be at shortstop or third base; the Royals originally starting Mondesi at short over Witt wasn’t necessarily some bit of undue veteran deference. Per Statcast’s RAA, Witt improved by 17 runs at shortstop from 2022 to 2023, ranking as the top defensive shortstop in the American League last season. Even Sports Info Solutions’ Defensive Runs Saved, a relative skeptic on Witt, saw a 12-run improvement.

Defense is notoriously hard to measure, but Witt’s numbers improved both in terms of range and avoiding errors. The latter is a relatively small part of defense, but it’s also one that’s much easier to measure, and Witt netted six runs of his improvement just from avoiding errors, going from six non-throwing errors to only two in 2023 despite 50% more innings. Last August, Jake Mintz went into detail on Witt’s defensive instruction at shortstop:

For a crash course in rewiring his defensive approach, Witt’s personal hitting coach Jeremy Isenhower invited well-known private infield coach Nate Trosky out to his hitting facility in Tomball, Texas, for two days of intensive training with the young shortstop. In the nippy mid-December chill, Trosky, an eccentric, fast talking, sun-hat wearing, country-song singing, infield mental skills expert, ran Witt through nearly six straight hours of instruction.
[…]
A close review of Witt’s 2022 errors confirms this hypothesis. Most of his fielding mistakes appeared to stem from a hesitant first step that led to issues with Witt’s timing and rhythm toward the ball. But if Trosky made things incredibly complicated on purpose, Royals first-year infield coach José Alguacil has taken an opposite yet complementary approach.

Let’s spin up the computer one more time and get Witt’s current projection, through the team option years:

ZiPS Projections – Bobby Witt Jr.
Year BA OBP SLG AB R H 2B 3B HR RBI BB SO SB OPS+ DR WAR
2024 .275 .323 .481 615 97 169 35 7 26 97 41 127 35 119 1 4.1
2025 .279 .329 .488 613 100 171 35 6 27 98 43 122 32 122 1 4.3
2026 .279 .330 .485 612 101 171 35 5 27 98 44 119 30 122 1 4.3
2027 .280 .333 .487 610 102 171 35 5 27 98 46 116 28 123 1 4.4
2028 .281 .335 .484 609 103 171 35 4 27 97 47 115 25 123 1 4.5
2029 .280 .335 .478 607 102 170 34 4 26 95 48 113 23 122 1 4.2
2030 .279 .334 .475 591 98 165 33 4 25 92 46 110 21 121 0 4.0
2031 .279 .333 .476 569 93 159 32 4 24 88 44 107 18 121 -1 3.7
2032 .279 .333 .471 569 92 159 32 4 23 87 44 107 17 119 -2 3.5
2033 .277 .332 .464 541 86 150 30 4 21 81 42 103 15 117 -3 3.1
2034 .276 .330 .458 515 81 142 28 3 20 76 39 99 13 115 -3 2.7
2035 .273 .325 .450 484 73 132 26 3 18 69 36 94 10 112 -4 2.2
2036 .271 .323 .438 447 66 121 24 3 15 62 33 87 8 108 -5 1.6
2037 .268 .322 .431 406 58 109 21 3 13 55 30 80 7 106 -5 1.3

How good is this projection? ZiPS would happily throw another $100 million Witt’s way, meaning the Royals still have a lot of room for this deal to be absolutely fabulous from their point of view. Note that ZiPS isn’t even assuming Witt is a +10 defensive shortstop; 2023 was only enough for it to believe that he’s league average. If I tell ZiPS to assume he’s a -10 shortstop with the glove right now, it still thinks $240 million would be a fair deal. In other words, liking this contract from Kansas City’s perspective does not require you to abandon all skepticism about his defense.

Outside of the bottom line figure, it’s encouraging to see the Royals invest in a young star to this degree. It’s hard to remember now, but at one point, the Royals were one of baseball’s model franchises. Founded with the late Ewing Kauffman as the owner, the Royals managed to pass the .500 mark in just their third year of existence, and following their breakout 1975, they were one of the top teams in baseball for 15 years, a whole generation of baseball:

Franchise Wins, 1975-1989
Team W L WPct
Yankees 1323 1043 .559
Red Sox 1286 1083 .543
Royals 1286 1084 .543
Dodgers 1277 1099 .537
Orioles 1267 1096 .536
Reds 1261 1111 .532
Phillies 1245 1128 .525
Cardinals 1217 1152 .514
Tigers 1214 1156 .512
Astros 1207 1171 .508
Pirates 1198 1167 .507
Brewers 1193 1179 .503
Expos 1187 1184 .501
Angels 1180 1195 .497
Mets 1177 1192 .497
Athletics 1174 1201 .494
Giants 1162 1215 .489
Rangers 1139 1230 .481
Blue Jays 983 1064 .480
White Sox 1131 1233 .478
Twins 1133 1239 .478
Cubs 1125 1241 .475
Padres 1127 1249 .474
Indians 1091 1267 .463
Braves 1045 1319 .442
Mariners 860 1190 .420

Kauffman mostly kept Kansas City’s stars together and put the team’s cash back into the roster. From 1985 to 1994, the Royals were only out of the top 10 in payroll once, in 1992, and even led the league in 1990. But Kauffman passed away in 1993 and so did the team’s Golden Era. Outside of the Royals’ brief period of relevance in the mid-2010s, they spent so much time in the basement that someone should have checked them for a Vitamin D deficiency. The team’s success in 2014-2015 energized the locals for the first time in decades, but the organization showed little inclination to actually try and keep those fans, and as the team’s core aged and/or moved on, so did the KC faithful. Paid attendance in the championship 2015 season was over 33,000 per game. The Royals haven’t even done half that since 2019.

Does signing Bobby Witt Jr. bring back the Royals as a dynasty? Of course not — the team has still more holes than Clyde Barrow’s 1934 Ford DeLuxe Fordor. But Witt’s signing is a callback to a happier time, when Royal blue held more than just temporary apparel for superstars. Whether or not the Royals solve their other problems, for the next decade, shortstop probably won’t be one of them.