Author Archive

The Actually Official 2020 ZiPS Projected Standings

I’m a big liar, or at least I am thanks to Major League Baseball. Last week, after the longest offseason in modern baseball history, I posted the Final ZiPS 2020 Projected Standings. It turns out, however, that these weren’t quite as final as we hoped. Last Thursday, MLB took the step — unprecedented in major sports, at least in my memory banks — of changing the league’s playoff structure the day the season started. The already-bloated 10-team playoff format became an engorged 16-team one. In are four mediocre teams; out is most of the advantage division winners get for being the best in their divisions.

I’m still hopeful this is solely a 2020 issue; the agreement between MLB and the Players Association was only for this year. Baseball’s regular season is the most important in major team sports, after all. Plus, it’s in the interests of the players to avoid further decoupling championships from team quality, as that would inevitably create a further drag on salaries. Assuming 2021 reverts to normal, it still leaves the question of 2020 projections. After a three-day weekend immured in my Fortress of Statitude, I’ve reconfigured ZiPS for the umpteenth and hopefully last time, and present the final, actually official 2020 projected standings. All the commentary in my original article still stands, but now the numbers are quite different.

Warning: There are lots of charts coming.

Let’s start with new start-of-season projections. For these standings, ZiPS knows nothing about what has happened so far this season, whether it’s wins, losses, player stats, or injuries. Whatever it knew last Wednesday, it still knows.

2020 ZiPS Projected Standings
Team W L GB PCT Division Second Wild Card Playoffs WS Win
New York Yankees 37 23 .617 44.8% 28.8% 12.4% 86.0% 7.6%
Tampa Bay Rays 35 25 2 .583 34.8% 30.7% 14.6% 80.0% 6.2%
Boston Red Sox 30 30 7 .500 14.5% 23.7% 19.7% 57.8% 3.0%
Toronto Blue Jays 27 33 10 .450 5.6% 14.4% 17.4% 37.3% 1.4%
Baltimore Orioles 20 40 17 .333 0.4% 2.5% 5.1% 7.9% 0.2%
Team W L GB PCT Division Second Wild Card Playoffs WS Win
Minnesota Twins 35 25 .583 40.1% 26.8% 12.6% 79.5% 6.0%
Cleveland Indians 34 26 1 .567 32.1% 27.7% 14.0% 73.8% 5.0%
Chicago White Sox 31 29 4 .517 19.6% 24.7% 16.4% 60.7% 3.3%
Kansas City Royals 26 34 9 .433 5.9% 13.3% 14.6% 33.9% 1.2%
Detroit Tigers 23 37 12 .383 2.4% 7.4% 10.3% 20.1% 0.6%
Team W L GB PCT Division Second Wild Card Playoffs WS Win
Houston Astros 35 25 .583 43.9% 26.1% 11.2% 81.3% 6.4%
Oakland A’s 33 27 2 .550 30.4% 28.7% 13.1% 72.3% 4.7%
Los Angeles Angels 30 30 5 .500 15.8% 22.7% 15.7% 54.2% 2.6%
Texas Rangers 28 32 7 .467 8.4% 16.6% 15.0% 40.0% 1.6%
Seattle Mariners 22 38 13 .367 1.5% 5.8% 7.8% 15.2% 0.4%
Team W L GB PCT Division Second Wild Card Playoffs WS Win
Washington Nationals 34 26 .567 32.4% 25.6% 17.9% 75.9% 5.3%
Atlanta Braves 33 27 1 .550 34.6% 25.4% 17.8% 77.8% 5.6%
New York Mets 31 29 3 .517 18.7% 22.5% 16.2% 57.4% 3.2%
Philadelphia Phillies 28 32 6 .467 10.6% 17.2% 12.6% 40.5% 1.9%
Miami Marlins 25 35 9 .417 3.7% 9.3% 5.7% 18.6% 0.7%
Team W L GB PCT Division Second Wild Card Playoffs WS Win
Chicago Cubs 32 28 .533 27.4% 22.7% 14.5% 64.6% 4.0%
Milwaukee Brewers 31 29 1 .517 22.7% 22.0% 13.8% 58.5% 3.4%
St. Louis Cardinals 31 29 1 .517 22.1% 21.6% 13.9% 57.6% 3.3%
Cincinnati Reds 31 29 1 .517 21.5% 21.6% 13.7% 56.8% 3.2%
Pittsburgh Pirates 26 34 6 .433 6.3% 12.2% 6.9% 25.3% 1.0%
Team W L GB PCT Division Second Wild Card Playoffs WS Win
Los Angeles Dodgers 38 22 .633 56.6% 23.2% 15.3% 95.2% 9.5%
San Diego Padres 32 28 6 .533 22.5% 29.7% 20.4% 72.6% 4.3%
Arizona Diamondbacks 30 30 8 .500 12.8% 23.2% 16.3% 52.3% 2.6%
Colorado Rockies 26 34 12 .433 4.9% 13.5% 8.8% 27.2% 1.1%
San Francisco Giants 26 34 12 .433 3.2% 10.5% 6.2% 19.8% 0.7%

Read the rest of this entry »


The Official ZiPS 2020 Projected Standings

We made it! It took a four-month journey through a still-raging pandemic and some still-burning baseball economic issues, but Opening Day of the weirdest season we’re likely to see in our lifetimes is here. The 2020 season is not a marathon, but a sprint, so we’re already in the home stretch. We’re not starting at square one, of course; if this were Monopoly, the bank would be out of hotels and everyone playing the game would hate each other, especially that jerk who has Boardwalk and Park Place.

Projecting such a season presents some unique challenges a prognosticator doesn’t normally face. It’s not projecting the individual players’ production that’s the problem so much as all the stuff around it. How many players will miss time due to the league’s COVID-19 protocols? How do we adjust for injuries when teams will play just 37% of the games, but players’ recovery from hamstring and elbow woes won’t be similarly prorated? Will top prospect talent have the same short-term upside when they’re riding the bench or practicing at their team’s alternate site that they would if they were playing actual games in the minors? How will the strange, crowdless games and the stresses of keeping up social distancing guidelines affect play?

No, I’m actually asking! I can make educated guesses that I hope aren’t preposterous, but I don’t actually know the answers to these questions. For someone who models stuff, it’s a maddening situation. But it’s a challenge I can’t avoid given that projecting stuff is, well, a big part of my job! But you’re not here to commiserate with me, humor my self-indulgent wordsmithing, or dig out where I make a reference to the Battle of Actium in 31 BC, so let’s go straight to the final projected standings. Read the rest of this entry »


Toppling Ted: The 60-Game Season and the .400 Batting Average

One of the ways that the baseball of yesteryear was different from baseball today was the importance of batting average. With a pitching philosophy that envisioned lots and lots of balls being hit into play and no gauntlet of modern relief pitchers to face, far more at-bats ended with a ball being handled by a defensive player. In 2019, 63% of plate appearances ended with a ball being hit into play. In 1919, that figure was 81%. With half as many fieldable balls, it’s hardly a shock that league batting averages have declined. The effect would be even larger, too, but batting average on balls hit into play was higher in 2019 (.298) than in 1919 (.282).

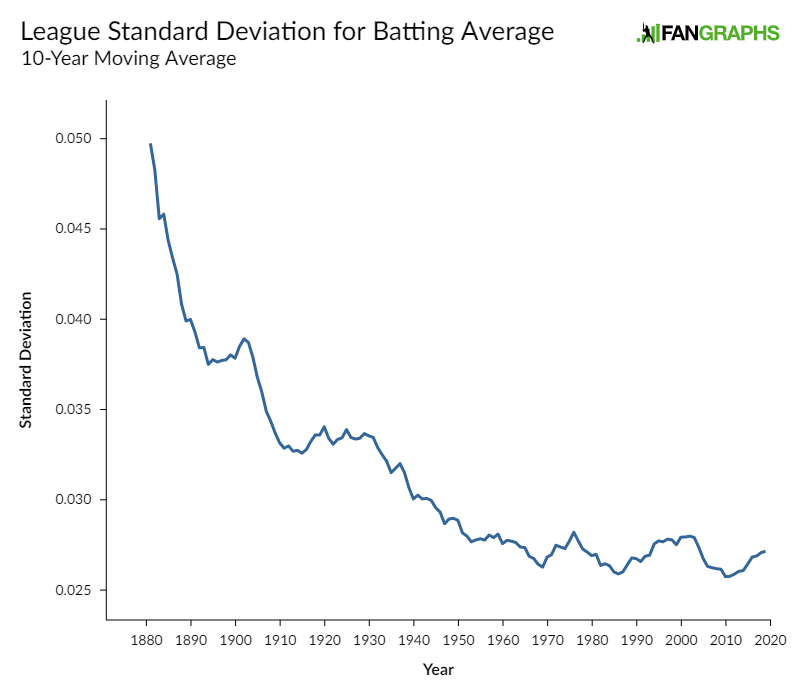
Hitting .400 was never an easy feat, but it wasn’t some wild, once-in-a-lifetime occurrence when it did happen. The .400 mark has been eclipsed 34 times in major league history, give or take (the number varies depending on just what you consider a major league team in the wild world of 1870s baseball). Ted Williams hit .406 in 1941 and that was it, the last time a major leaguer hit .400 over a season. It’s more than just the lower league batting averages. Baseball’s .252 batting average in 2019 was still higher than in 17 seasons before 1941. Baseball has trended in a more competitive direction and as a league becomes more competitive, you generally expect the differences between players to shrink. That’s true for batting average, too. Just look at the simplest measure of dispersion, standard deviation:

The standard deviation has gotten smaller as time has progressed. Using this simple method, Ted Williams’s .406 in 1941 was 4.46 standard deviations better than the mean batting average of .262 (z-score). A z-score of 4.46 in 2019 only represents a .370 batting average. Nobody’s hit that mark recently, either, but .370 certainly doesn’t feel like anywhere near the same hurdle.

Since it’s the obvious next question, here are the best batting averages by Z-Score. Again, there are more robust ways to look at this, but we’re scrawling on envelope-backs, not landing astronauts on the moon:

Best Batting Averages by Z-Score
Season Name Batting Average Z-Score
1977 Rod Carew .388 4.86
1980 George Brett .390 4.75
1941 Ted Williams .406 4.46
1887 Tip O’Neill .435 4.22
1909 Ty Cobb .377 4.22
1910 Nap Lajoie .384 4.20
1985 Wade Boggs .368 4.18
1910 Ty Cobb .383 4.17
1999 Larry Walker .379 4.16
1988 Wade Boggs .366 4.16
1913 Ty Cobb .390 4.13
1939 Joe DiMaggio .381 4.12
1957 Ted Williams .388 4.12
1911 Ty Cobb .420 4.12
1924 Rogers Hornsby .424 4.11
1974 Rod Carew .364 4.06
2004 Ichiro Suzuki .372 4.05
2002 Barry Bonds .370 4.05
1904 Nap Lajoie .376 4.03
1916 Tris Speaker .386 4.03
2009 Joe Mauer .365 4.01
1987 Tony Gwynn .370 4.00
1971 Joe Torre .363 3.99
1917 Ty Cobb .383 3.98
1970 Rico Carty .366 3.96

Read the rest of this entry »


2020 Positional Power Rankings: Starting Rotation (No. 1-15)

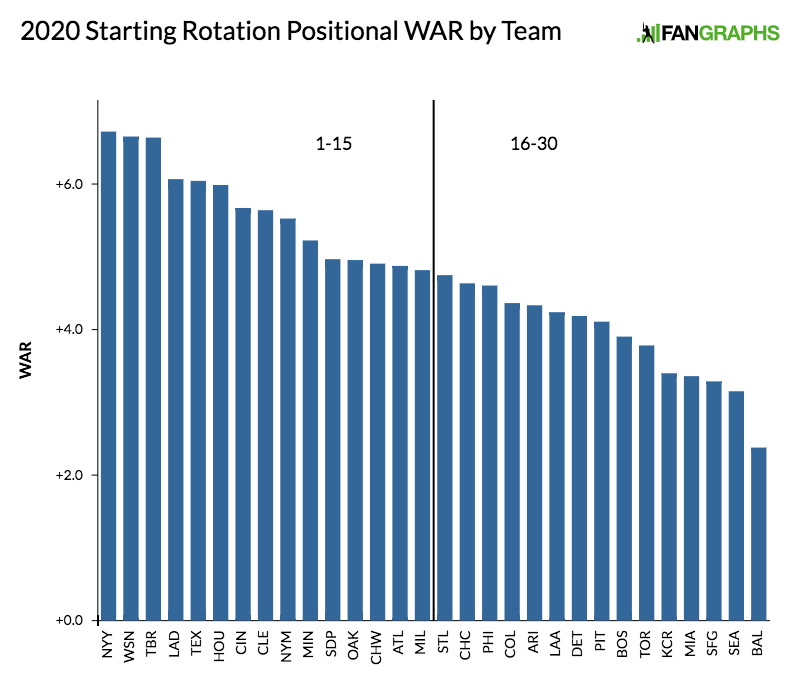
Earlier today, Paul Sporer took you through baseball’s 16th-to-30th ranked rotations. Now, we get to the good stuff.

What is a starting pitcher? While baseball’s rules have been relatively stable throughout the game’s history, being a starter in 2020 means something very different than it did in 1870, 1920, or even 1970. A starting pitcher in the 1800s was frequently the pitcher in any given game. When Hall of Fame pitcher (and later, Twitter superstar), Old Hoss Radbourn pitched for the 1884 Providence Grays, he started 75 of the team’s 114 games, completing 73 of them.

Being a starter meant something else in the early 20th century. They were still workhorses expected to finish a large percentage of their games, but they were part of a pitching staff, not lone wolves. Jack Chesbro was the last 50-game starter, in 1904. Four-man rotations became the standard and league leaders in games-started ranged from the high 30s to the low 40s. The only exception was one last surge in the early 70s from rubber-armed knuckleballers Wilbur Wood and Phil Niekro. The four-man rotation then became a five-man affair, and it’s now been 33 years since a pitcher started 40 games (Charlie Hough, 1987) and 40 years since one threw 300 innings (Steve Carlton, 1980). Read the rest of this entry »


Dan Szymborski FanGraphs Chat – 7/16/20

12:04
Avatar Dan Szymborski: Hello friends! And enemies! (We don’t have any kind of wall that would distinguish between the two)

12:04
Guest: What is going on with Austin Meadows?  Any idea?

12:05
Avatar Dan Szymborski: Gentrification continues. The trendy bars have pushed away a lot of the old historic businesses.

12:05
Avatar Dan Szymborski: (Sorry, Austin Meadows always sounds like an obnoxious trendy city neighborhood)

12:06
Avatar Dan Szymborski: I haven’t heard much about what was going on with him.

12:07
Avatar Dan Szymborski: I wonder if he’d do what I’d do if I was an MLB player? I’d probably use this opportunity to get a vacation right up until opening day by being vaguel absent! Maybe cough a few times

Read the rest of this entry »


Braves to Sign Yasiel Puig

A report Tuesday from MLB.com’s Mark Feinsand indicates that Yasiel Puig will sign a one-year contract with the Atlanta Braves. The 29-year-old Puig hit .267/.327/.458 with 24 home runs for a 101 wRC+ and 1.2 WAR while playing for the Reds and Indians in 2019. The former Rookie of the Year runner-up spent most of last season in Cincinnati before heading to outfield-deficient Cleveland as part of the three-way trade that sent Trevor Bauer to Cincinnati and Taylor Trammell to San Diego. The exact financial terms of the deal are not yet available, but it’s unlikely that Puig’s one-year contract is for an exorbitant amount of cash from the team’s point of view.

From a pure “how good is Puig?” standpoint, completely divorced from context, this signing is an underwhelming one. Puig hit the market unencumbered by the possible loss of a draft pick upon signing (he was ineligible to receive a qualifying offer because of the trade), but even still, his free agency garnered a tepid reception this winter. Now, this offseason’s free agent market featured a lot more action than other recent ones, but that was driven by elite free agents such as Gerrit Cole and Anthony Rendon. Teams were still generally uninterested in first basemen and corner outfielders, with few getting multi-year deals and only José Abreu and Nick Castellanos getting more than $20 million guaranteed. Puig drew some interest, but nobody seemed all-in on bringing him in before spring training or when transactions were recently unfrozen. Read the rest of this entry »


2020 Positional Power Rankings: Second Base

On Monday, Jay Jaffe kicked off our positional power rankings series by evaluating the league’s first basemen. If you need a refresher on the series, Meg Rowley wrote a handy explainer. Today, we stay on the infield and turn our attention to second base.

Second base has become a decidedly unsexy position. Teams are more willing than ever to keep players at shortstop, leaving the keystone increasingly populated by the guys with weak arms, not enough glove for short, or not enough bat for third base. Throughout history, shortstops have generally hit worse than second basemen, which makes sense given that short is the tougher defensive position. But in 2018, after years of slowly gaining ground, shortstops outhit second basemen, with a 97 wRC+ vs. 95 at second; in 2019, they did it again (100 vs. 96).

It hasn’t helped the position that there’s been a talent drain. Chase Utley, Ben Zobrist, Ian Kinsler, and Brandon Phillips are all gone, Robinson Canó, Brian Dozier, and Jason Kipnis are nearly so, and it’s an open question whether Dustin Pedroia plays again. Only José Altuve is all that is left standing of the elite second basemen from the 2010s. Meanwhile, there are only seven second basemen with a future value of 50 or better on THE BOARD, compared to nine at third base and 14 at shortstop. Inevitably, some of the shortstops will end up as second basemen, but that’s kind of the point; the shortstops that shift will likely be the ones who didn’t make the cut at short. Players like Gavin Lux and Nick Madrigal will provide new blood, but they’re likely at least three or four years away from their peak years. Read the rest of this entry »


Dan Szymborski FanGraphs Chat – 7/9/20

12:02
Avatar Dan Szymborski: Greetings all! So begins another Chatxperience!

12:02
Matt: In your opinion, who is the best person currently playing in mlb? Not the best player, the best person.

12:03
Avatar Dan Szymborski: I don’t feel comfortable making those kinds of evaluations. I’m very qualified to evaluate players at playing baseball. I have no such qualifications at determing quality of a person.

12:04
Avatar Dan Szymborski: When we do the chapter BBWAA awards for the local team (Reds in my case), I always abstain from the Good Guy award.

12:04
Szan Dymborski: Szmbob! Why do I still think this season is not going to happen?

12:04
Avatar Dan Szymborski: Well, there’s a raging epidemic going on, so no matter how great a job MLB does, there’s always significant risk.

Read the rest of this entry »


ZiPS Time Warp: Nomar Garciaparra

One of the defining features of late 1990s baseball was the battle between three young, superstar shortstops: Alex Rodriguez of the Seattle Mariners, Derek Jeter of the New York Yankees, and Nomar Garciaparra of the Boston Red Sox. There were the occasional interlopers, such as Barry Larkin in his late-career surge and Jay Bell with the Diamondbacks in the midst of his second wind, but A-Rod, Jeter, and Garciaparra were the big three at the top of the leaderboards. The debate surrounding these three shortstops was very much in the public eye, with the trio at the top of the sport in terms of both name recognition and performance.

Top MLB Shortstops, 1997-2000
Player G BA OBP SLG wRC+ WAR
Nomar Garciaparra 571 .337 .386 .577 142 27.5
Alex Rodriguez 579 .304 .372 .560 137 26.4
Derek Jeter 614 .325 .402 .479 132 21.2
Barry Larkin 481 .306 .399 .468 124 16.9
Jay Bell 608 .275 .361 .473 112 14.8
Omar Vizquel 604 .297 .370 .387 98 14.6
Mike Bordick 620 .266 .323 .395 87 10.9
Tony Batista 470 .262 .312 .497 99 8.8
Jose Valentin 520 .249 .330 .432 92 7.4
Rich Aurilia 461 .274 .331 .438 99 7.3
Royce Clayton 577 .261 .317 .397 81 6.2
Mark Grudzielanek 583 .285 .330 .391 90 6.0
Rey Sanchez 521 .282 .319 .350 70 5.9
Jeff Blauser 374 .266 .372 .409 108 5.5
Miguel Tejada 450 .253 .323 .431 92 5.4
Edgar Renteria 591 .278 .338 .377 88 5.2
Pokey Reese 471 .257 .314 .368 72 5.1
Mark Loretta 516 .294 .360 .401 98 5.0
José Hernández 541 .257 .322 .431 90 4.9
Walt Weiss 407 .261 .362 .347 84 4.7

We’ve been blessed with a flurry of phenom shortstops since then, but having three multi-talented players at the position who were also elite offensive performers was rather novel at the time. Cal Ripken Jr., Alan Trammell, and Robin Yount came the closest in living memory, but that fight was short-lived as Yount eventually moved to the outfield. To find another three this good, you’d have to jump back 60 years to the days of Lou Boudreau, Luke Appling, and Arky Vaughan. Read the rest of this entry »


Szymborski’s Breakdown Candidates for 2020

Yesterday, I posted my 10 favorite breakout candidates for our abbreviated 2020 season. Now it’s time for that piece’s inevitably less-optimistic companion, the breakdowns.

As with the breakouts, precisely defining a breakdown in exact statistical terms is difficult and, I feel, counterproductive. Sometimes it’s a guy with a few dangerous leading indicators; other times, it’s a player who has already seemingly fallen off the cliff and it’s whether he can catch the ledge. Occasionally, a player reaches an age when decline is nearly inevitable; time eventually defeats all of its opponents after all.

With all that in mind, here are my “favorite” 10 breakdown selections for 2020’s 60-game sprint.

Justin Verlander, Houston Astros

Don’t get me wrong, I still think Justin Verlander is a terrific pitcher. But he’s at an age when pitchers can decline very quickly and he’s recovering from a significant groin injury. ZiPS is still convinced he’s an easy ace, but those low-percentile projections have gotten a bit scarier. Verlander’s projection for 2020 is quite close to his 2019, but the differences at the bottom are stark; ZiPS projects an 14% chance of Verlander having an ERA+ under 80; when re-projecting 2019 with a 60-game season, that number was only 5%. There’s no methodology change that accounts for these differences. As breakdowns go, this is a mild one, but it’s significant given Houston’s increased reliance on Verlander without Gerrit Cole around. Read the rest of this entry »