During the last few days of spring training, most teams are wrapping up position battles and preparing for Opening Day. The Angels, meanwhile, decided the waning days of March were a great time to revamp their bullpen. On Sunday, they signed Noé Ramirez to a minor league deal. Then on Monday, they acquired James Hoyt from the Marlins for cash considerations and signed Steve Cishek and Tony Watson to matching one-year, $1 million deals. Save Hoyt, all these pitchers were available because they had already been cut from other team’s rosters. That’s not a promising way to build a bullpen, but the Angels, who desperately need additional depth on their staff, didn’t have much of a choice.
Bolstering the relief corps was a priority for new Angels GM Perry Minasian, and he made a handful of moves in the winter to do so. In December, he acquired new closer Raisel Iglesias from the Reds in exchange for Ramirez and a player to be named later. Ramirez ended up getting cut by the Reds, and the Angels scooped him up again, effectively acquiring Iglesias for free. The team also added Alex Claudio and Junior Guerra via free agency, but even with those three new relievers, Los Angeles still lacked depth in the middle of their bullpen. The projected relief corps before this week included control artist Aaron Slegers, the raw but promising Chris Rodriguez, and veteran Jesse Chavez to hold the line during the middle third of the game. Conspicuously absent from that group is Ty Buttrey, who was a solid option out of the bullpen in 2018 and ‘19 but greatly disappointed last year. He was optioned to minor league camp last week. Felix Peña will likely be counted on for some high-leverage work as well, but he strained his hamstring this spring and will start the year on the Injured List.
With Hoyt, Ramirez, Watson and Cishek on board, here’s what Los Angeles’ bullpen now looks like:
Angels Bullpen, Depth Chart Projections
| Player |
IP |
K/9 |
BB/9 |
GB% |
ERA |
FIP |
Options |
| Raisel Iglesias |
64 |
10.94 |
3.10 |
38.8% |
3.55 |
3.73 |
0 |
| Mike Mayers |
63 |
9.93 |
3.36 |
39.5% |
4.17 |
4.19 |
0 |
| Felix Peña |
58 |
9.59 |
3.16 |
43.3% |
4.24 |
4.34 |
1 |
| Alex Claudio |
60 |
6.12 |
2.88 |
54.4% |
4.10 |
4.30 |
0 |
| Junior Guerra |
56 |
8.73 |
4.15 |
41.4% |
4.62 |
4.89 |
0 |
| Steve Cishek |
48 |
8.83 |
3.93 |
43.2% |
4.20 |
4.63 |
0 |
| Tony Watson |
44 |
7.08 |
2.83 |
42.8% |
4.69 |
5.00 |
0 |
| Aaron Slegers |
36 |
6.31 |
2.29 |
44.5% |
4.94 |
5.09 |
1 |
| Chris Rodriguez |
33 |
9.78 |
4.27 |
45.5% |
4.54 |
4.51 |
3 |
| James Hoyt |
31 |
9.09 |
3.88 |
44.8% |
4.17 |
4.41 |
1 |
| Ty Buttrey |
26 |
9.38 |
3.32 |
45.8% |
3.87 |
4.03 |
2 |
| Noé Ramirez |
20 |
9.37 |
3.40 |
41.3% |
4.58 |
4.81 |
0 |
Yellow = New Acquisition
Adding so many relievers has definitely increased the depth, but the flexibility isn’t all that improved. The first seven names on that list are either out of minor league options or good enough to hold a roster spot for the entire season. If the Angels carry eight relievers on their 26-man roster, that means the final bullpen spot will be a rotating door for whichever reliever is the freshest.
Of the four relievers added this week, Hoyt has the most interesting projection. He broke into the majors in 2016 with Houston and won a championship there the next year, though he was left off the postseason roster. He was traded to Cleveland mid-way through 2018 and spent what was left of that year as well as the majority of ’19 in Triple-A, logging just 8.1 innings in the majors that season.
When the Marlins faced a team-wide COVID outbreak at the start of last year, they acquired Hoyt for cash considerations to help fill out the bullpen. He enjoyed the best season of his short career in Miami, striking out over 30% of the batters he faced despite a huge drop in velocity across all four of his pitches. To combat that, he started throwing his slider more than two-thirds of the time. With a whiff rate over 40%, that pitch formed the foundation of his success.
Hoyt’s velocity hasn’t returned this spring: His fastball is topping out under 90 mph, and his slider is coming in around 80 mph. But if he maintains his approach from last year, he’s shown that his slider is good enough to thrive without elite velocity. The other important thing he possesses is a minor league option. The Angels’ bullpen has a lot less flexibility to call up fresh arms when the attrition of a full season starts to hit. Since Hoyt is one of the few relievers with an option still available, he’ll probably ride the shuttle between Triple-A and the majors regularly this season.
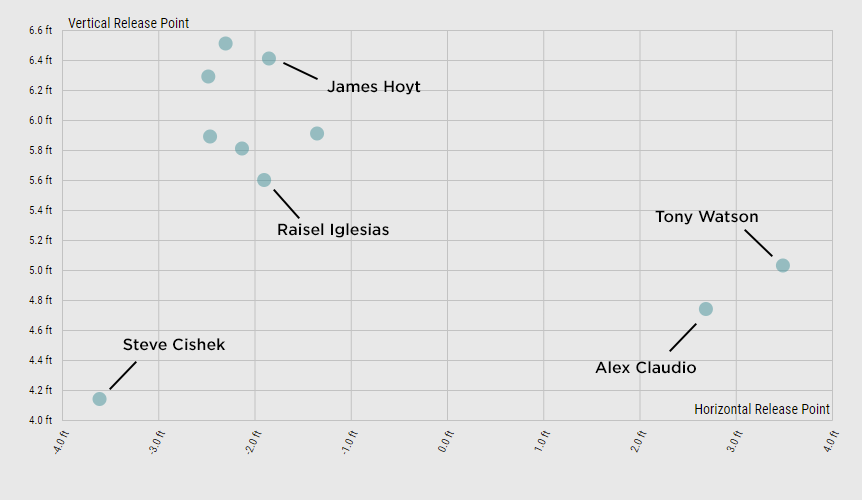
In Cishek and Watson, the Angels add two relievers with plenty of high-leverage experience and funk. Cishek scuffled through his worst season in the majors in the White Sox’ bullpen last year. The frisbee slider he whips in from an extremely low release point was as good as ever, but his sinker was crushed. In the past, he had relied on that pitch to maintain his above-average ground ball rate, but opposing batters elevated and celebrated against it in 2020. At this point, he’s best cast as a right-handed specialist so he can use his slider as much as he needs to. Facing too many left-handed bats will leave him exposed, especially now that his sinker is barely crossing 90 mph regularly.
Watson’s career arc closely mirrors Cishek’s. He was a solid high-leverage option for the Pirates, Dodgers, and Giants for a number of years, but the quality of his stuff has deteriorated recently. The 2019 season was his nadir — a 4.17 ERA, 4.81 FIP, and -0.2 WAR in 54 innings — though last year represented a small bounce back. And like Hoyt and Cishek, he had to learn how to survive with diminished velocity: He saw a three mile per hour drop across his entire repertoire, though his strikeout rate did jump up three points from ’19.
Watson’s extreme release point nearly matches that of fellow lefty sidearmer Claudio. But where the latter has historically struggled with a significant platoon split, the former’s has been much less dramatic. In 2020, that handedness split was mitigated even further as Watson increased the usage of his changeup to 45%, making it his primary pitch. But like Hoyt, his velocity failed to show up this spring, and he opted out of his minor league deal with the Phillies, who had signed him over the winter.
With Cishek and Watson now in the fold, the Angels’ bullpen has another pair of sidearming relievers to pair with Claudio. It brings to mind the multi-faceted bullpen the Rays put together last season, where nearly every reliever threw from a different arm slot. The Angels aren’t as extreme as the Rays were, but they have a couple of different looks they can trot out to throw off the opposing team.
The velocity issues each of these pitchers are dealing with certainly doesn’t inspire confidence. But when you’re bringing in relievers off the scrap heap, there isn’t much you can do about warts like that. Hoyt, Cishek, and Watson have all shown a willingness to adapt their approach and have had some success with their diminished repertoires. Luckily, the Angels aren’t counting on them to handle critical innings for them — only to provide a competent bridge to the back end of the bullpen.
