Author Archive: Jake Mailhot

FanGraphs Power Rankings: June 1–7

The best teams in baseball continue to separate themselves from the huge morass of mediocre clubs in the middle of the standings. That means the division races might not as exciting, but both Wild Card chases should more than make up for that.

Our power rankings use a modified Elo rating system. If you’re familiar with chess rankings, you’ll know that Elo is an elegant ranking format that measures teams’ relative strength and is very reactive to recent performance. To avoid overweighting recent results during the season, we weigh each team’s raw Elo rank using our coin flip playoff odds. (Specifically, we regress the playoff odds by 50% and weigh those against the raw Elo ranking, increasing in weight as the season progresses to a maximum of 25%.) The weighted Elo ranks are then displayed as “Power Score” in the tables below. As the best and worst teams sort themselves out between now and October, they’ll filter to the top and bottom of the rankings, while the exercise remains reactive to hot streaks and cold snaps. If you’re looking for a visual representation of the ups and downs of your team throughout the season, look no further than the brand new Power Rankings Board in the FanGraphs Lab.

First up are the full rankings, presented in a sortable table. Below that, I’ve grouped the teams into tiers with comments on a handful of clubs. You’ll notice that the official ordinal rankings don’t always match the tiers — there are times where I take editorial liberties when grouping teams together — but generally, the ordering is consistent. One thing to note: The playoff odds listed in the tables below are our standard Depth Charts odds, not the coin flip odds that are used in the ranking formula. Read the rest of this entry »


FanGraphs Power Rankings: May 25–31

As the calendar turns to June, the playoff picture is tight in both leagues. There are 11 teams in the NL with records over .500, which should make for an exciting Wild Card race this summer. The AL is nearly as competitive, though for the opposite reason, as more than half of the clubs in the junior circuit have losing records.

Our power rankings use a modified Elo rating system. If you’re familiar with chess rankings, you’ll know that Elo is an elegant ranking format that measures teams’ relative strength and is very reactive to recent performance. To avoid overweighting recent results during the season, we weigh each team’s raw Elo rank using our coin flip playoff odds. (Specifically, we regress the playoff odds by 50% and weigh those against the raw Elo ranking, increasing in weight as the season progresses to a maximum of 25%.) The weighted Elo ranks are then displayed as “Power Score” in the tables below. As the best and worst teams sort themselves out between now and October, they’ll filter to the top and bottom of the rankings, while the exercise remains reactive to hot streaks and cold snaps. If you’re looking for a visual representation of the ups and downs of your team throughout the season, look no further than the brand new Power Rankings Board in the FanGraphs Lab.

First up are the full rankings, presented in a sortable table. Below that, I’ve grouped the teams into tiers with comments on a handful of clubs. You’ll notice that the official ordinal rankings don’t always match the tiers — there are times where I take editorial liberties when grouping teams together — but generally, the ordering is consistent. One thing to note: The playoff odds listed in the tables below are our standard Depth Charts odds, not the coin flip odds that are used in the ranking formula. Read the rest of this entry »


Keibert Ruiz Rises From the Ashes

Brad Mills-Imagn Images

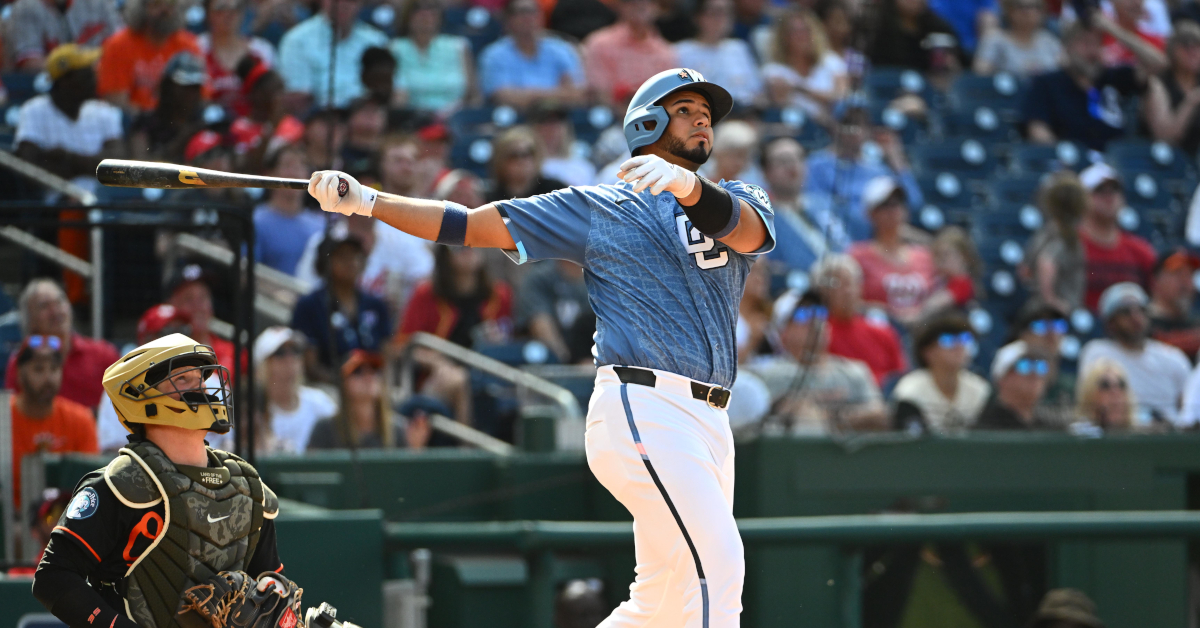
A long time ago, Keibert Ruiz was one of the top catching prospects in baseball. He was so highly regarded that he was a significant piece of the Nationals’ return in the Max Scherzer and Trea Turner trade with the Dodgers in 2021. After a solid first full season in Washington the following year, he signed an eight-year extension worth $50 million in March 2023. Unfortunately, that’s when the bottom fell out. Over the last three years, Ruiz has been the worst qualified position player in baseball, “accumulating” -1.9 WAR.

When the Nationals acquired Harry Ford in a trade with the Mariners this offseason, it was fair to wonder if Ruiz’s days as the team’s primary backstop were numbered. He had been a disaster both at the plate and behind it. His 79 wRC+ over the last three years was a hair higher than Patrick Bailey’s 76 mark, but instead of offsetting that offensive futility with elite defense, Ruiz was the worst defensive catcher in baseball. It’s shocking, then, to see that he has so completely turned things around this year; he’s already accrued 0.8 WAR and has been the 11th-most valuable catcher in baseball in just 34 games.

Let’s tackle the most surprising development first: All of a sudden, Ruiz is providing positive value behind the plate. Among the 53 catchers who caught at least 1,000 innings over the last three years, Ruiz was the second-worst framer, the second worst at throwing out base stealers, and the sixth-worst blocker. This year, he’s added two runs via framing and has been a slightly above-average blocker. His throwing hasn’t improved all that much according to Statcast, but he also hasn’t been challenged very often, so that area of defense hasn’t really affected his overall defensive value.

Last year, Ruiz suffered two concussions within a few weeks of each other. The first came on June 23, when an errant foul ball hit him in the head while he was sitting in the dugout. The second came just a week and a half later — and just two days after he had been activated off the 7-day concussion IL — when a foul tip struck him in the mask. He attempted to return to play in September, but he was shut down from his rehab assignment after his concussion symptoms returned. In an effort to reduce his risk behind the plate, the Nationals had Ruiz adjust his stance so that he’s now crouching lower to the ground:

In the picture above, you can see that at the pitcher’s release, Ruiz’s back isn’t as upright and his head is a little lower to the ground. The team thought that a lower stance would allow more foul tips to fly over his head instead of into his mask. That might have been the intended goal of the new position, but the effect on Ruiz’s ability to receive pitches has transformed his defensive metrics. If we look at Statcast’s detailed framing data, over the last three years, Ruiz had really struggled to receive both low pitches and pitches to his right:

Keibert Ruiz, Catcher Framing Runs
Year Pitches Framing Runs, Top Zone Framing Runs, Bottom Zone Framing Runs, Left Zone Framing Runs, Right Zone Total Framing Runs
2023 9444 3 -12 1 -2 -12
2024 8091 1 -5 2 -2 -3
2025 4942 -1 -5 1 -3 -9
2026 2427 1 0 -1 2 2
Source: Baseball Savant

It’s reasonable to think that sitting lower in his stance has helped him to frame those low pitches much more effectively. What’s even more surprising is that the right-hand side of the plate is now his strongest framing zone. In addition to benefiting his receiving, a lower crouch has probably helped him block errant pitches that he might not have been able to get to previously.

Going from being one of the worst defensive catchers in baseball to an above-average one is a tremendous improvement on its own, but Ruiz has also taken a step forward as a hitter. Ruiz got off to a familiar slow start at the plate this year; though May 6, he was running a .182/.203/.303 slash line, with a hugely disappointing 37 wRC+. As Spencer Nusbaum of The Athletic reported on Thursday, Ruiz met with the Nationals coaching staff on May 7 to build a plan for improvement. That same day, he smacked a pair of doubles and a home run. Over his last 11 games, he’s collected 16 hits, seven doubles, and three home runs, raising his season line to .262/.277/.486 (109 wRC+). The plan seems to have worked.

Two things keyed this offensive outburst. First, Ruiz is being more selective when it comes to which pitches to swing at, and second, he’s swinging to do damage when he gets a good pitch to hit. Here’s how manager Blake Butera put it in an interview with Jessica Camerato of MLB.com:

“That’s the one thing with Keibert is, he can cover a lot of pitches but he can also hit the ball really hard. And it’s really hard to hit pitches hard when you’re swinging at everything and just making contact. So one thing we put on him was, shrink the zone a little bit, trust your hand-eye coordination, even if that means taking some borderline pitches that are strikes. Wait until you get a good pitch to hit. Then he’s doing the work from there.”

Throughout his career, Ruiz has displayed excellent bat-to-ball skills and a fantastic ability to cover the entire plate; it’s the reason his career strikeout rate is just 11.1%. But his aggressiveness and propensity to put the ball in play is also why his career walk rate is just 4.7%. With a new selective approach in mind, Ruiz has cut his overall swing rate to 47.5%, a five point drop from where it’s been in the recent past. He’s given up nearly all of those swings on pitches located in the zone; his chase rate is essentially unchanged, but his zone swing rate is down nearly 10 points.

Despite that increased selectivity, he’s still making contact just as often, only now that contact has a little more oomph behind it. Ruiz has significantly improved his contact quality, and most of the improvement has come as a right-handed hitter. Throughout his career, he’s run a neutral platoon split as a switch-hitter, but his underlying batted ball metrics were significantly worse from the right side despite the results indicating otherwise:

Keibert Ruiz, Batted Ball Peripherals
As Left-Handed Hitter
Year BatSpd* Ideal Atk Angle Hard Hit% Barrel% Pull AIR% xwOBAcon wOBA
2022-25 67.1 56.1% 27.2% 2.9% 24.5% 0.334 0.304
2026 68.3 56.6% 38.0% 4.0% 39.6% 0.265 0.299
As Right-Handed Hitter
Year BatSpd* Ideal Atk Angle Hard Hit% Barrel% Pull AIR% xwOBAcon wOBA
2022-25 64.8 54.4% 23.4% 2.1% 19.7% 0.281 0.291
2026 67.0 67.7% 47.2% 13.9% 35.9% 0.332 0.458
Source: Baseball Savant
*Bat tracking data limited to 2024–26

This year, Ruiz is doing a ton more damage against left-handed pitching. He’s increased his bat speed from the right side by more than two ticks and has seen huge improvements in every meaningful batted ball metric. He’s also seen a jump in batted ball quality from the left side, albeit a smaller one. That growth appears to stem from his intent at the plate. He’s seeking good pitches to hit and is looking to drive them in the air to the pull side. His pull rate is all the way up to 67.4%, the largest increase of any batter this year, and he’s elevating his contact a lot more often as well. The results over the last few weeks speak for themselves.

For now, Ruiz is still splitting time behind the plate with Drew Millas. He has started a little over half of the Nationals’ games this season and just 11 of the 20 games since the fateful meeting that set him on this course. Millas was a well-regarded catching prospect in his own right not too long ago, but he hasn’t exactly impressed during parts of four seasons in the big leagues. He’s currently running a 41 wRC+ with adequate defense behind the plate. And Ford isn’t knocking on the door of the big leagues, either; the young catcher has mustered just a 74 wRC+ in Triple-A this year. If Ruiz continues bashing the ball and is able to keep up the good work defensively, it wouldn’t be surprising to see him reclaim his role as the team’s everyday catcher in short order.

With their plan for improvement in place, the Nationals have to be thrilled to see such positive results so quickly from Ruiz. I’m sure there will be bumps in the future — we’re talking about just 43 plate appearances since he made these changes to his approach — but with the support of the coaching staff, Ruiz appears to have been set on a path to success.


FanGraphs Power Rankings: May 18–24

We’re a third of the way through the regular season, which is when the standings start to matter and win-loss records start to become more predictive of summer results. That’s an exciting prospect for the league’s surprise contenders, if a frightening one for some of the playoff hopefuls that are struggling to make headway in the standings.

Our power rankings use a modified Elo rating system. If you’re familiar with chess rankings, you’ll know that Elo is an elegant ranking format that measures teams’ relative strength and is very reactive to recent performance. To avoid overweighting recent results during the season, we weigh each team’s raw Elo rank using our coin flip playoff odds. (Specifically, we regress the playoff odds by 50% and weigh those against the raw Elo ranking, increasing in weight as the season progresses to a maximum of 25%.) The weighted Elo ranks are then displayed as “Power Score” in the tables below. As the best and worst teams sort themselves out between now and October, they’ll filter to the top and bottom of the rankings, while the exercise remains reactive to hot streaks and cold snaps. If you’re looking for a visual representation of the ups and downs of your team throughout the season, look no further than the brand new Power Rankings Board in the FanGraphs Lab.

First up are the full rankings, presented in a sortable table. Below that, I’ve grouped the teams into tiers with comments on a handful of clubs. You’ll notice that the official ordinal rankings don’t always match the tiers — there are times where I take editorial liberties when grouping teams together — but generally, the ordering is consistent. One thing to note: The playoff odds listed in the tables below are our standard Depth Charts odds, not the coin flip odds that are used in the ranking formula.

All power rankings stats, including team records, are updated through Sunday’s games. The rest of the information below is current as of Tuesday morning.

FanGraphs Power Rankings
Rank Team W-L Hot/Cold Elo Opp Elo Playoff% Power Score Δ
1 ATL 36-18 ⛵ 1589 1491 96.9% 1598 0
2 TBR 34-16 — 1587 1490 92.3% 1597 0
3 LAD 33-20 🔥 1589 1493 99.3% 1592 0
4 MIL 30-20 🛣️ 1562 1501 75.7% 1563 2
5 CLE 32-23 🔥 1540 1499 77.9% 1548 5
6 SDP 31-21 🛣️ 1544 1498 48.9% 1547 -1
7 NYY 31-22 — 1534 1490 97.8% 1543 0
8 ARI 28-24 🔥 ⛵ 1525 1504 41.9% 1520 7
9 STL 29-22 — 1517 1500 30.5% 1518 -1
10 CHC 29-24 ❄️ 1518 1508 53.1% 1516 -6
11 PHI 26-27 — 1520 1498 58.0% 1508 -2
12 ATH 27-26 ⛵ 1495 1500 42.3% 1497 1
13 MIN 26-27 🔥 1499 1495 34.5% 1497 11
14 TOR 25-28 🔥 1498 1494 44.4% 1492 4
15 PIT 27-26 — 1499 1498 45.9% 1491 -1
16 SEA 25-29 ❄️ 1489 1492 65.2% 1484 0
17 WSN 27-27 — 1490 1510 2.9% 1482 6
18 CIN 27-25 — 1485 1501 13.6% 1480 2
19 CHW 26-26 — 1480 1495 8.3% 1480 -7
20 TEX 24-28 ❄️ ⛵ 1482 1515 39.5% 1478 -9
21 BOS 22-30 — 1482 1508 26.4% 1472 -2
22 MIA 25-29 🔥 🛣️ 1480 1507 5.4% 1469 5
23 HOU 23-31 🔥 1472 1492 13.6% 1462 5
24 SFG 22-31 — 1475 1516 7.9% 1460 -3
25 BAL 23-30 — 1464 1497 20.5% 1455 -3
26 NYM 22-31 — 1470 1488 18.6% 1455 -9
27 KCR 22-31 — 1457 1496 17.5% 1447 -2
28 DET 21-33 ❄️ 1431 1498 18.5% 1420 -2
29 LAA 20-34 — 1412 1498 1.2% 1403 1
30 COL 20-34 — 1406 1520 0.0% 1394 -1
🔥 Elo up >20 pts (last 10) | ❄️ Elo down >20 pts (last 10)
🛣️ Avg opp Elo >1525 (last 10) | ⛵ Avg opp Elo <1475 (last 10)

…

Tier 1 – The Best of the Best
Team Record Elo Opponent Elo Playoff Odds Power Score
Braves 36-18 1589 1491 96.9% 1598
Rays 34-16 1587 1490 92.3% 1597
Dodgers 33-20 1589 1493 99.3% 1592

The Braves lost consecutive games for just the third time this season this past weekend, dropping two straight to the Nationals in a surprisingly hard-fought series. Despite that small hiccup, Atlanta is completely in control of the NL East; the team has an 8 1/2 game lead over Washington and is showing no signs of slowing down.

The Rays wound up splitting their rain-shortened series against the Yankees over the weekend after Aaron Judge blasted a walk-off home run on Sunday. That loss snapped a five-game win streak, though Tampa Bay is still 3 1/2 games ahead of New York in the AL East. The team’s offense has been humming along, sitting in the top five in baseball in batting average and on-base percentage, though they’re just 28th in home runs and isolated power. The entire package has been solid — a 104 wRC+ puts them eighth in the majors — but there’s a pretty clear path to improving the lineup as the Rays start planning how to approach the trade deadline.

The Dodgers won four of six against the Padres and Brewers last week, successfully completing a gauntlet against some of the best teams in the National League. Shohei Ohtani had collected hits in eight straight games since his short reset at the plate a few weeks ago; he was held hitless on Sunday, but has compiled a 235 wRC+ over his last 10 games. Teoscar Hernández is also heating up; he’s collected 18 hits and three home runs over the last two weeks. Of course, one of the biggest reasons the Dodgers have enjoyed so much recent success is a bullpen that just had a 38-inning scoreless streak snapped Monday night.

Tier 2 – Solid Contenders
Team Record Elo Opponent Elo Playoff Odds Power Score
Brewers 30-20 1562 1501 75.7% 1563
Guardians 32-23 1540 1499 77.9% 1548
Padres 31-21 1544 1498 48.9% 1547
Yankees 31-22 1534 1490 97.8% 1543

In a series that flipped the NL Central standings, the Brewers swept the Cubs last week. Jacob Misiorowski and Kyle Harrison combined for 13 scoreless innings and 19 strikeouts in that series, as Milwaukee’s pitching staff held Chicago to just five total runs. Misiorowski has been particularly impressive in May; he allowed his first run of the month in his start on Monday and has collected 49 strikeouts in 31.1 innings. Even though they couldn’t overcome the Dodgers this past weekend, the Brew Crew took the first game of a huge series against the Cardinals on Monday.

The Guardians have gone streaking up the standings. They’ve won four straight series, compiling an excellent 11-3 record over the last two weeks; the Nationals scored 10 runs against Cleveland on Monday, just the second time the Guardians have allowed more than four runs in a single game during this stretch. With the Tigers and Royals in danger of falling out of the American League playoff picture entirely, it really does seem like the AL Central is Cleveland’s to lose.

The Yankees welcomed Gerrit Cole back last week and he looked great in his return; he held the Rays scoreless over six innings, allowing just two hits while striking out two. New York ended up splitting that series against Tampa Bay, which means the team hasn’t won a series since taking two of three from the Rangers in the first week of May. Aaron Judge has run a 92 wRC+ during this slide; his walk-off home run on Sunday was his first homer since May 10.

Tier 3 – The NL Melee
Team Record Elo Opponent Elo Playoff Odds Power Score
Diamondbacks 28-24 1525 1504 41.9% 1520
Cardinals 29-22 1517 1500 30.5% 1518
Cubs 29-24 1518 1508 53.1% 1516
Phillies 26-27 1520 1498 58.0% 1508

The Diamondbacks have very quickly turned their season around. Including their win on Monday, Arizona has gone 12-4 over their last 16 games and are suddenly in the thick of the NL Wild Card race. Ketel Marte has been on fire during this stretch. Seven of his last nine games have been multi-hit affairs, and he’s collected 24 hits and three home runs over the last two weeks, good for a 241 wRC+. Not to be out done, Corbin Carroll is in the midst of a 13-game hit streak, with 21 total hits, two homers, and a 261 wRC+.

The Cardinals went 2-3 against the Pirates and Reds last week, and will wrap up a tour of their NL Central foes with series against the Brewers and Cubs this week. For now, the Red Birds are in second place in the division and holding onto a Wild Card spot, but they lost the first game of their series in Milwaukee on Monday and need to turn things around against the division’s leaders.

It was a nightmare of a week for the Cubs. Including their loss on Monday, they’ve now lost nine straight and 13 of their last 15. The team has been shut out four times, and has scored three or more runs in just five games during this cold snap. With three more games in Pittsburgh and a weekend series in St. Louis coming up, Chicago is slumping at exactly the wrong time. The NL Central has been the most interesting division in baseball so far this season, and it seems like the standings could look a lot different by the end of this week.

The Phillies had some of their forward momentum derailed last week, losing consecutive series to the Reds and Guardians. Jacob Misiorowski’s run in May has been dazzling, but Cristopher Sánchez has been almost as good; he hasn’t allowed a single run this month and has struck out 36 batters in 32 innings. With Zack Wheeler back in the fold and Jesús Luzardo earning results more in line with his peripherals, the Phillies rotation finally looks like a strength after a rough first month of the season.

Tier 4 – The Muddy Middle
Team Record Elo Opponent Elo Playoff Odds Power Score
Athletics 27-26 1495 1500 42.3% 1497
Twins 26-27 1499 1495 34.5% 1497
Blue Jays 25-28 1498 1494 44.4% 1492
Pirates 27-26 1499 1498 45.9% 1491
Mariners 25-29 1489 1492 65.2% 1484
Nationals 27-27 1490 1510 2.9% 1482
Reds 27-25 1485 1501 13.6% 1480
White Sox 26-26 1480 1495 8.3% 1480
Rangers 24-28 1482 1515 39.5% 1478

After a pretty rough finish to their April, the Twins have mostly stabilized in May. They’ve won four of their last five series, going 10-5 over their last 15 games. But even with the positive results, Minnesota’s roster has been in a state of flux. Ryan Jeffers fractured his hamate bone last week, and the team has demoted both Royce Lewis and Matt Wallner to Triple-A amidst their ongoing struggles. Thankfully, Byron Buxton is healthy and leading the offense; after a bit of a slow start, he’s posted a 188 wRC+ in May with eight home runs.

The Blue Jays starting rotation is being stretched to the breaking point. With Shane Bieber, Max Scherzer, José Berríos, and Cody Ponce all already sidelined, Dylan Cease joined them on the IL on Monday with a mild hamstring strain. It’s not as significant as losing Berríos to Tommy John surgery, but it does thin a rotation that was already struggling to cover innings. Thankfully, the team managed to avoid another major blow on Sunday. Vladimir Guerrero Jr. was pulled from the game after being hit on the elbow by a pitch, but he doesn’t seem to have suffered any lasting damage and should return to the lineup early this week.

The Reds are still trying to rebound from their eight-game losing streak to start the month of May. They’ve gone 8-6 since stopping that slide, but that hasn’t been good enough to keep pace in a competitive NL Central. Still, even if they’re not as good as their incredibly hot start made it seem, a bunch of the key pieces in their core have taken big steps forward this year. Elly De La Cruz is leading the offense with a 143 wRC+, and Chase Burns has been brilliant on the mound. It wouldn’t be surprising to see those two lead the Reds on an exciting playoff chase this summer — and remember, Hunter Greene is on the mend and expected to return around the All-Star break.

Tier 5 – No Man’s Land
Team Record Elo Opponent Elo Playoff Odds Power Score
Red Sox 22-30 1482 1508 26.4% 1472
Marlins 25-29 1480 1507 5.4% 1469
Astros 23-31 1472 1492 13.6% 1462
Giants 22-31 1475 1516 7.9% 1460
Orioles 23-30 1464 1497 20.5% 1455

It looked like the Red Sox had a bit of momentum on their side after sweeping the Royals last week, but they were swept at home by the Twins this past weekend and fell back into the cellar of the AL East. It’s hard to keep pace with the powerhouses in the division when key players like Garrett Crochet and Roman Anthony have been sidelined with injuries. At least Willson Contreras is doing his best to carry the lineup; he collected 11 hits, two triples (!), and two home runs last week.

The Marlins couldn’t do much against the Braves last week, dropping three of four to the NL East leaders, but Miami bounced back by sweeping the Mets over the weekend. It’s been good to see Sandy Alcantara mostly back to his old self, but the most encouraging development on the pitching staff has been the breakout of Max Meyer. After dealing with injuries for the majority of the last few years, he’s posted a 2.52 ERA and a 2.98 FIP in 11 starts this season.

Tier 6 – Running Out of Time
Team Record Elo Opponent Elo Playoff Odds Power Score
Mets 22-31 1470 1488 18.6% 1455
Royals 22-31 1457 1496 17.5% 1447
Tigers 21-33 1431 1498 18.5% 1420

The collapse of the Tigers has been swift. They managed to snap an eight-game losing streak with a win in the second game of a double-header on Sunday, but it was just their third win in 19 games since placing Tarik Skubal on the IL on May 4. Things have gotten so bad in Detroit that Skubal trade rumors have started back up. He’s making an extremely quick recovery from his elbow surgery, and there’s reason to believe he’ll be back on the mound sometime in June. That would give the team about a month or so to really decide if they’re making a run for the playoffs or if they’d be better off trading Skubal and resetting the roster for next year.

Tier 7 – Hope Deferred
Team Record Elo Opponent Elo Playoff Odds Power Score
Angels 20-34 1412 1498 1.2% 1403
Rockies 20-34 1406 1520 0.0% 1394

Since the Rockies swept the Mets back on April 24–26, they’ve won just seven times in 26 games. That sweep had Colorado sniffing .500, but the team is now 15 games under. Mickey Moniak, the guy who had been leading the offense, was placed on the IL last week with a sprained ankle, and while that isn’t as serious as the elbow strain suffered by Chase Dollander a few weeks ago, the two brightest spots on the Rockies roster are now sidelined.


FanGraphs Power Rankings: May 11–17

Last week’s slate of games concluded with Rivalry Weekend, leading to some dramatic games between crosstown and cross-state foes, most notably between the New York teams and the Chicago clubs. Maybe those come-from-behind wins will spark the Mets and White Sox to greater things over the next few weeks.

Our power rankings use a modified Elo rating system. If you’re familiar with chess rankings, you’ll know that Elo is an elegant ranking format that measures teams’ relative strength and is very reactive to recent performance. To avoid overweighting recent results during the season, we weigh each team’s raw Elo rank using our coin flip playoff odds. (Specifically, we regress the playoff odds by 50% and weigh those against the raw Elo ranking, increasing in weight as the season progresses to a maximum of 25%.) The weighted Elo ranks are then displayed as “Power Score” in the tables below. As the best and worst teams sort themselves out between now and October, they’ll filter to the top and bottom of the rankings, while the exercise remains reactive to hot streaks and cold snaps. If you’re looking for a visual representation of the ups and downs of your team throughout the season, look no further than the brand new Power Rankings Board in the FanGraphs Lab.

First up are the full rankings, presented in a sortable table. Below that, I’ve grouped the teams into tiers with comments on a handful of clubs. You’ll notice that the official ordinal rankings don’t always match the tiers — there are times where I take editorial liberties when grouping teams together — but generally, the ordering is consistent. One thing to note: The playoff odds listed in the tables below are our standard Depth Charts odds, not the coin flip odds that are used in the ranking formula. Read the rest of this entry »


FanGraphs Power Rankings: May 4–10

The current standings between the two leagues are quite lopsided entering the second full week of May. Just three teams in the American League have winning records, while all five clubs in the NL Central are above .500. Then again, that division, which was not supposed to be all that strong entering the season, is doing a lot to prop up the National League as a whole; seven of the remaining 10 teams in the Senior Circuit have losing records.

Our power rankings use a modified Elo rating system. If you’re familiar with chess rankings or FiveThirtyEight’s defunct sports section, you’ll know that Elo is an elegant ranking format that measures teams’ relative strength and is very reactive to recent performance. To avoid overweighting recent results during the season, we weigh each team’s raw Elo rank using our coin flip playoff odds. (Specifically, we regress the playoff odds by 50% and weigh those against the raw Elo ranking, increasing in weight as the season progresses to a maximum of 25%.) The weighted Elo ranks are then displayed as “Power Score” in the tables below. As the best and worst teams sort themselves out between now and October, they’ll filter to the top and bottom of the rankings, while the exercise remains reactive to hot streaks and cold snaps. If you’re looking for a visual representation of the ups and downs of your team throughout the season, look no further than the brand new Power Rankings Board in the FanGraphs Lab.

First up are the full rankings, presented in a sortable table. Below that, I’ve grouped the teams into tiers with comments on a handful of clubs. You’ll notice that the official ordinal rankings don’t always match the tiers — there are times where I take editorial liberties when grouping teams together — but generally, the ordering is consistent. One thing to note: The playoff odds listed in the tables below are our standard Depth Charts odds, not the coin flip odds that are used in the ranking formula. Read the rest of this entry »


The Cream of the Marlins Catching Crop Rises to the Top

Dale Zanine and Sam Navarro-Imagn Images

The Marlins have accumulated the fifth-most WAR of any team from their catchers this year. Their backstops have a collective 133 wRC+ at the position, third highest in baseball. This has been one of the team’s biggest strengths to start this season, so it was a bit of a surprise to see Miami make a pretty significant change at the position earlier this week. On Monday, the Marlins optioned Agustín Ramírez to Triple-A, calling up top catching prospect Joe Mack to take his place on the big league roster. The reason why they felt comfortable making this swap has been the standout play of Liam Hicks, the much less-heralded catcher also in his second big league season.

As Miami’s top overall prospect a year ago, Ramírez spent nearly the entire season in the majors. He put up a .231/.287/.413 slash line (91 wRC+) in 136 games as a rookie. Despite the nearly league-average batting line, he accumulated exactly 0.0 WAR because of some pretty atrocious defensive numbers. Per Statcast, he had the second-lowest Fielding Run Value of any catcher with at least 500 innings at the position. He was actually a slightly above-average pitch framer, but his throwing and blocking grades were the worst in baseball.

Through a month of play this year, Ramírez’s bat hasn’t really taken a step forward; his 86 wRC+ is a hair below what he accomplished last season, though the shape of his production looks a little different. His walk rate is nearly four points higher than it was in 2025, but his power output has cratered thanks to a six-point drop in barrel rate. The defense hasn’t improved either, and so the Marlins sent him back to Triple-A to work on his skills behind the plate. Here’s how manager Clayton McCullough put it on Monday:

“It got to the point where it is performance and felt like, especially on the defensive side of things, that while he put in a lot of good work this offseason and had seen some glimpse of things getting better, that part of his game needs to continue to improve to be able to catch up here for us.”

Read the rest of this entry »


FanGraphs Power Rankings: April 27–May 3

It seems like almost every team in baseball is dealing with some sort of injury crisis right now. Of course, key players are bound to get hurt during the long marathon of the regular season, yet these injuries are still having a considerable impact on both the standings and our evaluations of the affected clubs.

Our power rankings use a modified Elo rating system. If you’re familiar with chess rankings or FiveThirtyEight’s defunct sports section, you’ll know that Elo is an elegant ranking format that measures teams’ relative strength and is very reactive to recent performance. To avoid overweighting recent results during the season, we weigh each team’s raw Elo rank using our coin flip playoff odds. (Specifically, we regress the playoff odds by 50% and weigh those against the raw Elo ranking, increasing in weight as the season progresses to a maximum of 25%.) The weighted Elo ranks are then displayed as “Power Score” in the tables below. As the best and worst teams sort themselves out between now and October, they’ll filter to the top and bottom of the rankings, while the exercise remains reactive to hot streaks and cold snaps. If you’re looking for a visual representation of the ups and downs of your team throughout the season, look no further than the brand new Power Rankings Board in the FanGraphs Lab.

First up are the full rankings, presented in a sortable table. Below that, I’ve grouped the teams into tiers with comments on a handful of clubs. You’ll notice that the official ordinal rankings don’t always match the tiers — there are times where I take editorial liberties when grouping teams together — but generally, the ordering is consistent. One thing to note: The playoff odds listed in the tables below are our standard Depth Charts odds, not the coin flip odds that are used in the ranking formula.

FanGraphs Power Rankings
Rank Team W-L Hot/Cold Elo Opp Elo Playoff% Power Score Δ
1 ATL 25-10 ⛵ 1599 1479 95.5% 1603 1
2 NYY 23-11 🔥 1580 1484 98.2% 1584 1
3 CHC 22-12 🔥 🛣️ 1581 1503 83.2% 1581 1
4 LAD 21-13 ❄️ 1578 1486 99.1% 1577 -3
5 TBR 21-12 🔥 1552 1494 62.2% 1555 2
6 SDP 20-13 — 1528 1487 40.7% 1529 -1
7 DET 18-17 🛣️ 1523 1505 74.2% 1521 4
8 STL 20-14 🔥 🛣️ 1520 1500 26.1% 1520 12
9 PIT 19-16 — 1522 1502 59.9% 1519 0
10 CIN 20-14 — 1514 1495 27.6% 1514 -4
11 ATH 18-16 — 1510 1510 39.9% 1510 1
12 MIL 18-15 — 1510 1481 40.7% 1508 3
13 SEA 16-19 — 1504 1494 70.1% 1500 -3
14 TEX 16-18 🛣️ 1502 1527 49.0% 1499 -1
15 ARI 16-17 ❄️ 1503 1526 28.6% 1498 -7
16 CLE 18-17 — 1494 1515 36.5% 1494 0
17 TOR 16-18 🔥 1494 1484 41.5% 1491 0
18 PHI 14-20 🔥 1493 1503 47.5% 1485 7
19 KCR 15-19 🔥 1487 1496 28.3% 1482 2
20 MIA 16-18 🛣️ 1474 1502 11.1% 1470 2
21 BAL 15-19 ❄️ 1473 1493 33.0% 1469 -3
22 BOS 13-21 — 1470 1500 24.1% 1463 -3
23 MIN 15-20 — 1462 1500 20.5% 1459 0
24 CHW 16-18 🔥 1457 1496 2.9% 1456 6
25 SFG 13-21 ❄️ 1463 1514 11.0% 1456 -11
26 NYM 12-22 ❄️ ⛵ 1462 1492 28.1% 1453 -2
27 WSN 16-19 — 1456 1517 0.8% 1451 -1
28 HOU 14-21 — 1453 1479 16.9% 1448 -1
29 COL 14-21 🛣️ 1425 1529 0.1% 1419 0
30 LAA 13-22 ❄️ ⛵ 1413 1499 2.7% 1409 -2
🔥 Elo up >20 pts (last 10) | ❄️ Elo down >20 pts (last 10)
🛣️ Avg opp Elo >1525 (last 10) | ⛵ Avg opp Elo <1475 (last 10)

…

Tier 1 – The Best of the Best
Team Record Elo Opponent Elo Playoff Odds Power Score
Braves 25-10 1599 1479 95.5% 1603
Yankees 23-11 1580 1484 98.2% 1584
Cubs 22-12 1581 1503 83.2% 1581
Dodgers 21-13 1578 1486 99.1% 1577

With a sweep of the Rockies over the weekend, the Braves continued their rampage through the competition. They haven’t lost a series all season long despite facing some significant injury hurdles. Speaking of, Ronald Acuña Jr. was placed on the IL on Sunday with a minor hamstring injury. Thankfully, Sean Murphy and Raisel Iglesias are both on the mend and should be activated off the IL sometime this week.

Aaron Judge and Ben Rice each hit three home runs last week as the Yankees kept setting the pace in the American League. They’ve lost just twice over their last 15 games, and with two key rotation pieces due back from injury soon, it’s possible that they’re about to get even better. Gerrit Cole and Carlos Rodón could rejoin the team this weekend or early next week to bolster a starting staff that already leads the majors in 4.9 WAR by nearly an entire win. One notable player who won’t be returning to the big league roster is Anthony Volpe, who just completed a rehab assignment after undergoing offseason shoulder surgery. The Yankees activated him on Sunday and immediately optioned him to Triple-A. It’s a pretty big vote of confidence in José Caballero and a pointed message to Volpe to work toward earning his way back to the majors.

All of a sudden, the Dodgers’ bats have gone cold. They scored just 16 runs in their six games last week as they went 2-4 against the Marlins and Cardinals. Their offensive struggles actually go back to mid-April; over their last 13 games, they’ve scored 4.2 runs per game, with two 12-run outbursts skewing things a bit. In their 11 other games since April 21, they’ve scored just 2.7 runs per game. Thankfully, the Los Angeles pitching staff has been pretty dominant; the team has allowed the fewest runs in baseball. I’m sure the Dodgers will break out of this funk sooner or later, but until then, things will continue to be pretty tight atop the NL West.

Tier 2 – Paper Tigers
Team Record Elo Opponent Elo Playoff Odds Power Score
Rays 21-12 1552 1494 62.2% 1555
Padres 20-13 1528 1487 40.7% 1529
Cardinals 20-14 1520 1500 26.1% 1520
Reds 20-14 1514 1495 27.6% 1514

After completing a sweep of the Giants over the weekend, the Rays have now won nine of their last 10 games and 16 of their last 21. They’re just 1.5 games behind the Yankees in the AL East, and at 21-12, they boast the second-best record in the AL. Yandy Díaz (158 wRC+) and Junior Caminero (133) have enjoyed strong starts to the season, and the starting rotation has the third-lowest ERA- in baseball. This hot streak has helped the Rays bank a bunch of wins, but they might be out over their skis a bit. Their run differential is just +7, and they’ve outperformed both their Pythagorean and BaseRuns records by three games. Driving this unexpected surge is Tampa Bay’s performance in close games; the team has a 7-1 record in one-run games despite a bullpen that ranks just 21st in ERA-. With all that in mind, the Rays are entering a pretty important stretch that could prove whether they are legitimate contenders, as 19 of their next 22 games come against division rivals.

Like the Rays, both the Padres and Cardinals have outperformed their Pythagorean and BaseRuns records by three games. San Diego seems to be getting by thanks to its lockdown bullpen, though you have to wonder what’s going on with Fernando Tatis Jr. He still hasn’t hit a home run this season, with March/April marking the first homerless month of his career. As for St. Louis, the most encouraging part of the season so far has been the progress of its young hitters. Both Jordan Walker and Alec Burleson collected 11 hits and two home runs apiece last week, and JJ Wetherholt is leading all NL rookies in WAR.

The biggest paper tiger of them all has been the Reds. They’ve outperformed their Pythagorean and Base Runs records by a whopping six games. Their three blowout losses last week didn’t help their run differential either. Nick Lodolo is set to be activated off the IL this Friday, which should give the starting rotation a bit of a boost. After getting swept by the Pirates over the weekend, Cincinnati heads to Chicago for a huge four-game divisional battle against the Cubs, beginning Monday night.

Tier 3 – Solid Contenders
Team Record Elo Opponent Elo Playoff Odds Power Score
Tigers 18-17 1523 1505 74.2% 1521
Pirates 19-16 1522 1502 59.9% 1519
Athletics 18-16 1510 1510 39.9% 1510
Brewers 18-15 1510 1481 40.7% 1508

The Tigers and A’s treaded water last week, both going 3-3. That was good enough to stay atop their respective divisions, though neither team is really pulling away from the pack. As for the Pirates, they bounced back after a rough four-game sweep at the hands of the Cardinals by sweeping the Reds this past weekend. The NL Central has continued to be the toughest division in baseball; Pittsburgh is tied for last place despite being three games over .500.

The Brewers are the other team at the bottom of the Central, though they have the best run differential in the division. There’s a lot happening on the injury front in Milwaukee. Brandon Woodruff hit the IL with shoulder inflammation last week, and on Friday, Jacob Misiorowski had to depart his start early — he was in the middle of a no-hitter — with a hamstring issue. Thankfully, it sounds like neither issue is very serious. The Brewers should also soon benefit from the return of two key offensive contributors. First baseman Andrew Vaughn is set to be activated off the IL on Monday, and outfielder Jackson Chourio shouldn’t be too far behind, even after he suffered a minor setback when he fouled a ball off his foot on Saturday. Fresh off series wins against the Diamondbacks and Nationals, the Brewers have two tests ahead of them with series against the Cardinals and Yankees this week.

Tier 4 – The Melee
Team Record Elo Opponent Elo Playoff Odds Power Score
Mariners 16-19 1504 1494 70.1% 1500
Rangers 16-18 1502 1527 49.0% 1499
Diamondbacks 16-17 1503 1526 28.6% 1498
Guardians 18-17 1494 1515 36.5% 1494
Blue Jays 16-18 1494 1484 41.5% 1491
Phillies 14-20 1493 1503 47.5% 1485
Royals 15-19 1487 1496 28.3% 1482

There’s a big group of AL teams hovering around .500 in this tier. Both the Mariners and Rangers went 2-4 last week, sliding another game back in the thoroughly mediocre AL West. The Guardians went 3-3 against the Rays and A’s last week, managing to keep pace with the Tigers in the AL Central. The big news in Cleveland was the promotion of Travis Bazzana on Tuesday; he collected his first big league hit on Saturday and added two more on Sunday. As for the Blue Jays, they went 4-3 last week and are slowly climbing out of their early-season hole. Kazuma Okamoto led the way over the weekend, blasting four home runs in three games against the Twins.

The Phillies became the second team in as many weeks to fire their manager, dismissing Rob Thompson on Tuesday. It’s unclear whether midseason firings truly provide a wake-up call for teams, or if the struggling teams just see some positive regression, but regardless of the cause here, the Phillies started winning under interim manager Don Mattingly. They swept the cratering Giants and then won two of their first three games in a four-game wraparound series against the Marlins. Those four wins last week equaled what Philadelphia had earned across the previous three weeks combined. It’s small progress for a team that’s still hoping to make some noise in the NL Wild Card race this summer.

The Royals got off to a strong start in May, sweeping the Mariners this past weekend. Their star trio of Bobby Witt Jr. (108 wRC+), Maikel Garcia (107), and Vinnie Pasquantino (72) has underperformed at the plate this season, though there have been some signs of life recently. Pasquantino collected five hits and a home run in that series in Seattle, and Garcia had eight hits — five for extra bases — last week. Meanwhile, after catching fire for most of the second half of April, Witt cooled off some last week. Kansas City faces a pretty critical stretch this week, with the Guardians and Tigers coming to town for series that could shuffle up the AL Central standings.

Tier 5 – Floundering
Team Record Elo Opponent Elo Playoff Odds Power Score
Marlins 16-18 1474 1502 11.1% 1470
Orioles 15-19 1473 1493 33.0% 1469
Red Sox 13-21 1470 1500 24.1% 1463

As if things couldn’t get worse for the Red Sox, they placed Garrett Crochet on the IL with shoulder inflammation last week. It doesn’t seem like a serious issue, but the team now has six starters currently out hurt, a group that doesn’t include Ranger Suarez, who exited his start on Sunday in the fifth inning with hamstring tightness. It sounds like Suarez should be fine, but Boston cannot afford to lose anyone else to injury right now.

Tier 6 – No Man’s Land
Team Record Elo Opponent Elo Playoff Odds Power Score
Twins 15-20 1462 1500 20.5% 1459
White Sox 16-18 1457 1496 2.9% 1456
Giants 13-21 1463 1514 11.0% 1456
Mets 12-22 1462 1492 28.1% 1453
Nationals 16-19 1456 1517 0.8% 1451
Astros 14-21 1453 1479 16.9% 1448

The White Sox had a five-game winning streak snapped on Sunday, a surge that helped them clamber to within a few games of .500. In fact, they’ve won 10 of their last 15 games, and suddenly look fairly competent as a ballclub. Munetaka Murakami continues to blast home runs, and Colson Montgomery is trying to match him homer for homer. The bigger storyline during this stretch has been the pitching staff. Chicago has allowed just 3.9 runs per game over its last 15 games, with the unheralded Davis Martin leading the way. He’s given up just one run in each of his last three starts.

The Giants just endured a week from hell. They were swept by both the Phillies and Rays, got shutout twice, lost both legs of a doubleheader on Thursday in walk-off fashion, and suffered another walk-off loss on Sunday for good measure. They managed to score just nine runs in six games and did not hit a home run on this road trip. Things are getting ugly in San Francisco, though there are some positives to cling to: Landen Roupp has taken a big step forward (or to the side) on the mound, and Luis Arraez has played surprisingly good defense at second base. Still, a shake-up is desperately needed to get this team back on track. To that end, the Giants are promoting prospects Bryce Eldridge and Jesus Rodriguez on Monday to hopefully jumpstart the offense.

Two more Mets hit the IL last week: Luis Robert Jr. and Ronny Mauricio, bringing the team total to 12. New York did manage to win its series against the hapless Angels over the weekend. The Astros also won their weekend series against the Red Sox, capping things off with an extra-innings win on Sunday. Neither series win should be seen as a triumph, but it’s definitely forward progress for the two beleaguered teams.

Tier 7 – Hope Deferred
Team Record Elo Opponent Elo Playoff Odds Power Score
Rockies 14-21 1425 1529 0.1% 1419
Angels 13-22 1413 1499 2.7% 1409

Remember when the Angels were playing really entertaining baseball, going toe to toe with the Yankees? They’ve lost 12 of their last 15 games since that series in New York and have fallen all the way to the bottom of the AL standings. To make matters worse, Yusei Kikuchi and Logan O’Hoppe were placed on the IL last week. It’s not all bad: Mike Trout (a 168 wRC+) and Jorge Soler (120) continue to mash, but the supporting cast for those two sluggers has been severely lacking.


FanGraphs Power Rankings: April 20–26

May is just around the corner, which means that some of the early-season slumps and hot streaks we’ve seen around the league are starting to take on a bit more meaning. For a few struggling would-be contenders, drastic measures might be needed in order to turn things around.

Our power rankings use a modified Elo rating system. If you’re familiar with chess rankings or FiveThirtyEight’s defunct sports section, you’ll know that Elo is an elegant ranking format that measures teams’ relative strength and is very reactive to recent performance. To avoid overweighting recent results during the season, we weigh each team’s raw Elo rank using our coin flip playoff odds. (Specifically, we regress the playoff odds by 50% and weigh those against the raw Elo ranking, increasing in weight as the season progresses to a maximum of 25%.) The weighted Elo ranks are then displayed as “Power Score” in the tables below. As the best and worst teams sort themselves out between now and October, they’ll filter to the top and bottom of the rankings, while the exercise remains reactive to hot streaks and cold snaps. If you’re looking for a visual representation of the ups and downs of your team throughout the season, look no further than the brand new Power Rankings Board in the FanGraphs Lab.

First up are the full rankings, presented in a sortable table. Below that, I’ve grouped the teams into tiers with comments on a handful of clubs. You’ll notice that the official ordinal rankings don’t always match the tiers — there are times where I take editorial liberties when grouping teams together — but generally, the ordering is consistent. One thing to note: The playoff odds listed in the tables below are our standard Depth Charts odds, not the coin flip odds that are used in the ranking formula. Read the rest of this entry »


Nico Hoerner Pulls off One of the Oldest Tricks in the Book

Nathan Ray Seebeck-Imagn Images

When the Cubs signed Nico Hoerner to a six-year contract extension on Opening Day, they knew exactly what they were getting. You see, Hoerner has been remarkably consistent throughout his career; over his four full seasons in the majors, his wRC+ has had a peak of 109 and a low of 102, to go along with sterling defensive metrics. His seasonal WAR marks during that four-year span have ranged from 3.8 to 4.8. The only reason why this isn’t a five-season sample is because, in 2021, three separate IL stints curtailed his campaign to just 44 games. In those 44 games, though, he put up a 106 wRC+ and 1.6 WAR.

However, the Nico Hoerner that has showed up to play this year isn’t the same as before. He’s still playing excellent defense at an up-the-middle position, but he’s also rocking a .320/.393/.515 slash line (a 156 wRC+) with four home runs, meaning that in just 24 games, he’s already nearly halfway to his career high of 10, set back in 2022. Last week, he racked up nine hits, two home runs, and two stolen bases to earn NL Player of the Week honors. It’s still early in the season, but there are enough underlying changes in Hoerner’s performance that it’s worth digging into how he’s been able to power up this year. Read the rest of this entry »