FanGraphs Prep: Regression Towards the Mean
This is the sixth in a series of baseball-themed lessons we’re calling FanGraphs Prep. In light of so many parents suddenly having their school-aged kids learning from home, we hope is that these units offer a thoughtfully designed, baseball-themed supplement to the school work your student might already be doing. The first, second, third, fourth, and fifth units can be found here, here, here, here, and here.
Overview: A one-week unit centered around understanding the concept of regression to the mean. This can be a difficult concept to grasp but it’s important for any aspiring statistician to understand.
Learning Objectives:
- Explain the difference between “true talent” and a statistic.
- Use algebra to calculate probabilities.
- Estimate future performance using a projection.
- Identify and apply Regression to the Mean.
Target Grade-Level: 9-10
Daily Activities:
Day 1
Strat-O-Matic is a two-player card-based baseball game. You start by making lineups and then play out a series of batter-pitcher matchups like the one below between Mike Trout and Clayton Kershaw.
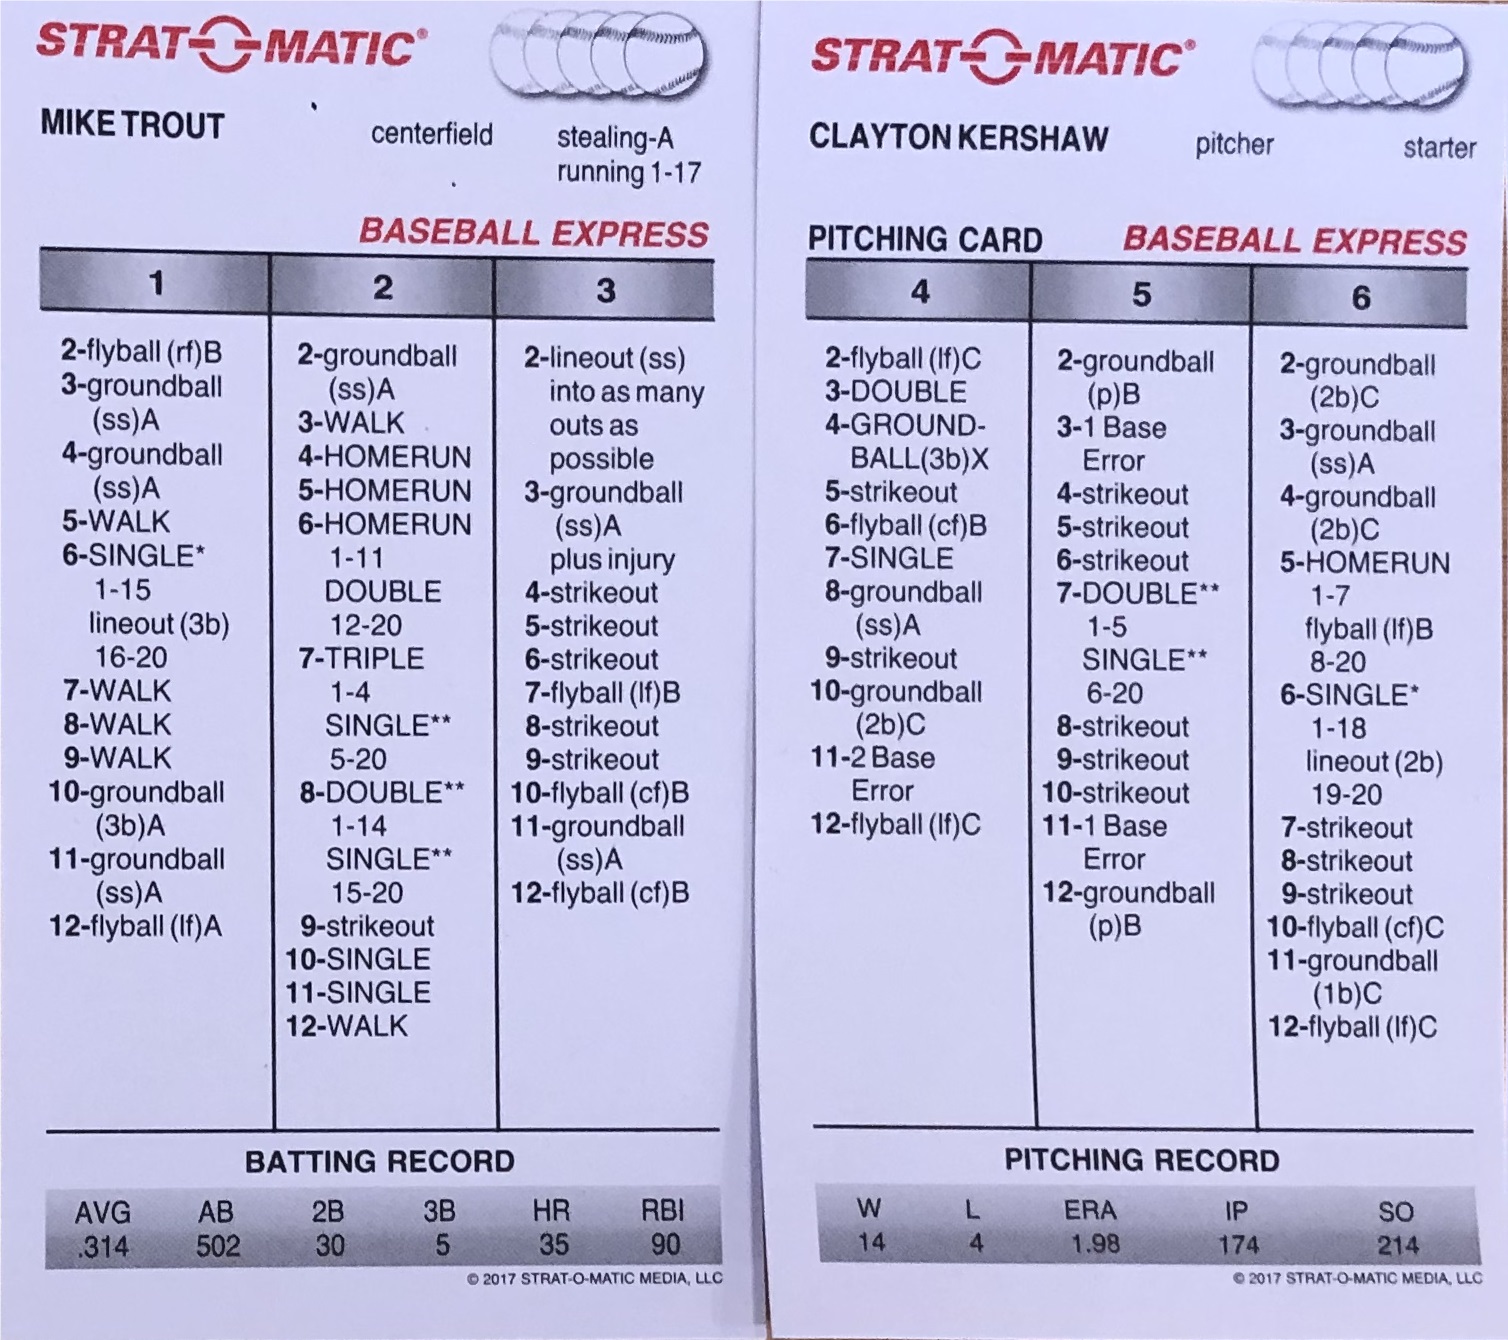
Each matchup involves rolling three six-sided dice. The first one tells you which column to use and the next two determine the outcome, although sometimes we will need to roll an additional 20-sided die. For instance, if the first die roll is a 1, we’ll direct our eyes to the left-most column on Trout’s card. If the next two dice add up to 7, Trout has worked a walk. Read the rest of this entry »