Author Archive

There’s a New Old Book on Christian Yelich

By now, I’m sure you’re aware of Yasmani Grandal’s odd season. We’re approaching the All-Star Game, yet the veteran catcher still has an unbelievably low batting average (.177) to go along with a stellar wRC+ (131). The juxtaposition encapsulates everything useful or wrong about modern baseball, depending on whom you ask.

Regardless, it works because while Grandal does strike out a fair amount, he also walks just as often – at a league-leading rate, in fact. But enough about Grandal. This is all a set up, because really, I want to talk about Christian Yelich. Why is he relevant? Yelich is one of two hitters (min. 150 PA) this season to have both a strikeout and walk rate above 20% – you can guess who the other is. Grandal’s season is, indeed, weird. But under the radar, Yelich is showcasing the same skills necessary for one, albeit without the hideous BABIP.

Focusing on the more positive rate first, it appears that Yelich’s monstrous walk rate is thanks to an ability to lay off unattractive pitches; his chase rate this season ranks in the 98th percentile per Baseball Savant. But here’s what piqued my curiosity. The other day, I stumbled across an article in Reviewing the Brew that suggested Yelich is seeing fewer pitches in the zone since last season. While true in the aggregate, looking at 2020-21 as one chunk prevents us from unearthing a notable truth. Let’s get to the bottom of it. Below is a rolling average graph showing Yelich’s zone rate over time, beginning a couple of years ago:

Consider the roller coaster ride. Before his transformation into a destroyer of baseballs, Yelich saw an above-average rate of strikes. That rate remained stable into his 2018 MVP campaign, perhaps because pitchers were caught off-guard by his late-season tear. The following year, though, they got the memo. In response to Yelich’s newfound might, the graph illustrates how pitchers began to shy away from the zone.

So far, so sensical. What’s interesting, however, is that the downward trend continued into 2020, despite Yelich battling through an extended slump that resulted in the worst season of his career by wRC+. At the very least, he seemed to take advantage of the increasing abundance of balls. As Tony Wolfe pointed out last year, Yelich effectively turned into Joey Gallo by cutting down his swing rate from 45.2% in 2019 to 34.6% in ’20. Unfortunately, his whiff rate – even against in-zone pitches – trended in the wrong direction, pushing up both walks and strikeouts.

Now it’s 2021. As I alluded to earlier, Yelich is still a patient hitter, and his 38.2% swing rate also suggests that he’s retained most of his 2020 self. The difference? His zone rate (48.0%) has skyrocketed this season, to the point where it’s similar to that of previous years (50.8% in 2018).

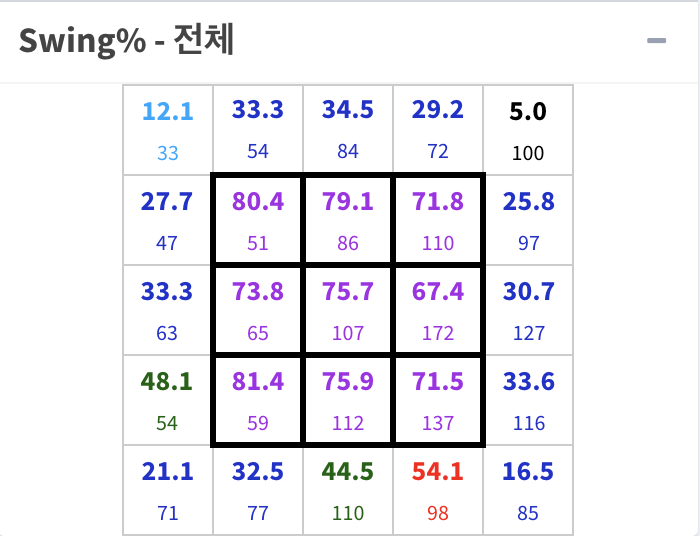
More strikes, but with the same passive approach – that seems like a recipe for disaster. But as of this writing, Yelich possesses the highest walk rate of his career. He’s managed to shave off a bit of his strikeout rate, too. That’s been possible because of how pitchers have allocated their extra strikes. Here’s a plot of Yelich’s yearly zone rate since 2017 by count type (ahead, even, or behind), from which we can gain some insight:

When Yelich is ahead in the count this season, his zone rate hasn’t seen a significant increase. Maybe pitchers are reluctant to challenge him – their escape is via a surefire strike, which Yelich has crushed multiple times in his career. It’s better to nibble around the edges, I suppose. Elsewhere, though, pitchers have caught on. The strikeout totals aren’t that hideous because Yelich’s contact rates have rebounded somewhat, but they’re still a few ticks below their pre-pandemic norms.

It’s a problem. More than ever, Yelich is having a difficult time defending himself against a barrage of strikes in unfavorable situations. Sean Doolittle, seemingly aware of this, threw a fastball down the middle against Yelich for… strike three.

Look at that smirk. He knows what he did!

But besides that example, how has Yelich responded overall? Compared to 2020, his swing rates are up across all counts. That’s good when he’s behind, and not as good when he’s ahead, though it could be that he’s targeting obvious strikes. Either way, Yelich is earning his walks. Looking at the numbers, however, I began to wonder – should Yelich become even more aggressive when behind? His swing rate in those instances is up, sure. But at 39.8%, it’s still lower than the 48.2% he posted in 2018, the year when he last saw a similar rate of strikes.

Let’s try and evaluate Yelich’s swing decisions using basic game theory. Consider a showdown between him and a pitcher with the count 0-and-1. What should each player strive to accomplish? For the pitcher, the best-case scenario is reaching 0-and-2. Since the start of the Statcast era, batters have recorded a .357 wOBA on 0-and-1; with an additional strike, that number drops precipitously to .166. Missing the zone en route to 1-and-1 isn’t as bad one might think, as batters pick up just 17 points of wOBA. It’s no wonder they’re considered behind.

On the other end, Yelich’s utmost goal is to avoid reaching 0-and-2. But to swing or to take, that is the question. Swinging seems like the most logical option, but there’s a good chance Yelich will end up whiffing or fouling off the pitch. Taking a strike isn’t the end of the world, but there are also obvious balls a hitter should never go after. And what about the borderline pitches that could go either way? Hitting is hard!

Amidst a hairy situation, here’s what I did. Based on Yelich’s contact, whiff, and foul rates this season, I calculated the average value of an in-zone swing in terms of wOBA, as well as an out-of-zone swing. The value of taking a strike or ball was based on the count-based wOBAs I described earlier. With these numbers, I was able to construct a two-by-two payoff matrix, with each cell containing the wOBA loss/gain of the pitcher (left of the comma) and the batter (right of the comma) that’s dependent on the actions taken:

Pitcher vs. Yelich in 2021, 0-1 counts
Pitcher/Hitter Swing Take
Strike -38, 38 191, -191
Ball 109, -109 -17, 17
SOURCE: Baseball Savant
wOBAs converted into whole numbers for ease of viewing

For example, swinging at a strike would net Yelich 38 points of wOBA and lose pitchers the same amount. The latter are offering Yelich a strike 39% of the time in 0-and-1 counts. But is this optimal? For our sake, let’s say optimization means pitchers throw strikes at a rate that makes Yelich indifferent to swinging or taking. In other words, equalizing the payoffs robs him of a preference. Do the math, and it turns out the equilibrium point for pitchers is 35.5% strikes – quite close to their actual rate.

We can also find an equilibrium point for the hitter, Yelich. This time, it’s a matter of making sure pitchers are indifferent to throwing a strike or a ball, and the math suggests Yelich needs to swing 58.6% of the time in pursuit of that goal. Sounds too high? It probably is: I sorted all 0-and-1 pitches into simple strikes or balls, but as mentioned earlier, the reality is that a fair number of balls are flat-out uncompetitive pitches. Disregard them, and Yelich’s ideal swing rate is deflated. Even if we conservatively estimate it as 50%, however, it’s still a far cry from Yelich’s actual swing rate of 39.3% in 0-and-1 counts. Small sample caveats apply – he’s seen 84 of them so far this season – but there’s potential evidence that Yelich is missing out by letting strikes pass by.

Here’s an easier way to think about this. After factoring in zone rate, Yelich is expected to lose 50 points of wOBA by swinging. Taking a pitch loses 66 points, also bad, but which one is the lesser of two evils? You certainly wouldn’t want to swing every time, but faced with these payoffs, swinging a majority of the time makes sense. The math bears out our intuition.

For fun, I repeated the process using Yelich’s ridiculous 2019 output. Ready? To neutralize Yelich, pitchers needed to throw strikes roughly 20% of the time! Nobody would have followed that advice, of course, but it goes to show how terrifying Yelich was. He crushed pitches in the zone. He crushed pitches outside the zone, too, even when behind in the count.

It’s the version of the slugger we lament the disappearance of. But all things considered, it’s been a rough two-or-so years for Yelich. His 2019 campaign came to a premature halt after a knee injury, which then segued into a truncated, strange 2020 season. Mere days into the current season, back issues sent Yelich to the Injured List, where he remained for a month. Expecting him to attack the ball with his former authority is a bit unreasonable. And arguably, Yelich’s reluctance to swing is a precaution against re-aggravating his back.

But as far as adjustments go, raising his aggression to match that of pitchers, who are adhering to both a new and old book on himself, is a simple one. As Yelich recuperates, the various components of his game are likely to come together. It’ll be interesting to observe how he and opposing pitchers adjust against each other over the course of an entire season, engaging in a dance of zero sums. How high will Yelich’s zone rate climb? At what point does he swing enough for pitchers to change course and offer more balls instead? This piece’s title suggests the book on him is fixed. In reality, it’s constantly being updated.


What’s Up With Nolan Arenado’s Defense?

Heading into 2021, the question that loomed over Nolan Arenado concerned his bat. Could he remain productive outside of Coors Field? Roughly 40% into the season, the answer seems to be yes. Although his on-base and slugging percentage are down, handy wRC+ tells us that Arenado’s offensive output relative to the environment he’s in has remained consistent. On this front, he has been the star the Cardinals had hoped for.

On the other hand, I’m willing to bet good money that nobody was worried about Arenado’s glove. Altitude doesn’t affect one’s footwork or agility. We expected him to continue his life as one of the league’s best third basemen. And all things considered, he still is one of the league’s best third basemen. What follows isn’t the sound of panic, but rather a fact to keep in mind. Consider Arenado’s defensive numbers this season:

Arenado’s Defensive Numbers, 2016-21
Year Innings DRS UZR OAA
2016 1377.1 13 3.3 14
2017 1343.1 17 6.7 9
2018 1328.1 12 5.8 11
2019 1319.2 24 10.3 21
2020 417.1 11 8.5 7
2021 600.0 3 1.0 0

They’re… okay. Huh. That being average elicits this sort of reaction is a paean to Areando’s talent. When the three big defensive metrics all agree that his defense has taken a step back, though, you have to wonder – what’s going on? He’s no pumpkin at the hot corner, but he’s also not the superstar we’ve become accustomed to. Prorate his 2021 DRS to his 2019 workload in terms of innings fielded, and you’d wind up with 7 DRS after rounding up. That would represent the lowest mark of his career. Defensive metrics are imperfect and noisy, sure, but confronted with these changes, there’s probably some signal worth analyzing.

For this article, I’ll be focusing on Baseball Savant’s Outs Above Average. Our in-house metric is UZR, but it unfortunately doesn’t account for infield shifts, which will become relevant later on. Read the rest of this entry »


Reports of the Sinker’s Death Have Been Exaggerated

In 2018, an article by FanGraphs alum Travis Sawchik came with an ominous title: “Go See the Two-Seamer Before It’s Gone.” His instruction alluded to a still-ongoing trend within MLB, whereby numerous pitchers abandon their two-seamers and sinkers in favor of high-spin four-seamers thrown up in the zone. Its impetus boils down to a couple key developments. For one, teams and pitchers wanted to counter batters who adjusted their swing planes to elevate low pitches. They also realized that high fastballs are useful at inducing whiffs, regardless of batters’ tendencies. Furthermore, those fastballs paired well with the breaking ball shapes and locations teams began to covet around the same time.

All in all, the stage was set for a league-wide revolution. You’ve read the stories of how Gerrit Cole and Tyler Glasnow blossomed into superstars using high fastballs. Conversely, you’ve heard the story of how forcing the sinker upon Chris Archer aggravated his struggles. You might have also encountered stories connecting this trend to the recent uptick in strikeouts. The validity of these reports aside, they helped cement a narrative: the four-seamer was in, and the sinker was out.

Three years later, the league doesn’t seem to have veered away from it. Pitchers have located 20% of four-seam fastballs in the upper-third of the zone this season, the highest rate of the Pitch Tracking era (2008 onwards). Meanwhile, two-seamer/sinker usage is the lowest it’s ever been.

Read the rest of this entry »


The Rangers Are Winning the Framing Game

It feels like this season, umpires are under more scrutiny than ever before. Part of that might be because we’ve grown tired of the inconsistency that comes with human umpires, while another part could be access to more information, such as data on individual umpires’ accuracies.

On the sabermetric side, research on umpire performance has yielded mixed results. In April, our Ben Clemens examined whether the strike zone had changed and found no difference compared to previous seasons (though he noted that might not be very satisfying to frustrated fans). Recently, over at Baseball Prospectus, Rob Arthur concluded that the issue wasn’t the rate of wrong calls, but rather their magnitude. In other words, umpires are messing up in high-leverage situations. But is this because of umpires succumbing to pressure? Or just variance? The “why” component still eludes us.

In the midst of all the umpire-related hoopla, though, it seems like we’ve overlooked the importance of pitch framing. Until robot umpires come along, the art of presenting would-be balls as strikes (and making sure strikes don’t turn into balls) will remain relevant. This season’s umpires have been inconsistent, sure, but it’s undeniable that a certain amount of agency belongs to skillful catchers. Read the rest of this entry »


How the Marlins Pitching Staff Stands Out

I like the Marlins pitching staff. There’s a certain charm to a rotation that mostly consists of farm-grown talent, and it’s a powerhouse, too. Sandy Alcantara and Trevor Rogers have become two of the league’s more reliable starters by virtue of their electric stuff, with room for further growth. The bullpen is home to a diverse group of relievers whose idiosyncrasies are so irresistible that we’ve written about a member of Miami’s relief corps not once, but twice – and it’s not even the offseason! Collectively, the Marlins ‘pen has accrued 2.7 WAR, good for fourth-best in the majors.

Rarely is there one reason for success like this. In all likelihood, the Marlins have excelled at pitching because they just happen to roster good pitchers. With teams increasingly tailoring plans to the needs of individual pitchers, team-wide dogmas and philosophies are harder to find. So what follows isn’t an explanation. Rather, it’s a series of observations I find noteworthy. Up first, here’s a graph showing each team’s average vertical break on its four-seam fastball (abbreviated as “fastball” from here on):

Though the gap between first and last is only a couple of inches of movement, we can still glean certain teams’ preferences. For example, teams like the Dodgers, White Sox, and Yankees have a predilection for fastballs that generate ample ride. You know the drill – throw them up in the zone and chances are hitters will swing and miss. It’s a tried and true approach. Read the rest of this entry »


Keeping Up With the KBO: May, Part Two

This is Part Two of the May edition of my monthly column in which I recap what’s been going on in the Korean Baseball Organization on both a league- and team-wide scale. In case you missed it, Part One discussed league-wide trends, then covered the SSG Landers, LG Twins, Samsung Lions, and NC Dinos. Today’s post will cover the remaining six teams. If you have any questions, feel free to leave them as comments or reach out to me via Twitter. Without further ado, let’s talk some KBO!

Team Notes

KT Wiz

If there was any doubt regarding Baek-ho Kang 강백호’s superstar status, this season has blown it away. Through 52 games, the young first baseman is batting over .400. He’s second in the league in wRC+ and first in Batting WAR. What’s his secret? Kang doesn’t have overwhelming raw power – our Eric Longenhagen assigned it a 55 grade – but he’s consistent enough with what he has to sustain a high BABIP. He’s also extremely picky during at-bats, fouling and taking unfavorable pitches before pouncing on one he likes. Here’s a graphical representation of his swing decisions last season (courtesy of Statiz):

That’s some excellent selective aggression. Kang’s swing rates are in the 80s on in-zone pitches, but they drop dramatically on anything outside. He’s seeing and hitting the ball so well that in one game, the Lotte Giants introduced an extreme infield shift covering Kang’s pull-side. And what does he do? Why, he executes two perfect bunts the other way for hits, of course. Later that game, he deposited an 88 mph fastball into right field to go 3-for-5 overall. At this point, Kang’s defense is his only weakness. I think he ends up as a DH if he decides to tackle major league baseball, but he’ll mash enough to be at least a solid regular. Read the rest of this entry »


Keeping Up With the KBO: May, Part One

This is Part One of the May edition of my monthly column, in which I recap what’s been going on in the Korean Baseball Organization on both a league- and team-wide scale. In case you missed them, be sure to check out Parts One and Two of my April recap. If you have any questions, feel free to leave them in the comments or reach out to me via Twitter. Also, don’t forget to check out our expanded KBO stats offering!

Without further ado, let’s talk some KBO.

Standings

KBO Standings, 6/8/21
Team W-L Pct. GB
SSG Landers 29-22 .569 0.0
LG Twins 30-23 .566 0.0
Samsung Lions 30-23 .566 0.0
KT Wiz 28-23 .549 1.0
NC Dinos 27-24 .529 2.0
Doosan Bears 27-24 .529 2.0
Kiwoom Heroes 26-28 .481 4.5
Kia Tigers 21-30 .412 8.0
Hanwha Eagles 21-31 .404 8.5
Lotte Giants 20-31 .392 9.0
SOURCE: Naver Sports

League Trends

The League Has Split Into Two Groups

As evidenced by the standings, we’re starting to see a division between the contenders and the bottom-dwellers. The Landers, Twins, Lions, Wiz, Dinos, Bears, and Heroes are all within a few games of each other, while the Tigers, Eagles, and Giants have fallen behind.

Still, this is weird. There’s usually an even gap between each team; rarely does the league split into clear haves and have-nots. The parity of the first month or so has simply been partitioned into two groups, with teams fighting for the upper hand as we enter the heat of summer. It’s good fun, and I especially enjoy the Korean media’s attempts at celebrating the ascendance of team X, only for team Y to dethrone it the next week.

So who ultimately joins the group of five headed for the playoffs? It’s early, but I’d pick (in no particular order) the Dinos, Twins, Bears, and Wiz, with a toss-up between the Lions and Heroes for the final spot. Next, it’s time to check on the individual teams. Have they been good? Bad? Just hanging in there? Find out below:

Team Notes

SSG Landers

When I first wrote about the Landers, I blasted them for hogging the fifth place spot with a shoddy run differential. One month later, they’re in first. Nostradamus, I am not. The run differential is still negative, but it’s better than before – I’ll give them credit for that. All-Star third baseman Jeong Choi 최정 went on an absolute tear in May, slashing .357/.495/.743 with seven home runs. I underestimated Wilmer Font 폰트 in my initial recap, but he’s blossomed into an ace. Here’s footage from his most recent start, in which he struck out 12 and didn’t issue a walk:

As the GIF shows, Font’s repertoire is anchored by a fastball that touches 98 mph and a 12-6 curveball with massive vertical drop. He throws a slider, too, which looks average at best but does generate whiffs. He drastically reduced his sinker usage in recent starts in favor of the four-seamer, which could explain the uptick in strikeouts. Barring a sudden collapse, Font looks to be the Landers’ No. 1 starter moving forward.

But the team isn’t without strife. After removing himself from a start due to right elbow pain, submariner Jong-hun Park 박종훈 flew to LA to receive a diagnosis from Dr. ElAttrache (uh-oh). The Landers have replaced foreign pitcher Artie Lewicki, whose health issues became apparent, with Sam Gaviglio. So at least for now, the team lacks two reliable starters.

Meanwhile, I want to direct your attention towards Shin-Soo Choo 추신수’s .268/.427/.451 line. After posting an uncharacteristically low BABIP in April and parts of May despite hard contact, Choo’s batted balls have begun to land for hits. He isn’t hitting for consistent power, a fact that’s garnered criticism. It seems unjustified, though; his career slugging percentage stateside was .447. Choo’s value lies in his plate discipline, and it’s been on full display en route to a 143 wRC+. He’s doing his best.

LG Twins

Most of what I wrote about the Twins last month is still relevant: The bullpen is excellent, and while Roberto Ramos 라모스 is finding his footing, this is still one of the league’s best teams. Since then, they’ve become even better. I noted that the rotation beyond Andrew Suárez and Casey Kelly 켈리 was bare. But Woo-chan Cha 차우찬, who hadn’t pitched for nearly a year due to injuries, made a successful comeback with five scoreless frames. Twenty-year-old Min-ho Lee이민호 has settled in as a fifth starter, and veteran righty Chan-heon Jeong 정찬헌 has been solid with a 4.42 FIP.

In addition, I’m surprised by how useful the team’s depth has become. Bo-gyeong Moon 문보경 was called up this season to share first base with Ramos, and it’s Moon’s ability to draw walks that has mitigated the position’s weakness. The Twins have two fantastic options at right field. Hyung-jong Lee 이형종 is a consistent pull-hitter with 20 home run potential, and Eun-seong Chae 채은성 has a 144 wRC+ this season via a higher rate of line drives.

Rhe Twins also have breakout stars who are continuing their success in 2021. The most notable example is outfielder Chang-ki Hong 홍창기. After playing in just 38 games from 2016-19, he became the team’s everyday center fielder in 2020 and excelled, posting a 126 wRC+. Similar to Moon, his greatest asset is plate discipline, and it’s scary to think it might have improved. Hong has 43 walks against 27 strikeouts this season, for an on-base percentage of .457; that’s third-best in the league. The team as a whole has the KBO’s highest strikeout-to-walk ratio, hinting at an organizational philosophy.

Samsung Lions

The Lions have followed up on their torrid April start, and they don’t seem out of place at third. That being said, I’m slightly worried that cracks will begin to form. For example, I do think Tae-in Won 원태인 is legitimately good, but batters are figuring out his changeup and are making more contact against it. Jose Pirela and Minho Kang 강민호 have the team’s best and third-best wRC+ respectively, but it seems like their production has been driven by grounders, which is less ideal even in the KBO.

David Buchanan 뷰캐넌 has been a rock solid ace. The team hoped for Chae-heung Choi 최채흥 to successfully rejoin the rotation, but a few disastrous starts have shown that he’s nowhere near ready; it could be that the effects of his injury still linger. Speaking of injury, the Lions signed Mike Montgomery to a one-year deal after it became necessary for Ben Lively 라이블리 to undergo surgery on his shoulder. It’s a decision that should have fans excited given Montgomery’s pedigree. I’m also optimistic about his pitching style, which prioritizes soft contact over strikeouts and reminds me of Aaron Brooks or Eric Jokisch.

In the bullpen, Seunghwan Oh 오승환 is still closing out games despite a heater that now averages 90 mph. He’s been effective, too, with a 2.57 ERA and 3.42 FIP. The longevity of his career is awe-inspiring, and I hope he has a few years left in the tank – watching him lob fastballs down the pipe is a can’t-miss KBO experience. He’s accompanied by 36-year-old Kyumin Woo 우규민, who has technically been the Lions’ best relief arm. It’s great to see the former-starter-turned-reliever receive the spotlight.

NC Dinos

See, there’s no need to worry about our swole daddy overlords. The Dinos are just two games behind first, with more runs scored than any other team. Among the many standouts in the Dinos’ lineup, Euiji Yang 양의지 deserves his own paragraph. First, his offensive line is ridiculous: .360/.475/.646, which works out to a 196 wRC+. Here are some frequently asked questions about him:

  • Is he a first baseman or a designated hitter? He’s a catcher, though he does occasionally DH to preserve his strength.
  • Does that mean his defense is lacking? Several pitchers, including foreigners, have praised his ability to call games.
  • He must be in his prime then, right? About that – Yang turned 34 this year. Overall, if you fused Joe Mauer’s contact, Mike Piazza’s power, and Yadier Molina’s defense into one athlete, the end result would be Euiji Yang. He struck out once in May while slugging above .700. As a 34-year old catcher.

But enough fanboying on my end. Once again, the pitching has been an issue for this team, though it’s at least looking up. Min-hyeok Shin 신민혁, who I covered last month, has indeed become a reliable starter. Wes Parsons’ pre-season injury didn’t lead to a dramatic decline in performance; his FIP (3.31) is lower than his ERA (4.13) and that, along with an elite strikeout rate (by KBO standards) of 27.1%, suggests that he can be a No. 2 starter.

The Dinos snagged last-standing free agent pitcher Yongchan Lee to bolster their bullpen, which is currently seventh in WAR. And best of all, after multiple setbacks and murky progress reports, Chang-mo Koo 구창모 finally appeared in a one-inning rehab start. His velocity was down as expected, but manager Dong-wook Lee 이동욱 expressed his satisfaction with the outing. If Koo can recapture some of the magic of his 2020 campaign, that’s one less worry for the Dinos.

Part Two to come!


The Good and Bad News About Freddie Freeman

On Wednesday, Ben Clemens investigated Francisco Lindor’s struggles as a New York Met. The answer was complicated, as in most cases, though he did treat us to a series of tables and graphs. Inspired by the endeavor, I wanted to take a crack at a different NL East superstar: Braves’ first baseman Freddie Freeman.

To be fair, his predicament is hardly as lamentable as Lindor’s. As of writing, Freddie Freeman has a 115 wRC+. There have been stretches where he put up similar levels of production. Nothing seems out of the ordinary – just a good hitter in a dry spell. It’s not like he was going to replicate his abbreviated MVP campaign, anyways.

What is uncharacteristic, however, is his .224 BABIP. It surprised me, considering that he’d sustained a BABIP of .341 from 2010-20, a feat that required a decade of hard-hit line drives and an above-average contact rate. Gary Sánchez, he usually is not. But it’s been an odd year for the first baseman so far, which we can see for ourselves. Below is his 50-game rolling BABIP, stretching back to a few years ago:

At first, the explanation for this seems simple. Freeman currently carries a line drive rate of 24.5%, his lowest since 2011. His groundball rate, in contrast, is the highest since then. Fewer line drives and more grounders is a terrible combo for a hitter’s BABIP – the former land for a hit over half the time; the latter are snagged by infielders. But this raises a question. If Freeman’s current batted ball distribution resembles his in 2011, how did he achieve a .339 BABIP that year? Read the rest of this entry »


Richard Bleier Is Striking Out Batters Now

There are a lot of ways you can introduce a person. You can talk about their appearance, traits, maybe even their likes or dislikes. Tasked with breaking the ice on Marlins reliever Richard Bleier, though, this is how I would start. From 2016 to ’19, here’s his yearly strikeout rate versus the league average:

Richard ‘Low K’ Bleier
Year Bleier’s K% League K%
2016 14.1% 21.1%
2017 9.8% 21.6%
2018 11.3% 22.3%
2019 12.8% 23.0%

Bleier had been famous for not generating strikeouts, zigging when other prolific relievers were zagging. It makes sense when you consider his repertoire, which consisted mostly of a sinker, a cutter, and the occasional changeup or slider. The sinker led the charge, inducing a copious amount of grounders, while the other offerings were mixed in to throw hitters off-guard. The strategy worked, too. Bleier boasted a 1.97 ERA and 3.59 FIP in 119 innings between 2016 and ’18, and while his 2019 returned uncharacteristic results (a 5.32 ERA and 4.19 FIP), nothing suggested a fatal flaw. Sometimes, you have a bad year.

I’ve established Bleier as someone who thrives on weak contact. But you’ve read the title. One of the perks of being a baseball writer is getting to revisit the FanGraphs pages of players you’re fond of, as work. It’s like catching up with an old friend. I hadn’t paid attention to Bleier in a while, so imagine my surprise when I stumbled upon this development:

Weird, right? Most of the time, this type of breakout is the result of pitchers refining their already electric stuff, like Matt Barnes or Dustin May; their strikeout rates climb from average to great. But consider Bleier, whose dramatic increase has brought him just up to par, with a current strikeout rate of 24.3% that is a mere 0.1 points higher than the league average of 24.2%.

Read the rest of this entry »


Whose High Home Run Was the Most Impressive?

It’s true – compared to previous seasons, hitters are struggling against pitchers. The league batting average is the lowest it’s been in decades even if you exclude pitchers, the strikeout rate the highest. It’s easy to point fingers at the people tasked with making contact, but really, there’s no simple defense against a triple-digit heater followed by a wipeout slider.

But sometimes, the hitters fight back. They’re world-class athletes after all, and are capable of actions we can only dream of. Hitting a baseball 400 feet for a home run is one such example, but let’s go a step further. What about home runs hit off of seemingly impossible pitches? Today, I wanted to look at the four highest home runs hitters have belted out this season, then determine which one is the most impressive. This unfortunately means I had to leave out Jazz Chisholm’s homer off Jacob deGrom, as the pitch wasn’t high enough, but don’t worry, you can read about it here.

With that introduction out of the way, let’s meet the candidates alongside their home runs. The first batter up is Willians Astudillo:

Read the rest of this entry »