Author Archive

Another Sign Batting Average Is Becoming Obsolete

One of the great batting lines of the first half was Yasmani Grandal’s .189/.388/.436 slash. Unfortunately, as has been the case for many a hitter on the White Sox, his return to action in ‘21 is in doubt after he underwent surgery to repair a knee ligament. I won’t wax poetic on Grandal; Devan Fink did a great job covering his early-season batting line. But it’s becoming more common to see a hitter with an average that starts with a “1” these days. The common reference to a batting average under .200 is the “Mendoza Line,” which our Ashley MacLennon made a strong case for ditching as a reference earlier this season. I, on the other hand, am going to make the case for why it’s become irrelevant.

Batting average, the prevailing measure of a hitter’s success for most of baseball’s existence, has faded into the background, yet the rate at which a hitter successfully reaches base via a hit is still usually the first statistic reported. Grandal’s batting average is not good, but the selection of .200 as a cutoff point is arbitrary; after all, a batting average of .214 is also not good. What most baseball fans understand now is that because all base hits are not equal in value, batting average is limited in what it says about a hitter. But there is a stigma attached to a poor batting average, which is probably why the Mendoza Line has stuck.

Let’s rewind to last year’s shortened campaign. There was a lot of speculation going into a 60-game season as to whether or not a player would be able to hit .400. That didn’t happen, though Charlie Blackmon was hitting .500 after a couple weeks. We did end up with a handful of qualified hitters with an average below .200 — seven such, to be exact:

Sub-.200 Qualified Hitters, 2020 Season
Name Tm PA AVG wOBA wRC+
Max Muncy LAD 248 0.192 0.316 100
Joey Gallo TEX 226 0.181 0.297 86
Matt Olson OAK 245 0.195 0.316 103
Kyle Schwarber CHC 224 0.188 0.307 91
Bryan Reynolds PIT 208 0.189 0.278 72
Evan White SEA 202 0.176 0.261 66
Yoshi Tsutsugo TBR 185 0.197 0.309 98

This is by far the highest number of qualified hitters with a batting average below .200 for a single season. It is totally a product of the short season, though. None of the hitters on the list above are contact hitters, but their true bat-to-ball skills are probably better than what they showed in ‘20. When the sample is small, there is a greater chance that you get some outliers in your results.

Read the rest of this entry »


Oakland’s Bullpen Has Been in Survival Mode

A pivotal series between the two teams atop the AL West kicked off on Tuesday with the Astros beating the A’s to extend their division lead to 4.5 games. It was an unusually shaky start from Chris Bassitt, who allowed six runs and couldn’t escape the fifth inning, but he turned the game over to Oakland’s bullpen with the game knotted at six runs apiece. The combo of J.B. Wendelken and Yusmeiro Petit, though, quickly changed that, allowing two runs in the sixth to put the A’s behind for good.

The A’s have routinely found ways to create value despite a small piggy bank, but the bullpen is probably the biggest concern with the team so far. That’s nothing unusual; most teams in the majors stress over their bullpen. But the A’s are not an ordinary team. During their current three-year streak of going to the playoffs, their bullpen has ranked in the top 10 in WAR each of those seasons and top five overall:

Team Bullpen WAR Leaderboard, 2018-20
Team IP WAR FIP ERA
TBR 1866.0 17.4 3.88 3.7
NYY 1464.2 17.2 3.89 3.85
SDP 1488.1 16.1 3.72 4.11
OAK 1428.2 15.6 3.9 3.48
MIN 1415.0 13.2 4.06 4.2
MIL 1513.1 12.8 3.95 3.99
HOU 1266.0 12.7 3.84 3.57
LAD 1395.2 10.6 3.87 3.59
CHW 1358.2 10.4 4.29 4.29
SFG 1428.2 9.3 4.02 3.89

Read the rest of this entry »


Resurgent Brothers a Key Contributor in Cubs’ Bullpen

The bullpen can be a weird place. While lineups and rotations across the big leagues have some degree of stability (albeit one threatened by recent spikes in injury rates), the amount of roster turnover in bullpens varies greatly. It’s a place where former failed starters and pitchers trying to get one last chance at the big leagues often find a home. Tyler Matzek and Daniel Bard were the latest reclamation projects turned into high-leverage relief pitchers when they returned to form last season. For Bard, it had been a full seven seasons since his last appearances in a big league game (2013 with the Red Sox). His performance earned him 2020 Comeback Player of the Year honors in the National League and a $2.9 million one-year deal to return in 2021 as the Rockies’ closer.

Is this unusual? Bard’s story certainly is, but it’s pretty typical for teams to pan for gold via non-roster invitees to spring training. Spring training rosters are limited to 75 players; teams will almost always fill this with the entirety of their 40-man roster supplemented by minor league players close to big league action and a handful of NRIs competing for a spot on the roster. Most NRIs don’t pan out and are either released or end up in the minor leagues, but occasionally they suit up for Opening Day.

Rex Brothers falls into this category. Now in his third attempt to recapture his form as the Rockies’ setup man and closer from 2011-15, Brothers looks like he’s figured some things out with the Cubs. Heading into yesterday, he’d made 28 appearances for a total of 24.1 innings (all stats are as of June 23). Those figures are the highest totals for Brothers since the 2014 season. In those innings he’s struck out 40 batters, leading to a career-best 38.5 K% and K-BB% of 25%. That K-BB% is good for 31st out of 200 relievers with at least 20 innings pitched. So far it certainly reads like a success story for the Cubs.

Brothers is no spring chicken (2021 is his age-33 season) but he has logged relatively few innings (293.2 total at the major league level and only 51.1 over the last five seasons), which may inspire some optimism that he has more left in the tank than his age would suggest. But the question remains as to whether he has staying power in the Cubs’ bullpen. I made mention of Bard and Matzek earlier. Matzek reappeared last season as a reliever for the Braves after a brief stint as a starting pitcher for the Rockies (the team that drafted him) back in 2014-15. His performance has regressed from his resurgent 2020, but Matzek has managed to keep his successful run going with an ERA of 3.33 and a FIP of 2.98 in ‘21. Bard has similarly maintained form. Matzek and Bard represent the high point for these kinds of reclamation projects. While unlikely, it’s far from unprecedented.

But let’s get back to Brothers. A reliever his whole career, he has relied primarily on a two-pitch mix of a four-seam fastball and a slider. His best pitch is his four-seamer, which he uses about two-thirds of the time; it tops out around 97. According to Sahadev Sharma of The Athletic, Brothers played through shoulder pain in Colorado, which he admits was a mistake. The shoulder ailment eventually led to surgery following his 2016 release from the Cubs, who had acquired him from the Rockies in ‘15. His road back to the majors has taken time. As is the case for many pitchers who go through injuries, his mechanics took a turn for the worse as his body compensated for the weak throwing shoulder. His first crack at a comeback was granted by the Atlanta Braves where he bounced back and forth between the majors and the Braves’ Double- and Triple-A affiliates. Never a strength for Brothers, his lack of control was at the heart of his struggles to get back to baseball’s highest level. He put it together briefly in 2017 when he pitched 23.2 innings for a 3.66 FIP but an awful 7.23 ERA. In 2018, however, Brothers walked 44 batters in 40.2 innings, including a whopping 17 wild pitches during that span. He faced a mere two batters at the major league level and walked both of them.

Another opportunity in 2019 with the Yankees followed by time with the Cubs in ‘20 yielded similar results: Brothers could not throw strikes consistently enough. He credits time working on his mechanics at the alternate site last season for his improved control. Look at the following GIFs. The first one is from 2020 and the second from ‘21. Notice how last season he was reaching his throwing arm down below his waist; this season his arm action is much shorter and more compact in comparison.

In his interview with The Athletic, Brothers expressed the impact his arm action also had on his lower half, stating, “My knee started caving towards home plate, which was forcing me down the mound way too soon. It was an inconsistent release point, and I was just feeling bad.”

Statcast captures pitcher release points with every pitch. Looking at Brothers’ pitch data from the last two seasons, there’s evidence that the improvements in his delivery have helped him find consistency in his release point. The chart below shows pitch release locations for the 2020 and ‘21 seasons.

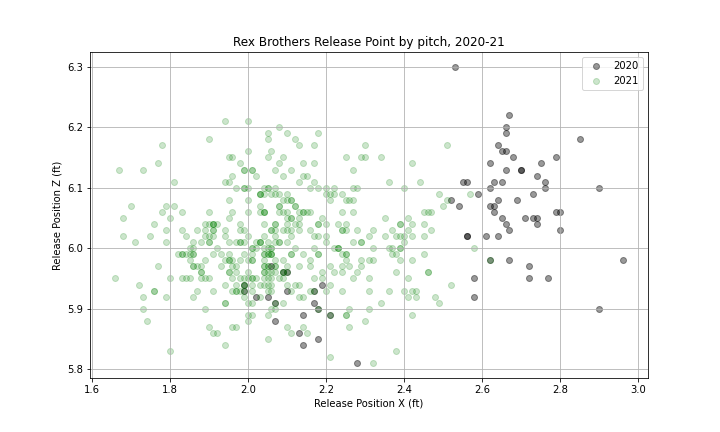
The release point distribution is quite different for the two seasons. The standard deviation for release point of his pitches in 2020 was 0.266 feet in the X direction and 0.103 feet in the Z direction; in ‘21, the standard deviation decreased significantly to .186 and .076. This holds true for both fastballs and sliders. He’s thrown over five times as many pitches this season, but even taking a random sample of data of the same size (74 pitches) as his data from 2020 the improvement in consistency is still evident.

Let’s be clear, Brothers still carries a BB/9 rate in excess of 5.00, but his propensity for strikeouts makes that number more palatable. Improving his release point seems to have allowed him to regain enough control to effectively leverage his strikeout ability. Brothers has thrown 36.6% of his pitches in the strike zone this season, tied for 12th lowest among relievers with at least 20 innings pitched. During his most effective seasons in Colorado (2011-13), he threw 44.9% of his pitches in the strike zone. He’s also allowing way more fly balls now (46.8% this season) than his days in Colorado (average of 32.6% from 2011-13), which has been detrimental to his home run rate (1.11 HR/9 allowed this season) although he’s right around league average. This season’s version of Brothers is a tad less effective than his younger self, but his 3.57 FIP makes him an above average reliever and a reliable left-handed option for the Cubs.

The Cubs have the fourth best bullpen in the majors by WAR at 3.2. Outside of Craig Kimbrel, who is also having a resurgent season, their relievers are not hyped prospects or big name free agent signings. It seems that the front office and coaching staff have found the ability to make the most of the pieces they have. Working with Brothers to rekindle some of the success he had early in his career is just an example of how many of the Cubs’ relievers are churning out career-best performances.


Isiah Kiner-Falefa Has Improved Nearly All Facets of His Game

All-Star Game voting kicked off a few weeks ago (if you haven’t filled out a ballot, you can do so here), with the first round of totals announced earlier this week. There are a few players running away with their position, but most are up for grabs. Among those looking for more votes: Isiah Kiner-Falefa, Rangers shortstop, who’s unhappy with the results so far.

Kiner-Falefa has a case for taking the trip to Colorado, as he currently ranks fourth in both FanGraphs WAR (2.0) and bWAR (2.8) among shortstops in the AL, yet he did not crack the top 10 in the first vote update. Still, All-Star roster spot or no, this has been a wildly successful season for him, particularly in light of the defensive move he had to make.

Originally drafted as a shortstop, Kiner-Falefa played multiple infield positions as he worked his way through the minor leagues and also tried his hand at catching before going from third base to shortstop this season. As noted by Andrew Simon of MLB.com and our Jake Mailhot during the offseason, he’s now become the first player in the modern era to play at least 50 games at catcher, third base, and shortstop throughout his career.

It’s not only his versatility that is noteworthy. The reigning 2020 AL Gold Glove winner at third base, Kiner-Falefa’s skills haven’t diminished with his shift to shortstop; his defensive component of WAR (based on UZR) is the highest at that position in the AL. The table below shows a breakdown of FanGraphs’ measures of the primary components of WAR individually (hitting, fielding, and base running):

Isiah Kiner-Falefa WAR Breakdown
Season BsR Off Def WAR
2018 -1.2 -10.9 -1.5 0.1
2019 0.5 -11.7 -6.7 -1.0
2020 -2.0 -3.9 2.8 0.7
2021 3.8 5.2 5.0 2.0

Read the rest of this entry »


How Spray Angle Helped Create the Season’s Shortest Home Run

This past Tuesday’s slate of games provided us with a cluster of enjoyable home runs. Among them were Shohei Ohtani’s longest career home run (an estimated 470-foot blast); Ke’Bryan Hayes inadvertently missing first base and having his third bomb of the year overturned; and a fly ball off the bat of Carlos Correa that just (and I mean just) cleared the Green Monster.

Correa’s home run, the shortest of the season so far, was struck at a launch angle of 49 degrees and traveled an estimated 310 feet; it’s one of only four (over-the-fence) home runs hit since 2015 with a launch angle that high or higher. There have been several homers hit 310 feet or less, but the lion’s share of them have been the inside-the-park variety. Here’s the list of impressively short out-of-the-park home runs:

Over the Fence Homers Less Than or Equal to 310 Feet
Player Date Dist (ft) EV (MPH) LA (°) xBA
Carlos Correa 2021-06-08 310 105.5 49 0.086
Andrew Benintendi 2019-07-27 310 87.7 38 0.020
Lorenzo Cain 2017-07-29 302 90.4 39 0.013
Stephen Vogt 2019-09-18 307 105.9 21 0.927
SOURCE: Baseball Savant

Read the rest of this entry »


Is Ryan McMahon Finally Breaking Out?

Times are tough in Denver. The biggest stories for the Rockies this year have been their trade of their best player (heavily and rightfully criticized), the resignation of Jeff Bridich, and the relocation of this season’s All-Star Game to Coors Field. Okay, that last one is pretty cool, and the Bridich news was good news for Rockies fans. On the field though, it’s been pretty ugly. The Rockies are fourth in the NL West and on pace to lose 99 games, and they’ve gone just 4–22 on the road with only 63 runs scored. But there’s one player donning the purple and black who might finally be breaking out: Ryan McMahon.

Since coming onto the scene in 2017, McMahon has been the subject of more than a few breakout player articles, including Dan Symborski’s piece on the top 2021 candidates to take a step forward. He’s answered the call so far, serving as the lone bright spot for the Rockies in what has been an otherwise dismal season by slashing .259/.313/.507 with 13 homers and 1.3 WAR. These numbers aren’t especially eye-popping for a player who calls Coors Field home, but offensive numbers have been down across the big leagues this season, and while McMahon has played plenty of corner infield in his career, his primary position has been at second, where the bar is a bit lower.

Before we attempt to answer whether or not the breakout is for real, it’s worth looking at what makes McMahon such a tempting choice to develop into a better big league hitter. A big part of the reason is his raw power. Unless your name is Nick Madrigal, it’s usually going to take some serious power potential to get preseason hype. Prior to the 2018 season, McMahon was ranked third in the Rockies’ system, per Eric Longenhagen’s prospect list, with his 60 raw power as his greatest asset. At the major league level, where his batted ball data is more visible than the minor leagues, McMahon has achieved a maximum exit velocity in the 68th percentile or better each season.

Ryan McMahon Exit Velocity
Season Maximum Exit Velocity Percentile Rank
2018 110.1 74
2019 112.9 88
2020 109.7 68
2021 111.5 81
SOURCE: Baseball Savant

Read the rest of this entry »


How the Red Sox Are Limiting Home Runs

The Red Sox caught us all by surprise by jumping out to an incredible start en route to an early-season lead atop the AL East. As Tony Wolfe wrote, the strong performance was largely thanks to consistent run-scoring and a dominant bullpen. Fast-forward to mid-May, and Boston is still there, first in the division and continuing to climb up various weekly Power Rankings (including our own). As impressive as the Red Sox have been at the plate, though, the rotation seems to have been overshadowed. I get it; there’s not a lot of name brand recognition. Their two best starters from 2019, Chris Sale and Eduardo Rodriguez, pitched a grand total of 0 innings in 2020. But after taking three of four from the Angels over the weekend, the Red Sox lead the American League in FIP (3.29) among starting pitchers.

Leading the charge is Nathan Eovaldi. His most recent start extended his streak without giving up a homer to 50 innings; he is the only qualified starting pitcher who has yet to do so. That helps make up for a modest 4.50 ERA and strikeout-per-nine rate of 8.46; his FIP is 2.15. Since he’s been in Boston, Eovaldi has struggled with home runs, allowing an average of 1.86 per nine over the past two seasons. That makes sense, as he’s always allowed a lot of balls to be put in play with a penchant for giving up the occasional dinger. But so far this season, the expected value in terms of xwOBA on those balls suggests that Eovaldi is eliciting softer contact, which is supported by his peripherals.

Nathan Eovaldi Statcast Data 2015-21
Season Team EV maxEV LA Barrel% HardHit%
2015 NYY 88.5 112.1 5.6 3.6% 34.8%
2016 NYY 89.8 115.0 7.7 8.3% 40.3%
2018 TBR/BOS 88.3 118.4 11.7 5.1% 34.4%
2019 BOS 90.8 115.2 11.7 8.2% 39.7%
2020 BOS 90.1 112.2 8.5 8.8% 39.7%
2021 BOS 87.0 109.6 8.2 4.1% 32.7%
SOURCE: Baseball Savant

Read the rest of this entry »


Jesús Aguilar Has Transformed Himself at the Plate

First base is an offense-first position. Sure, it’s great to have a first baseman who is handy with the glove and can scoop errant throws, but by and large, it’s a position for sluggers. Even though the position supplied both of last season’s MVPs — Freddie Freeman and José Abreu — it’s production doesn’t hold up as strongly as it has compared to previous years. From 2018 through the 2021 season thus far, first basemen have averaged a 108 wRC+ compared to an average wRC+ of 115 over the 2000-17 seasons.

There are plenty of teams suffering from lackluster production at first base but I want to highlight two of them: the Milwaukee Brewers and the Tampa Bay Rays. The Brewers have managed a measly 68 wRC+ and -0.5 WAR, with contributions mostly from the duo of Keston Hiura (who is now in Triple-A) and Daniel Vogelbach. The Rays have been a bit better with a wRC+ of 82 and -0.1 WAR. These aren’t the worst teams in the majors at first base but they do share something in common; they once had Jesús Aguilar under team control and let him go.

In his tenure with the Marlins after being selected off waivers on December 2, 2019, Aguilar has solidified himself as the team’s primary first baseman, slashing .254/.356/.469 with 14 homers across his two seasons (the stats in this piece are through May 9); that’s good for 126 wRC+ and 1.2 WAR. This season has been particularly good to Aguilar so far. He’s slashing .269/.363/.490 and is in the top 10 in the majors among first basemen in wRC+ (9th) and WAR (9th). Not bad for a waiver pickup! I make mention of his previous clubs’ oversight not to shame them; it’s not the first time a valuable player has been overlooked. But his path to the player he is today is a unique one. Read the rest of this entry »


Fastballs Keep Pouring Into the Top of the Zone

What a month it has been for pitchers. We witnessed no-hitters by Joe Musgrove, Carlos Rodón and, just yesterday, John Means. Corbin Burnes threw a major-league record number of strikeouts without issuing a walk (49 punch outs and counting, though Burnes is currently sidelined). And Shane Bieber has pitched a multitude of double-digit strikeout games by. Oh, and Jacob deGrom and Gerrit Cole are just toying with hitters. On the flip side, it’s been a dismal start at the plate for most of the game’s hitters, though there are a few exceptions (here’s looking at you, Mike Trout and Vladimir Guerrero Jr.). Last week, Brendan Gawlowski covered April’s .232 league-wide batting average, an historic low. A combination of the highest strikeout rate on record and a below-average BABIP made the first month of the season one to forget for fans of offense and batted balls.

According to an anonymous GM recently quoted in The Athletic, the root of the league’s hitting woes is simple: “Pitching is too good.” The league-wide strikeout rate has been on the rise for several years now, but to see the rate jump like it has in the season’s first month is alarming and worth investigating. Are pitchers just getting better? Are hitters selling out for the long ball? It’s probably a combination of both. To dissect the strikeout problem, let’s look at how batters are striking out and what it reveals about how they are being pitched.

Not all strikeouts are created equal. To start, there are three ways a pitcher can earn a strike: a called strike, a swinging strike, and a foul ball (to keep it simple, I’m considering bunt attempts swings here). Going back to the 2015 season, a clear trend has set in.

Pitch Outcomes 2015-21
Season Balls Batted Ball Events Strikes Swinging Strikes
2021 36.5% 16.6% 46.7% 12.7%
2020 37.0% 16.7% 46.1% 12.3%
2019 36.3% 17.2% 46.3% 12.1%
2018 36.3% 17.5% 45.9% 11.6%
2017 36.4% 17.7% 45.5% 11.3%
2016 36.4% 18.0% 45.2% 10.9%
2015 36.0% 18.6% 45.0% 10.7%
SOURCE: Baseball Savant
*2021 results using pitch data through games played on April 30.

Read the rest of this entry »


When Pitchers and Stealing Bases Collide

The Giants have been on a roll lately, winning their last three series thanks in large part to a surprisingly competent rotation, which Tony Wolfe detailed nicely earlier this week. Their latest victory, a 7–3 defeat of the Rockies on Wednesday, featured Alex Wood on the mound; he allowed just two runs and struck out nine over six innings en route to his third win in three starts. But his bold base running was what I want to focus on.

In the bottom of the sixth inning, looking to add to a 4–0 lead, Wood broke toward third before reliever Jordan Sheffield had started toward the plate. Sheffield stepped off the rubber and easily threw out Wood, who awkwardly tried to evade the tag by Josh Fuentes and somersaulted into the grass on the foul side of the bag. There’s something about the way Wood tumbled over the base while wearing his oversized coat that takes this past funny and into something special.

This steal attempt was a bizarre looking play. For starters, that big coat doesn’t seem very aerodynamic. But it’s rare in general for a pitcher to attempt to steal a base; I can’t remember the last time I’ve witnessed it. Sure enough, Wood’s scamper on Wednesday night has been the only stolen base attempt by a pitcher so far this season.

Read the rest of this entry »