For the 22nd consecutive season, the ZiPS projection system is unleashing a full set of prognostications. For more information on the ZiPS projections, please consult this year’s introduction, as well as MLB’s glossary entry. The team order is selected by lot, and the next team up is the Kansas City Royals.
Batters
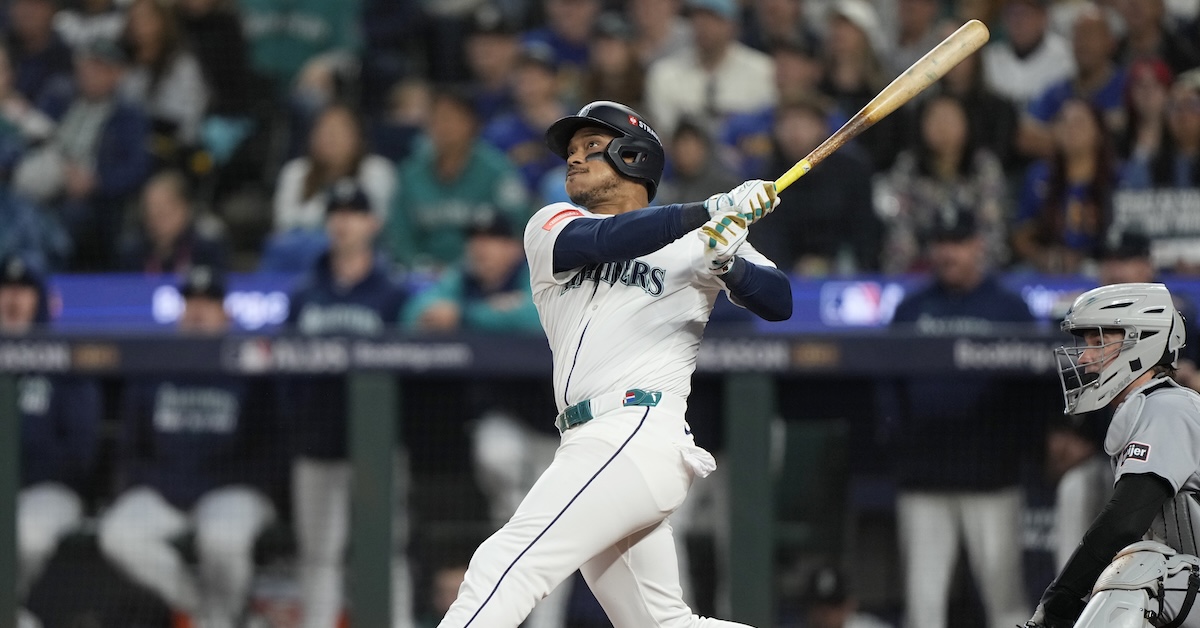
For the Royals, 2025 was about the season that was expected. Bobby Witt Jr. was amazing and the starting rotation was very good, but the team was held back as a result of getting pretty much no production out of the second base, outfield, and designated hitter positions. ZiPS projected the Royals for 83 wins, and they won 82. Normally, that would make a team a real contender in the AL Central, but the Tigers played like an elite team in the first half and the Guardians did the same in the second half, leaving the division always too far out of reach for the Royals.
While Kansas City had some serious problems, especially in those trouble spots mentioned above, it was generally encouraging how the team dealt with it. I stand by every word I said about the outfield back in February. The idea to just roll with Hunter Renfroe and MJ Melendez after their terrible 2024 seasons was a massive missed opportunity. But the good thing is that the Royals were quick to jettison both and get looks at other players who showed a lot of promise (Jac Caglianone) or at least had some upside (Drew Waters). Now, these moves didn’t actually pan out in the short term, but it’s always better to try something that might work over something that almost definitely won’t.
ZiPS doesn’t really like the outfield this time around either, but it does think that there are enough defense and platoon advantages in the various players slated to man the grass that the Royals could eke out respectable production from the group, certainly quite a lot more than they got last year. And this is important, because every win for a team with a projected total in the low-to-mid-80s, especially a team in a Central division, has tremendous value. Even better would be a much bigger acquisition to boost at least one of the positions, but failing that, ZiPS doesn’t see either left or right field as unmitigated disasters this time around (though Steamer is less optimistic).
Witt Jr. is the straw that stirs the drink, of course, but beyond that, this was the season I think Maikel Garcia clearly established himself as an All-Star level third baseman. He finally turned that good plate discipline and hard-hit numbers into real production, and he’s Gold Glove-worthy at the hot corner. Expect both players on the left side of the infield to keep things up in 2026. Another positive: The Royals could see some improvement at second base. ZiPS thinks that Michael Massey is better than his 2025 performance indicates. My inclination might be to use Massey as a super-sub type, and just stick Jonathan India at second and leave him there; there’s no reason to pretend India’s a corner outfielder, as the team did at times this past season.
I was a big advocate for the Royals’ being aggressive with Caglianone’s promotion, and I still think it was the right thing to do. It remains to be seen if he can contribute defensively anywhere, but he ought to hit better than he did in his debut campaign; it’s hard to imagine he could do worse than his horrifying 46 wRC+. The problem is the Royals can’t afford to just stick Cags at DH every day. They need to leave that open for Salvador Perez to get spot starts when he’s not wearing a glove in some sort of timeshare with Carter Jensen behind the plate and Vinnie Pasquantino at first. You shouldn’t be alarmed by the top comp for Caglianone. Costen Shockley didn’t hit for the Angels initially, and after a dispute about whether or not they told him they weren’t going to demote him, they sent him to the minors; in response, after having just moved his family out to California, he peaced out from baseball at age 23.
And you better not be upset about the Witt top comp. Dickie Thon was absolutely terrific until a Mike Torrez fastball shattered his face; he was never the same after that. Don’t worry, ZiPS isn’t forecasting Witt to suffer the same fate!
Pitchers
In the projection table, the rotation tops out at 2.2 WAR, from Cole Ragans. However, this understates the quality of this group of starters, as ZiPS is understandably squeamish about projecting big innings totals from Ragans and Kris Bubic. A full season for Ragans would put his WAR safely over three. The same is true for Bubic, though rotator cuff injuries always make me a bit worried.
The rest of the rotation, Seth Lugo, Noah Cameron, and Michael Wacha projects out as comfortably average-plus, and I don’t think it’s a stretch to put Kansas City’s starting staff at the back of the top 10 in baseball. Ryan Bergert and Stephen Kolek won’t scare anyone, but they’re perfectly reasonable emergency replacements, and both Bailey Falter and Daniel Lynch IV are at least plausible options if injuries plague the starting five.
The bullpen projects as a middle-of-the-pack unit at the moment. ZiPS remains a fan of Hunter Harvey, but injuries ruined his 2025 season, and he’s currently a free agent. Otherwise, ZiPS pegs the Royals as having a quintet of B+ relievers in Carlos Estévez, Lucas Erceg, John Schreiber, Angel Zerpa, and Alex Lange, but doesn’t think they have a true lights-out closer. Overall, this pen comes out aggressively mid, and a depth addition or two would be welcome.
Right now, ZiPS projects the Royals to finish with somewhere between 82-86 wins or so, depending on the assumptions. That makes them relevant in the AL Central and a second-tier wild card contender. There’s still time for them to do more to get over the hump.

Ballpark graphic courtesy Eephus League. Depth charts constructed by way of those listed here. Size of player names is very roughly proportional to Depth Chart playing time. The final team projections may differ considerably from our Depth Chart playing time.
Batters – Standard
| Player |
B |
Age |
PO |
PA |
AB |
R |
H |
2B |
3B |
HR |
RBI |
BB |
SO |
SB |
CS |
| Bobby Witt Jr. |
R |
26 |
SS |
658 |
598 |
98 |
169 |
34 |
9 |
27 |
93 |
46 |
117 |
32 |
9 |
| Maikel Garcia |
R |
26 |
3B |
635 |
571 |
82 |
150 |
30 |
5 |
11 |
67 |
54 |
98 |
25 |
7 |
| Carter Jensen |
L |
22 |
C |
585 |
521 |
68 |
126 |
22 |
5 |
17 |
69 |
57 |
159 |
7 |
1 |
| Vinnie Pasquantino |
L |
28 |
1B |
613 |
549 |
63 |
139 |
29 |
1 |
26 |
90 |
51 |
90 |
1 |
0 |
| Kameron Misner |
L |
28 |
CF |
451 |
396 |
54 |
83 |
19 |
3 |
11 |
46 |
49 |
144 |
16 |
3 |
| Salvador Perez |
R |
36 |
C |
575 |
532 |
52 |
131 |
24 |
1 |
24 |
80 |
28 |
124 |
0 |
0 |
| Jonathan India |
R |
29 |
2B |
555 |
478 |
67 |
114 |
25 |
2 |
11 |
50 |
57 |
106 |
4 |
3 |
| Jac Caglianone |
L |
23 |
1B |
524 |
473 |
64 |
120 |
20 |
1 |
23 |
71 |
40 |
114 |
3 |
1 |
| Carson Roccaforte |
L |
24 |
CF |
531 |
475 |
60 |
98 |
21 |
6 |
12 |
55 |
50 |
182 |
19 |
9 |
| Drew Waters |
B |
27 |
CF |
448 |
406 |
55 |
91 |
19 |
8 |
9 |
45 |
35 |
136 |
12 |
4 |
| Kyle Isbel |
L |
29 |
CF |
394 |
355 |
49 |
84 |
15 |
5 |
6 |
37 |
24 |
76 |
7 |
4 |
| Bobby Dalbec |
R |
31 |
3B |
462 |
416 |
53 |
92 |
17 |
3 |
15 |
52 |
39 |
176 |
6 |
1 |
| John Rave |
L |
28 |
CF |
487 |
431 |
61 |
99 |
19 |
5 |
11 |
51 |
45 |
130 |
15 |
4 |
| Tyler Tolbert |
R |
28 |
2B |
443 |
394 |
59 |
88 |
14 |
5 |
5 |
41 |
26 |
120 |
35 |
5 |
| Harold Castro |
L |
32 |
3B |
372 |
345 |
37 |
89 |
15 |
1 |
11 |
45 |
17 |
83 |
3 |
1 |
| Michael Massey |
L |
28 |
2B |
427 |
395 |
42 |
96 |
19 |
1 |
11 |
46 |
21 |
83 |
3 |
2 |
| Nick Loftin |
R |
27 |
LF |
428 |
374 |
50 |
89 |
18 |
1 |
8 |
44 |
43 |
67 |
8 |
3 |
| Diego Castillo |
R |
28 |
3B |
412 |
368 |
45 |
86 |
17 |
1 |
6 |
38 |
39 |
83 |
3 |
3 |
| Isan Díaz |
L |
30 |
SS |
241 |
212 |
28 |
45 |
6 |
1 |
9 |
29 |
24 |
64 |
2 |
1 |
| Jordan Groshans |
R |
26 |
3B |
401 |
364 |
38 |
86 |
13 |
1 |
4 |
33 |
33 |
74 |
0 |
1 |
| Sam Kulasingam |
B |
24 |
2B |
527 |
468 |
62 |
110 |
20 |
6 |
2 |
41 |
41 |
104 |
10 |
6 |
| Connor Kaiser |
R |
29 |
SS |
334 |
292 |
32 |
54 |
12 |
2 |
5 |
27 |
33 |
116 |
4 |
1 |
| Dairon Blanco |
R |
33 |
DH |
318 |
282 |
47 |
68 |
12 |
3 |
5 |
35 |
21 |
82 |
31 |
6 |
| Luke Maile |
R |
35 |
C |
161 |
139 |
14 |
31 |
6 |
0 |
3 |
13 |
17 |
45 |
2 |
0 |
| Rudy Martin |
L |
30 |
CF |
320 |
281 |
37 |
65 |
8 |
3 |
5 |
30 |
26 |
84 |
21 |
5 |
| Tyler Gentry |
R |
27 |
RF |
441 |
394 |
46 |
85 |
18 |
2 |
10 |
49 |
36 |
133 |
5 |
2 |
| Blake Mitchell |
L |
21 |
C |
371 |
318 |
36 |
58 |
10 |
2 |
7 |
34 |
47 |
144 |
8 |
4 |
| Peyton Wilson |
B |
26 |
2B |
471 |
421 |
49 |
93 |
17 |
4 |
7 |
45 |
40 |
125 |
12 |
4 |
| Randal Grichuk |
R |
34 |
DH |
347 |
320 |
42 |
76 |
17 |
2 |
11 |
36 |
22 |
75 |
1 |
1 |
| Javi Vaz |
L |
25 |
2B |
492 |
427 |
56 |
98 |
15 |
3 |
4 |
42 |
43 |
59 |
12 |
2 |
| Mark Canha |
R |
37 |
LF |
352 |
303 |
35 |
71 |
14 |
0 |
6 |
32 |
33 |
71 |
3 |
1 |
| Canyon Brown |
R |
22 |
C |
268 |
237 |
29 |
48 |
9 |
0 |
2 |
21 |
17 |
77 |
4 |
2 |
| Julio E. Rodriguez |
R |
29 |
C |
214 |
195 |
17 |
40 |
7 |
0 |
5 |
21 |
15 |
57 |
1 |
0 |
| Luca Tresh |
R |
26 |
C |
348 |
316 |
31 |
70 |
13 |
2 |
9 |
37 |
24 |
91 |
2 |
0 |
| Brian O’Keefe |
R |
32 |
C |
279 |
254 |
28 |
50 |
12 |
1 |
8 |
29 |
22 |
78 |
1 |
1 |
| Justin Johnson |
R |
26 |
2B |
346 |
311 |
31 |
62 |
13 |
0 |
4 |
30 |
25 |
90 |
5 |
2 |
| Adam Frazier |
L |
34 |
2B |
406 |
368 |
41 |
85 |
16 |
2 |
5 |
36 |
27 |
72 |
6 |
4 |
| Dustin Dickerson |
R |
25 |
SS |
438 |
382 |
41 |
74 |
8 |
1 |
3 |
30 |
45 |
119 |
9 |
5 |
| Kyle Hayes |
R |
28 |
C |
150 |
126 |
10 |
20 |
5 |
0 |
1 |
13 |
14 |
59 |
1 |
0 |
| Austin Charles |
R |
22 |
3B |
365 |
330 |
36 |
67 |
11 |
2 |
5 |
32 |
22 |
117 |
10 |
5 |
| Chris Brito |
R |
26 |
1B |
251 |
217 |
20 |
47 |
8 |
0 |
3 |
20 |
27 |
65 |
2 |
1 |
| Gavin Cross |
L |
25 |
RF |
477 |
440 |
54 |
92 |
18 |
3 |
12 |
50 |
30 |
148 |
14 |
3 |
| Hunter Renfroe |
R |
34 |
RF |
381 |
347 |
35 |
76 |
18 |
1 |
11 |
40 |
30 |
82 |
1 |
0 |
| Jack Pineda |
L |
26 |
SS |
272 |
245 |
27 |
51 |
11 |
0 |
1 |
21 |
16 |
73 |
4 |
1 |
| MJ Melendez |
L |
27 |
LF |
526 |
479 |
61 |
105 |
24 |
4 |
18 |
60 |
41 |
154 |
9 |
5 |
| Sam Ruta |
L |
24 |
3B |
306 |
274 |
24 |
52 |
13 |
2 |
5 |
27 |
26 |
135 |
0 |
1 |
| Colton Becker |
R |
25 |
SS |
369 |
314 |
36 |
68 |
11 |
1 |
1 |
24 |
32 |
78 |
25 |
6 |
| Nick Pratto |
L |
27 |
1B |
455 |
403 |
47 |
83 |
17 |
3 |
10 |
45 |
42 |
158 |
6 |
1 |
| Brett Squires |
L |
26 |
1B |
469 |
427 |
42 |
91 |
18 |
3 |
8 |
46 |
34 |
156 |
11 |
3 |
| Diego Hernandez |
L |
25 |
CF |
330 |
306 |
32 |
69 |
8 |
4 |
4 |
30 |
12 |
97 |
7 |
5 |
| Nick Gordon |
L |
30 |
2B |
287 |
266 |
31 |
62 |
13 |
3 |
5 |
29 |
13 |
74 |
4 |
4 |
| Daniel Vazquez |
R |
22 |
SS |
496 |
449 |
50 |
97 |
18 |
3 |
2 |
36 |
37 |
128 |
12 |
6 |
| Carter Frederick |
R |
23 |
RF |
402 |
367 |
45 |
73 |
21 |
3 |
2 |
31 |
30 |
159 |
8 |
2 |
| Diego Guzman |
R |
22 |
3B |
200 |
179 |
16 |
31 |
7 |
1 |
1 |
13 |
9 |
83 |
4 |
2 |
| Omar Hernandez |
R |
24 |
C |
318 |
292 |
27 |
57 |
10 |
1 |
1 |
22 |
13 |
76 |
7 |
3 |
| Spencer Nivens |
L |
24 |
LF |
483 |
432 |
45 |
89 |
16 |
2 |
9 |
44 |
45 |
130 |
7 |
3 |
| Bryan Gonzalez |
R |
24 |
DH |
371 |
345 |
38 |
74 |
13 |
4 |
7 |
35 |
20 |
139 |
8 |
5 |
| Derlin Figueroa |
L |
22 |
3B |
508 |
462 |
49 |
92 |
14 |
2 |
8 |
40 |
35 |
135 |
10 |
3 |
| Erick Torres |
R |
21 |
LF |
490 |
443 |
44 |
92 |
13 |
1 |
3 |
37 |
28 |
93 |
8 |
7 |
| Trevor Werner |
R |
25 |
RF |
406 |
368 |
41 |
67 |
14 |
4 |
8 |
37 |
29 |
164 |
9 |
4 |
Batters – Advanced
| Player |
PA |
BA |
OBP |
SLG |
OPS+ |
ISO |
BABIP |
Def |
WAR |
wOBA |
3YOPS+ |
RC |
| Bobby Witt Jr. |
658 |
.283 |
.337 |
.505 |
132 |
.222 |
.313 |
7 |
6.7 |
.356 |
130 |
112 |
| Maikel Garcia |
635 |
.263 |
.324 |
.391 |
100 |
.128 |
.301 |
9 |
3.7 |
.313 |
99 |
80 |
| Carter Jensen |
585 |
.242 |
.317 |
.401 |
100 |
.159 |
.316 |
1 |
3.0 |
.313 |
104 |
68 |
| Vinnie Pasquantino |
613 |
.253 |
.320 |
.452 |
113 |
.199 |
.261 |
-4 |
1.8 |
.330 |
112 |
80 |
| Kameron Misner |
451 |
.210 |
.300 |
.356 |
84 |
.146 |
.299 |
5 |
1.8 |
.291 |
84 |
47 |
| Salvador Perez |
575 |
.246 |
.296 |
.430 |
100 |
.184 |
.279 |
-8 |
1.7 |
.310 |
93 |
68 |
| Jonathan India |
555 |
.238 |
.336 |
.368 |
98 |
.130 |
.285 |
-7 |
1.6 |
.314 |
97 |
61 |
| Jac Caglianone |
524 |
.254 |
.321 |
.446 |
112 |
.192 |
.289 |
-3 |
1.6 |
.331 |
118 |
69 |
| Carson Roccaforte |
531 |
.206 |
.285 |
.352 |
78 |
.146 |
.306 |
7 |
1.5 |
.281 |
84 |
55 |
| Drew Waters |
448 |
.224 |
.291 |
.377 |
86 |
.153 |
.314 |
3 |
1.5 |
.292 |
88 |
49 |
| Kyle Isbel |
394 |
.237 |
.290 |
.358 |
81 |
.121 |
.286 |
8 |
1.5 |
.284 |
81 |
40 |
| Bobby Dalbec |
462 |
.221 |
.294 |
.385 |
89 |
.164 |
.342 |
1 |
1.4 |
.297 |
86 |
49 |
| John Rave |
487 |
.230 |
.304 |
.374 |
89 |
.144 |
.303 |
-2 |
1.3 |
.298 |
88 |
54 |
| Tyler Tolbert |
443 |
.223 |
.281 |
.322 |
69 |
.099 |
.309 |
6 |
1.3 |
.268 |
71 |
45 |
| Harold Castro |
372 |
.258 |
.295 |
.403 |
94 |
.145 |
.311 |
0 |
1.2 |
.302 |
88 |
42 |
| Michael Massey |
427 |
.243 |
.286 |
.380 |
85 |
.137 |
.282 |
2 |
1.2 |
.289 |
84 |
44 |
| Nick Loftin |
428 |
.238 |
.323 |
.356 |
91 |
.118 |
.271 |
4 |
1.1 |
.302 |
91 |
46 |
| Diego Castillo |
412 |
.234 |
.308 |
.334 |
81 |
.100 |
.287 |
0 |
0.7 |
.287 |
82 |
40 |
| Isan Díaz |
241 |
.212 |
.297 |
.377 |
88 |
.165 |
.259 |
-1 |
0.7 |
.297 |
85 |
25 |
| Jordan Groshans |
401 |
.236 |
.302 |
.310 |
73 |
.074 |
.287 |
3 |
0.6 |
.274 |
73 |
34 |
| Sam Kulasingam |
527 |
.235 |
.298 |
.316 |
73 |
.081 |
.298 |
2 |
0.6 |
.273 |
74 |
49 |
| Connor Kaiser |
334 |
.185 |
.274 |
.291 |
59 |
.106 |
.287 |
5 |
0.6 |
.256 |
56 |
24 |
| Dairon Blanco |
318 |
.241 |
.305 |
.358 |
86 |
.117 |
.323 |
0 |
0.5 |
.293 |
83 |
40 |
| Luke Maile |
161 |
.223 |
.319 |
.331 |
83 |
.108 |
.308 |
-1 |
0.5 |
.293 |
76 |
15 |
| Rudy Martin |
320 |
.231 |
.300 |
.335 |
78 |
.104 |
.313 |
-3 |
0.4 |
.283 |
76 |
35 |
| Tyler Gentry |
441 |
.216 |
.289 |
.348 |
78 |
.132 |
.299 |
5 |
0.4 |
.282 |
79 |
41 |
| Blake Mitchell |
371 |
.182 |
.295 |
.292 |
66 |
.110 |
.305 |
-2 |
0.3 |
.268 |
76 |
31 |
| Peyton Wilson |
471 |
.221 |
.296 |
.330 |
76 |
.109 |
.298 |
-5 |
0.3 |
.280 |
79 |
45 |
| Randal Grichuk |
347 |
.238 |
.291 |
.406 |
93 |
.168 |
.278 |
0 |
0.3 |
.301 |
88 |
38 |
| Javi Vaz |
492 |
.230 |
.308 |
.307 |
74 |
.077 |
.258 |
-5 |
0.2 |
.277 |
75 |
44 |
| Mark Canha |
352 |
.234 |
.330 |
.340 |
89 |
.106 |
.288 |
-3 |
0.2 |
.301 |
83 |
35 |
| Canyon Brown |
268 |
.203 |
.267 |
.266 |
51 |
.063 |
.291 |
3 |
0.1 |
.242 |
56 |
18 |
| Julio E. Rodriguez |
214 |
.205 |
.271 |
.318 |
65 |
.113 |
.263 |
-1 |
0.1 |
.263 |
63 |
17 |
| Luca Tresh |
348 |
.222 |
.278 |
.361 |
78 |
.139 |
.282 |
-8 |
0.1 |
.279 |
79 |
32 |
| Brian O’Keefe |
279 |
.197 |
.263 |
.346 |
69 |
.149 |
.250 |
-3 |
0.0 |
.268 |
65 |
24 |
| Justin Johnson |
346 |
.199 |
.267 |
.280 |
54 |
.081 |
.267 |
5 |
0.0 |
.247 |
57 |
25 |
| Adam Frazier |
406 |
.231 |
.292 |
.326 |
74 |
.095 |
.275 |
-4 |
-0.1 |
.274 |
70 |
38 |
| Dustin Dickerson |
438 |
.194 |
.286 |
.243 |
51 |
.049 |
.273 |
2 |
-0.1 |
.247 |
53 |
30 |
| Kyle Hayes |
150 |
.159 |
.277 |
.222 |
43 |
.063 |
.288 |
1 |
-0.1 |
.239 |
42 |
8 |
| Austin Charles |
365 |
.203 |
.260 |
.294 |
55 |
.091 |
.298 |
4 |
-0.2 |
.246 |
60 |
29 |
| Chris Brito |
251 |
.217 |
.306 |
.295 |
71 |
.078 |
.295 |
2 |
-0.2 |
.272 |
74 |
20 |
| Gavin Cross |
477 |
.209 |
.263 |
.345 |
69 |
.136 |
.286 |
3 |
-0.2 |
.265 |
73 |
44 |
| Hunter Renfroe |
381 |
.219 |
.283 |
.372 |
82 |
.153 |
.256 |
-3 |
-0.2 |
.287 |
78 |
37 |
| Jack Pineda |
272 |
.208 |
.270 |
.265 |
52 |
.057 |
.292 |
0 |
-0.2 |
.243 |
52 |
19 |
| MJ Melendez |
526 |
.219 |
.283 |
.399 |
89 |
.180 |
.283 |
-6 |
-0.2 |
.295 |
91 |
58 |
| Sam Ruta |
306 |
.190 |
.265 |
.307 |
60 |
.117 |
.351 |
2 |
-0.2 |
.255 |
62 |
23 |
| Colton Becker |
369 |
.217 |
.293 |
.268 |
60 |
.051 |
.285 |
-6 |
-0.3 |
.257 |
60 |
32 |
| Nick Pratto |
455 |
.206 |
.287 |
.337 |
75 |
.131 |
.311 |
1 |
-0.3 |
.278 |
76 |
41 |
| Brett Squires |
469 |
.213 |
.279 |
.326 |
69 |
.113 |
.316 |
3 |
-0.4 |
.269 |
72 |
42 |
| Diego Hernandez |
330 |
.225 |
.258 |
.317 |
60 |
.092 |
.317 |
-1 |
-0.5 |
.251 |
64 |
29 |
| Nick Gordon |
287 |
.233 |
.276 |
.361 |
77 |
.128 |
.305 |
-8 |
-0.6 |
.277 |
77 |
29 |
| Daniel Vazquez |
496 |
.216 |
.276 |
.283 |
58 |
.067 |
.298 |
-4 |
-0.7 |
.250 |
62 |
40 |
| Carter Frederick |
402 |
.199 |
.266 |
.289 |
56 |
.090 |
.345 |
3 |
-0.8 |
.249 |
61 |
31 |
| Diego Guzman |
200 |
.173 |
.216 |
.240 |
28 |
.067 |
.316 |
1 |
-0.9 |
.204 |
38 |
11 |
| Omar Hernandez |
318 |
.195 |
.235 |
.247 |
36 |
.052 |
.260 |
0 |
-0.9 |
.216 |
40 |
20 |
| Spencer Nivens |
483 |
.206 |
.280 |
.315 |
67 |
.109 |
.273 |
-1 |
-0.9 |
.264 |
73 |
41 |
| Bryan Gonzalez |
371 |
.214 |
.263 |
.336 |
67 |
.122 |
.337 |
0 |
-0.9 |
.262 |
69 |
34 |
| Derlin Figueroa |
508 |
.199 |
.258 |
.290 |
54 |
.091 |
.263 |
-3 |
-1.2 |
.244 |
60 |
38 |
| Erick Torres |
490 |
.208 |
.264 |
.262 |
49 |
.054 |
.256 |
7 |
-1.4 |
.238 |
55 |
35 |
| Trevor Werner |
406 |
.182 |
.245 |
.307 |
54 |
.125 |
.301 |
0 |
-1.4 |
.244 |
56 |
31 |
Batters – Top Near-Age Offensive Comps
Batters – 80th/20th Percentiles
| Player |
80th BA |
80th OBP |
80th SLG |
80th OPS+ |
80th WAR |
20th BA |
20th OBP |
20th SLG |
20th OPS+ |
20th WAR |
| Bobby Witt Jr. |
.307 |
.365 |
.573 |
157 |
8.8 |
.258 |
.312 |
.450 |
111 |
5.0 |
| Maikel Garcia |
.288 |
.354 |
.436 |
119 |
5.3 |
.237 |
.299 |
.351 |
82 |
2.3 |
| Carter Jensen |
.268 |
.344 |
.454 |
121 |
4.6 |
.214 |
.289 |
.346 |
79 |
1.6 |
| Vinnie Pasquantino |
.277 |
.345 |
.507 |
133 |
3.3 |
.230 |
.297 |
.402 |
93 |
0.3 |
| Kameron Misner |
.232 |
.325 |
.402 |
100 |
2.8 |
.183 |
.272 |
.312 |
65 |
0.7 |
| Salvador Perez |
.269 |
.317 |
.480 |
117 |
3.0 |
.219 |
.271 |
.374 |
77 |
0.1 |
| Jonathan India |
.263 |
.362 |
.418 |
116 |
3.0 |
.213 |
.310 |
.326 |
81 |
0.4 |
| Jac Caglianone |
.280 |
.346 |
.505 |
134 |
3.0 |
.226 |
.292 |
.383 |
89 |
0.0 |
| Carson Roccaforte |
.233 |
.312 |
.405 |
99 |
2.9 |
.178 |
.260 |
.306 |
59 |
0.3 |
| Drew Waters |
.251 |
.318 |
.421 |
104 |
2.4 |
.194 |
.258 |
.322 |
64 |
0.2 |
| Kyle Isbel |
.264 |
.316 |
.408 |
101 |
2.5 |
.210 |
.265 |
.310 |
62 |
0.5 |
| Bobby Dalbec |
.249 |
.323 |
.445 |
111 |
2.7 |
.194 |
.270 |
.341 |
69 |
0.3 |
| John Rave |
.254 |
.329 |
.420 |
107 |
2.4 |
.201 |
.272 |
.323 |
65 |
-0.1 |
| Tyler Tolbert |
.258 |
.310 |
.374 |
92 |
2.7 |
.196 |
.253 |
.277 |
50 |
0.3 |
| Harold Castro |
.289 |
.326 |
.456 |
114 |
2.2 |
.232 |
.269 |
.359 |
74 |
0.3 |
| Michael Massey |
.270 |
.310 |
.429 |
106 |
2.3 |
.215 |
.258 |
.328 |
65 |
0.1 |
| Nick Loftin |
.262 |
.347 |
.404 |
110 |
2.1 |
.213 |
.295 |
.316 |
73 |
0.1 |
| Diego Castillo |
.255 |
.337 |
.374 |
98 |
1.6 |
.206 |
.283 |
.296 |
64 |
-0.2 |
| Isan Díaz |
.238 |
.323 |
.434 |
108 |
1.3 |
.188 |
.269 |
.326 |
67 |
0.1 |
| Jordan Groshans |
.263 |
.330 |
.351 |
90 |
1.5 |
.205 |
.273 |
.272 |
55 |
-0.4 |
| Sam Kulasingam |
.261 |
.322 |
.355 |
90 |
1.7 |
.211 |
.273 |
.276 |
56 |
-0.6 |
| Connor Kaiser |
.213 |
.303 |
.350 |
82 |
1.6 |
.154 |
.243 |
.246 |
40 |
-0.2 |
| Dairon Blanco |
.273 |
.334 |
.405 |
106 |
1.4 |
.212 |
.276 |
.310 |
67 |
-0.4 |
| Luke Maile |
.255 |
.349 |
.379 |
104 |
1.0 |
.192 |
.290 |
.290 |
65 |
0.2 |
| Rudy Martin |
.263 |
.330 |
.380 |
98 |
1.3 |
.205 |
.272 |
.291 |
59 |
-0.4 |
| Tyler Gentry |
.246 |
.318 |
.396 |
98 |
1.6 |
.190 |
.265 |
.305 |
61 |
-0.5 |
| Blake Mitchell |
.218 |
.327 |
.353 |
90 |
1.5 |
.149 |
.263 |
.237 |
44 |
-0.8 |
| Peyton Wilson |
.249 |
.325 |
.380 |
97 |
1.5 |
.194 |
.271 |
.293 |
60 |
-0.7 |
| Randal Grichuk |
.267 |
.321 |
.464 |
117 |
1.3 |
.211 |
.265 |
.357 |
74 |
-0.6 |
| Javi Vaz |
.255 |
.332 |
.344 |
91 |
1.2 |
.201 |
.280 |
.270 |
57 |
-1.0 |
| Mark Canha |
.263 |
.354 |
.377 |
104 |
0.9 |
.207 |
.302 |
.301 |
71 |
-0.7 |
| Canyon Brown |
.230 |
.300 |
.306 |
68 |
0.7 |
.172 |
.240 |
.227 |
33 |
-0.6 |
| Julio E. Rodriguez |
.237 |
.303 |
.377 |
91 |
0.8 |
.178 |
.239 |
.279 |
46 |
-0.4 |
| Luca Tresh |
.253 |
.309 |
.416 |
101 |
1.1 |
.193 |
.247 |
.313 |
58 |
-0.8 |
| Brian O’Keefe |
.226 |
.292 |
.405 |
90 |
0.8 |
.174 |
.235 |
.289 |
48 |
-0.7 |
| Justin Johnson |
.230 |
.299 |
.334 |
76 |
1.0 |
.174 |
.243 |
.242 |
36 |
-0.8 |
| Adam Frazier |
.258 |
.321 |
.377 |
93 |
1.0 |
.202 |
.265 |
.279 |
54 |
-1.1 |
| Dustin Dickerson |
.220 |
.313 |
.276 |
66 |
0.7 |
.167 |
.262 |
.210 |
36 |
-1.0 |
| Kyle Hayes |
.189 |
.309 |
.273 |
66 |
0.4 |
.128 |
.243 |
.181 |
24 |
-0.5 |
| Austin Charles |
.228 |
.289 |
.340 |
73 |
0.6 |
.173 |
.234 |
.256 |
35 |
-1.1 |
| Chris Brito |
.247 |
.336 |
.336 |
88 |
0.4 |
.191 |
.276 |
.259 |
53 |
-0.8 |
| Gavin Cross |
.237 |
.288 |
.401 |
90 |
1.1 |
.183 |
.237 |
.305 |
52 |
-1.3 |
| Hunter Renfroe |
.244 |
.311 |
.422 |
102 |
0.8 |
.192 |
.259 |
.329 |
65 |
-1.0 |
| Jack Pineda |
.236 |
.297 |
.304 |
70 |
0.4 |
.182 |
.243 |
.231 |
35 |
-0.8 |
| MJ Melendez |
.248 |
.309 |
.457 |
109 |
1.2 |
.194 |
.252 |
.341 |
66 |
-1.7 |
| Sam Ruta |
.222 |
.297 |
.364 |
83 |
0.7 |
.163 |
.240 |
.260 |
42 |
-0.9 |
| Colton Becker |
.241 |
.320 |
.301 |
76 |
0.5 |
.190 |
.269 |
.239 |
45 |
-1.0 |
| Nick Pratto |
.235 |
.314 |
.386 |
95 |
0.9 |
.182 |
.262 |
.296 |
58 |
-1.3 |
| Brett Squires |
.243 |
.307 |
.383 |
91 |
1.0 |
.185 |
.254 |
.288 |
53 |
-1.4 |
| Diego Hernandez |
.259 |
.290 |
.365 |
83 |
0.4 |
.200 |
.233 |
.274 |
43 |
-1.2 |
| Nick Gordon |
.265 |
.309 |
.424 |
102 |
0.3 |
.204 |
.250 |
.316 |
59 |
-1.3 |
| Daniel Vazquez |
.244 |
.306 |
.326 |
77 |
0.6 |
.189 |
.252 |
.246 |
40 |
-1.8 |
| Carter Frederick |
.228 |
.296 |
.327 |
74 |
0.1 |
.175 |
.240 |
.247 |
38 |
-1.8 |
| Diego Guzman |
.207 |
.250 |
.290 |
49 |
-0.4 |
.146 |
.189 |
.195 |
9 |
-1.5 |
| Omar Hernandez |
.226 |
.269 |
.292 |
58 |
0.0 |
.166 |
.208 |
.210 |
19 |
-1.6 |
| Spencer Nivens |
.232 |
.306 |
.360 |
85 |
0.2 |
.180 |
.255 |
.274 |
49 |
-2.1 |
| Bryan Gonzalez |
.246 |
.292 |
.388 |
88 |
0.1 |
.189 |
.235 |
.287 |
47 |
-1.9 |
| Derlin Figueroa |
.226 |
.289 |
.337 |
73 |
0.2 |
.174 |
.234 |
.253 |
38 |
-2.2 |
| Erick Torres |
.231 |
.288 |
.293 |
62 |
-0.5 |
.183 |
.237 |
.232 |
33 |
-2.4 |
| Trevor Werner |
.211 |
.273 |
.358 |
73 |
-0.3 |
.153 |
.219 |
.255 |
33 |
-2.4 |
Batters – Platoon Splits
| Player |
BA vs. L |
OBP vs. L |
SLG vs. L |
BA vs. R |
OBP vs. R |
SLG vs. R |
| Bobby Witt Jr. |
.287 |
.346 |
.515 |
.281 |
.334 |
.501 |
| Maikel Garcia |
.276 |
.342 |
.425 |
.256 |
.316 |
.374 |
| Carter Jensen |
.235 |
.307 |
.342 |
.245 |
.321 |
.425 |
| Vinnie Pasquantino |
.243 |
.309 |
.414 |
.258 |
.325 |
.468 |
| Kameron Misner |
.194 |
.276 |
.326 |
.217 |
.311 |
.371 |
| Salvador Perez |
.247 |
.302 |
.432 |
.246 |
.293 |
.430 |
| Jonathan India |
.242 |
.344 |
.379 |
.237 |
.333 |
.364 |
| Jac Caglianone |
.246 |
.311 |
.418 |
.257 |
.324 |
.457 |
| Carson Roccaforte |
.198 |
.271 |
.341 |
.209 |
.290 |
.355 |
| Drew Waters |
.221 |
.278 |
.359 |
.226 |
.298 |
.387 |
| Kyle Isbel |
.224 |
.280 |
.316 |
.241 |
.294 |
.374 |
| Bobby Dalbec |
.228 |
.303 |
.402 |
.218 |
.291 |
.377 |
| John Rave |
.223 |
.297 |
.346 |
.233 |
.307 |
.385 |
| Tyler Tolbert |
.234 |
.299 |
.347 |
.219 |
.273 |
.311 |
| Harold Castro |
.244 |
.280 |
.359 |
.262 |
.299 |
.416 |
| Michael Massey |
.231 |
.278 |
.350 |
.248 |
.290 |
.392 |
| Nick Loftin |
.243 |
.338 |
.360 |
.235 |
.315 |
.353 |
| Diego Castillo |
.241 |
.318 |
.358 |
.229 |
.302 |
.320 |
| Isan Díaz |
.212 |
.297 |
.333 |
.212 |
.297 |
.397 |
| Jordan Groshans |
.242 |
.315 |
.305 |
.233 |
.295 |
.314 |
| Sam Kulasingam |
.231 |
.294 |
.315 |
.237 |
.300 |
.317 |
| Connor Kaiser |
.189 |
.287 |
.316 |
.183 |
.267 |
.279 |
| Dairon Blanco |
.250 |
.315 |
.366 |
.235 |
.299 |
.353 |
| Luke Maile |
.222 |
.327 |
.333 |
.223 |
.315 |
.330 |
| Rudy Martin |
.227 |
.292 |
.309 |
.234 |
.304 |
.348 |
| Tyler Gentry |
.216 |
.298 |
.366 |
.215 |
.285 |
.338 |
| Blake Mitchell |
.175 |
.283 |
.238 |
.185 |
.299 |
.311 |
| Peyton Wilson |
.223 |
.296 |
.331 |
.220 |
.296 |
.330 |
| Randal Grichuk |
.250 |
.305 |
.435 |
.231 |
.284 |
.392 |
| Javi Vaz |
.226 |
.297 |
.304 |
.231 |
.311 |
.308 |
| Mark Canha |
.238 |
.333 |
.347 |
.233 |
.328 |
.337 |
| Canyon Brown |
.203 |
.268 |
.284 |
.202 |
.267 |
.258 |
| Julio E. Rodriguez |
.206 |
.280 |
.324 |
.205 |
.266 |
.315 |
| Luca Tresh |
.232 |
.294 |
.394 |
.217 |
.271 |
.346 |
| Brian O’Keefe |
.208 |
.276 |
.354 |
.190 |
.254 |
.342 |
| Justin Johnson |
.204 |
.279 |
.280 |
.197 |
.263 |
.280 |
| Adam Frazier |
.221 |
.277 |
.291 |
.234 |
.297 |
.337 |
| Dustin Dickerson |
.197 |
.291 |
.248 |
.192 |
.283 |
.242 |
| Kyle Hayes |
.171 |
.292 |
.220 |
.153 |
.270 |
.224 |
| Austin Charles |
.191 |
.255 |
.281 |
.207 |
.261 |
.299 |
| Chris Brito |
.215 |
.307 |
.308 |
.217 |
.306 |
.289 |
| Gavin Cross |
.208 |
.254 |
.336 |
.210 |
.266 |
.349 |
| Hunter Renfroe |
.226 |
.303 |
.396 |
.216 |
.275 |
.361 |
| Jack Pineda |
.194 |
.260 |
.239 |
.213 |
.273 |
.275 |
| MJ Melendez |
.221 |
.276 |
.364 |
.218 |
.286 |
.413 |
| Sam Ruta |
.182 |
.247 |
.286 |
.193 |
.271 |
.315 |
| Colton Becker |
.224 |
.306 |
.265 |
.213 |
.288 |
.269 |
| Nick Pratto |
.202 |
.283 |
.326 |
.208 |
.289 |
.343 |
| Brett Squires |
.200 |
.262 |
.304 |
.218 |
.286 |
.333 |
| Diego Hernandez |
.223 |
.253 |
.298 |
.226 |
.260 |
.325 |
| Nick Gordon |
.215 |
.257 |
.338 |
.239 |
.282 |
.368 |
| Daniel Vazquez |
.213 |
.279 |
.291 |
.217 |
.274 |
.280 |
| Carter Frederick |
.205 |
.276 |
.313 |
.196 |
.262 |
.278 |
| Diego Guzman |
.186 |
.226 |
.220 |
.167 |
.211 |
.250 |
| Omar Hernandez |
.196 |
.242 |
.228 |
.195 |
.232 |
.255 |
| Spencer Nivens |
.198 |
.263 |
.281 |
.209 |
.286 |
.328 |
| Bryan Gonzalez |
.220 |
.271 |
.340 |
.212 |
.260 |
.335 |
| Derlin Figueroa |
.192 |
.246 |
.267 |
.202 |
.262 |
.298 |
| Erick Torres |
.210 |
.269 |
.266 |
.207 |
.262 |
.260 |
| Trevor Werner |
.179 |
.248 |
.292 |
.183 |
.244 |
.313 |
Pitchers – Standard
| Player |
T |
Age |
W |
L |
ERA |
G |
GS |
IP |
H |
ER |
HR |
BB |
SO |
| Cole Ragans |
L |
28 |
8 |
5 |
3.51 |
24 |
22 |
118.0 |
95 |
46 |
12 |
41 |
148 |
| Kris Bubic |
L |
28 |
8 |
5 |
3.57 |
23 |
19 |
106.0 |
98 |
42 |
10 |
35 |
105 |
| Noah Cameron |
L |
26 |
8 |
8 |
4.08 |
27 |
27 |
141.3 |
135 |
64 |
19 |
44 |
122 |
| Michael Wacha |
R |
34 |
9 |
10 |
4.10 |
27 |
27 |
147.0 |
143 |
67 |
18 |
43 |
112 |
| Stephen Kolek |
R |
29 |
7 |
7 |
4.23 |
29 |
24 |
129.7 |
130 |
61 |
12 |
42 |
89 |
| Seth Lugo |
R |
36 |
7 |
8 |
4.29 |
25 |
23 |
134.3 |
132 |
64 |
20 |
45 |
111 |
| Hunter Harvey |
R |
31 |
4 |
2 |
3.04 |
46 |
1 |
47.3 |
40 |
16 |
4 |
12 |
50 |
| Michael Lorenzen |
R |
34 |
7 |
8 |
4.57 |
25 |
24 |
130.0 |
126 |
66 |
20 |
47 |
103 |
| Bailey Falter |
L |
29 |
6 |
7 |
4.00 |
26 |
24 |
118.3 |
117 |
59 |
16 |
40 |
83 |
| Ryan Bergert |
R |
26 |
3 |
4 |
4.46 |
26 |
23 |
103.0 |
100 |
51 |
13 |
43 |
86 |
| Luinder Avila |
R |
24 |
4 |
5 |
4.46 |
25 |
15 |
80.7 |
77 |
40 |
9 |
35 |
69 |
| Kyle Wright |
R |
30 |
5 |
5 |
4.52 |
15 |
15 |
77.7 |
75 |
39 |
9 |
29 |
63 |
| Daniel Lynch IV |
L |
29 |
4 |
5 |
4.35 |
40 |
13 |
97.3 |
100 |
47 |
13 |
33 |
75 |
| Angel Zerpa |
L |
26 |
3 |
4 |
3.92 |
56 |
5 |
66.7 |
64 |
29 |
7 |
22 |
56 |
| Jonathan Bowlan |
R |
29 |
4 |
5 |
4.24 |
42 |
8 |
80.7 |
78 |
38 |
10 |
29 |
74 |
| Lucas Erceg |
R |
31 |
5 |
5 |
3.76 |
55 |
0 |
55.0 |
49 |
23 |
4 |
22 |
52 |
| Ben Kudrna |
R |
23 |
4 |
7 |
4.84 |
23 |
21 |
100.3 |
101 |
54 |
12 |
45 |
77 |
| Carlos Estévez |
R |
33 |
4 |
4 |
3.95 |
59 |
0 |
57.0 |
49 |
25 |
6 |
20 |
49 |
| Hunter Owen |
L |
24 |
4 |
6 |
4.86 |
21 |
19 |
90.7 |
91 |
49 |
12 |
36 |
71 |
| John Schreiber |
R |
32 |
3 |
3 |
3.97 |
63 |
0 |
56.7 |
51 |
25 |
6 |
20 |
53 |
| Alex Lange |
R |
30 |
3 |
3 |
3.83 |
43 |
1 |
40.0 |
32 |
17 |
3 |
23 |
44 |
| Alec Marsh |
R |
28 |
5 |
8 |
4.88 |
20 |
17 |
94.0 |
92 |
51 |
13 |
39 |
84 |
| James McArthur |
R |
29 |
3 |
3 |
4.27 |
30 |
4 |
46.3 |
45 |
22 |
5 |
17 |
42 |
| Mason Black |
R |
26 |
5 |
7 |
5.00 |
27 |
23 |
108.0 |
109 |
60 |
15 |
47 |
87 |
| Steven Zobac |
R |
25 |
4 |
5 |
4.89 |
18 |
17 |
73.7 |
78 |
40 |
11 |
21 |
55 |
| Hunter Patteson |
L |
26 |
4 |
5 |
5.04 |
22 |
18 |
94.7 |
102 |
53 |
14 |
31 |
64 |
| Tyson Guerrero |
L |
27 |
4 |
5 |
5.00 |
18 |
17 |
81.0 |
81 |
45 |
12 |
35 |
67 |
| Steven Cruz |
R |
27 |
2 |
3 |
4.13 |
52 |
1 |
52.3 |
46 |
24 |
5 |
23 |
48 |
| Chandler Champlain |
R |
26 |
5 |
8 |
5.00 |
25 |
22 |
113.3 |
122 |
63 |
15 |
40 |
76 |
| Spencer Turnbull |
R |
33 |
3 |
5 |
5.04 |
17 |
13 |
64.3 |
68 |
36 |
8 |
27 |
46 |
| Jonathan Heasley |
R |
29 |
3 |
4 |
4.95 |
24 |
12 |
76.3 |
80 |
42 |
11 |
27 |
52 |
| Dallas Keuchel |
L |
38 |
3 |
3 |
5.07 |
12 |
12 |
55.0 |
65 |
31 |
7 |
23 |
34 |
| John Gant |
R |
33 |
3 |
5 |
5.13 |
16 |
16 |
66.7 |
73 |
38 |
10 |
29 |
45 |
| Henry Williams |
R |
24 |
4 |
7 |
5.23 |
20 |
19 |
96.3 |
101 |
56 |
14 |
39 |
67 |
| Ryan Ramsey |
L |
25 |
5 |
8 |
5.15 |
22 |
16 |
92.7 |
95 |
53 |
13 |
42 |
71 |
| Shane Panzini |
R |
24 |
4 |
5 |
5.13 |
22 |
16 |
86.0 |
90 |
49 |
13 |
42 |
67 |
| Taylor Clarke |
R |
33 |
2 |
2 |
4.64 |
45 |
3 |
54.3 |
56 |
28 |
8 |
16 |
42 |
| Stephen Nogosek |
R |
31 |
2 |
3 |
4.75 |
34 |
4 |
47.3 |
46 |
25 |
6 |
23 |
40 |
| Eric Cerantola |
R |
26 |
2 |
3 |
4.64 |
34 |
3 |
54.3 |
49 |
28 |
7 |
28 |
55 |
| Oscar Rayo |
L |
24 |
2 |
4 |
4.89 |
29 |
4 |
73.7 |
78 |
40 |
10 |
25 |
47 |
| Ryan Brady |
R |
27 |
2 |
4 |
4.79 |
27 |
1 |
47.0 |
50 |
25 |
6 |
16 |
34 |
| Cruz Noriega |
R |
28 |
2 |
4 |
5.07 |
24 |
4 |
49.7 |
53 |
28 |
7 |
20 |
35 |
| Anthony Simonelli |
R |
27 |
2 |
3 |
4.79 |
29 |
2 |
47.0 |
47 |
25 |
7 |
22 |
41 |
| A.J. Causey |
R |
23 |
7 |
8 |
4.48 |
46 |
0 |
64.3 |
62 |
32 |
8 |
24 |
52 |
| Justin Dunn |
R |
30 |
3 |
7 |
5.51 |
16 |
12 |
50.7 |
51 |
31 |
8 |
27 |
39 |
| Nate Ackenhausen |
L |
24 |
1 |
2 |
4.99 |
29 |
2 |
39.7 |
38 |
22 |
5 |
21 |
34 |
| Rich Hill |
L |
46 |
4 |
8 |
5.40 |
18 |
17 |
80.0 |
84 |
48 |
14 |
36 |
66 |
| Nick Robertson |
R |
27 |
1 |
2 |
4.72 |
41 |
0 |
47.7 |
47 |
25 |
6 |
24 |
43 |
| Sam Long |
L |
30 |
3 |
4 |
4.82 |
47 |
1 |
52.3 |
52 |
28 |
7 |
26 |
43 |
| Joey Krehbiel |
R |
33 |
3 |
3 |
4.93 |
40 |
0 |
49.3 |
53 |
27 |
7 |
19 |
32 |
| Chazz Martinez |
L |
26 |
2 |
3 |
4.79 |
45 |
0 |
62.0 |
62 |
33 |
8 |
29 |
51 |
| Frank Mozzicato |
L |
23 |
3 |
7 |
5.57 |
24 |
20 |
85.7 |
89 |
53 |
12 |
55 |
61 |
| Christian Chamberlain |
L |
26 |
2 |
4 |
5.02 |
41 |
0 |
43.0 |
38 |
24 |
5 |
29 |
42 |
| Caden Monke |
L |
26 |
4 |
5 |
4.89 |
40 |
0 |
53.3 |
52 |
29 |
6 |
31 |
44 |
| Ben Sears |
R |
26 |
2 |
3 |
5.14 |
38 |
0 |
56.0 |
60 |
32 |
8 |
20 |
36 |
| Brandon Johnson |
R |
27 |
3 |
4 |
5.13 |
46 |
1 |
59.7 |
60 |
34 |
9 |
27 |
51 |
| Nicholas Regalado |
R |
24 |
2 |
4 |
5.56 |
30 |
2 |
45.3 |
47 |
28 |
6 |
26 |
33 |
| Beck Way |
R |
26 |
3 |
7 |
5.54 |
37 |
5 |
66.7 |
68 |
41 |
8 |
38 |
45 |
| Ethan Bosacker |
R |
25 |
4 |
7 |
5.72 |
23 |
14 |
89.7 |
101 |
57 |
15 |
32 |
46 |
| Natanael Garabitos |
R |
25 |
1 |
4 |
6.03 |
32 |
0 |
34.3 |
36 |
23 |
5 |
25 |
24 |
| Marlin Willis |
L |
28 |
1 |
3 |
6.46 |
23 |
0 |
30.7 |
30 |
22 |
5 |
26 |
27 |
Pitchers – Advanced
| Player |
IP |
K/9 |
BB/9 |
HR/9 |
BB% |
K% |
BABIP |
ERA+ |
3ERA+ |
FIP |
ERA- |
WAR |
| Cole Ragans |
118.0 |
11.3 |
3.1 |
0.9 |
8.4% |
30.2% |
.294 |
119 |
116 |
3.10 |
84 |
2.2 |
| Kris Bubic |
106.0 |
8.9 |
3.0 |
0.8 |
7.8% |
23.5% |
.299 |
117 |
116 |
3.48 |
85 |
1.9 |
| Noah Cameron |
141.3 |
7.8 |
2.8 |
1.2 |
7.4% |
20.4% |
.284 |
102 |
104 |
4.22 |
98 |
1.7 |
| Michael Wacha |
147.0 |
6.9 |
2.6 |
1.1 |
6.9% |
18.1% |
.282 |
102 |
96 |
4.19 |
98 |
1.7 |
| Stephen Kolek |
129.7 |
6.2 |
2.9 |
0.8 |
7.6% |
16.1% |
.289 |
98 |
98 |
4.20 |
102 |
1.3 |
| Seth Lugo |
134.3 |
7.4 |
3.0 |
1.3 |
7.9% |
19.4% |
.284 |
97 |
90 |
4.56 |
103 |
1.3 |
| Hunter Harvey |
47.3 |
9.5 |
2.3 |
0.8 |
6.2% |
25.9% |
.288 |
137 |
132 |
3.04 |
73 |
1.0 |
| Michael Lorenzen |
130.0 |
7.1 |
3.3 |
1.4 |
8.4% |
18.4% |
.277 |
91 |
87 |
4.78 |
110 |
0.9 |
| Bailey Falter |
118.3 |
6.3 |
3.0 |
1.2 |
7.9% |
16.4% |
.277 |
93 |
93 |
4.58 |
108 |
0.9 |
| Ryan Bergert |
103.0 |
7.5 |
3.8 |
1.1 |
9.6% |
19.2% |
.288 |
93 |
96 |
4.47 |
108 |
0.8 |
| Luinder Avila |
80.7 |
7.7 |
3.9 |
1.0 |
9.9% |
19.5% |
.289 |
93 |
98 |
4.43 |
108 |
0.6 |
| Kyle Wright |
77.7 |
7.3 |
3.4 |
1.0 |
8.7% |
18.8% |
.287 |
92 |
92 |
4.40 |
109 |
0.6 |
| Daniel Lynch IV |
97.3 |
6.9 |
3.1 |
1.2 |
7.8% |
17.8% |
.293 |
96 |
95 |
4.50 |
104 |
0.6 |
| Angel Zerpa |
66.7 |
7.6 |
3.0 |
0.9 |
7.8% |
19.8% |
.291 |
106 |
109 |
3.97 |
94 |
0.6 |
| Jonathan Bowlan |
80.7 |
8.3 |
3.2 |
1.1 |
8.4% |
21.3% |
.296 |
98 |
99 |
4.13 |
102 |
0.6 |
| Lucas Erceg |
55.0 |
8.5 |
3.6 |
0.7 |
9.3% |
22.0% |
.292 |
111 |
109 |
3.69 |
90 |
0.5 |
| Ben Kudrna |
100.3 |
6.9 |
4.0 |
1.1 |
10.1% |
17.2% |
.292 |
86 |
92 |
4.68 |
116 |
0.4 |
| Carlos Estévez |
57.0 |
7.7 |
3.2 |
0.9 |
8.3% |
20.4% |
.267 |
106 |
101 |
3.97 |
95 |
0.4 |
| Hunter Owen |
90.7 |
7.0 |
3.6 |
1.2 |
9.1% |
17.9% |
.289 |
86 |
90 |
4.74 |
116 |
0.3 |
| John Schreiber |
56.7 |
8.4 |
3.2 |
1.0 |
8.4% |
22.2% |
.285 |
105 |
102 |
3.89 |
95 |
0.3 |
| Alex Lange |
40.0 |
9.9 |
5.2 |
0.7 |
13.0% |
24.9% |
.284 |
109 |
105 |
3.89 |
92 |
0.3 |
| Alec Marsh |
94.0 |
8.0 |
3.7 |
1.2 |
9.5% |
20.5% |
.293 |
85 |
86 |
4.64 |
117 |
0.3 |
| James McArthur |
46.3 |
8.2 |
3.3 |
1.0 |
8.5% |
21.0% |
.299 |
97 |
97 |
4.05 |
103 |
0.3 |
| Mason Black |
108.0 |
7.3 |
3.9 |
1.3 |
9.9% |
18.4% |
.291 |
83 |
87 |
4.89 |
120 |
0.2 |
| Steven Zobac |
73.7 |
6.7 |
2.6 |
1.3 |
6.6% |
17.4% |
.295 |
85 |
90 |
4.63 |
117 |
0.2 |
| Hunter Patteson |
94.7 |
6.1 |
2.9 |
1.3 |
7.5% |
15.5% |
.292 |
83 |
87 |
4.81 |
120 |
0.2 |
| Tyson Guerrero |
81.0 |
7.4 |
3.9 |
1.3 |
9.9% |
18.9% |
.289 |
83 |
85 |
4.99 |
120 |
0.2 |
| Steven Cruz |
52.3 |
8.3 |
4.0 |
0.9 |
10.2% |
21.2% |
.281 |
101 |
104 |
4.06 |
99 |
0.2 |
| Chandler Champlain |
113.3 |
6.0 |
3.2 |
1.2 |
8.0% |
15.3% |
.296 |
83 |
87 |
4.76 |
120 |
0.2 |
| Spencer Turnbull |
64.3 |
6.4 |
3.8 |
1.1 |
9.4% |
16.1% |
.297 |
83 |
80 |
4.89 |
121 |
0.1 |
| Jonathan Heasley |
76.3 |
6.1 |
3.2 |
1.3 |
8.1% |
15.5% |
.288 |
84 |
85 |
4.85 |
119 |
0.1 |
| Dallas Keuchel |
55.0 |
5.6 |
3.8 |
1.1 |
9.1% |
13.5% |
.314 |
82 |
75 |
4.89 |
122 |
0.1 |
| John Gant |
66.7 |
6.1 |
3.9 |
1.4 |
9.6% |
14.9% |
.296 |
81 |
77 |
5.16 |
123 |
0.0 |
| Henry Williams |
96.3 |
6.3 |
3.6 |
1.3 |
9.1% |
15.6% |
.289 |
80 |
85 |
5.09 |
125 |
0.0 |
| Ryan Ramsey |
92.7 |
6.9 |
4.1 |
1.3 |
10.1% |
17.1% |
.291 |
81 |
85 |
5.11 |
123 |
0.0 |
| Shane Panzini |
86.0 |
7.0 |
4.4 |
1.4 |
10.8% |
17.3% |
.294 |
81 |
86 |
5.18 |
123 |
0.0 |
| Taylor Clarke |
54.3 |
7.0 |
2.7 |
1.3 |
6.8% |
17.9% |
.291 |
90 |
86 |
4.53 |
111 |
0.0 |
| Stephen Nogosek |
47.3 |
7.6 |
4.4 |
1.1 |
11.0% |
19.1% |
.290 |
88 |
87 |
4.77 |
114 |
0.0 |
| Eric Cerantola |
54.3 |
9.1 |
4.6 |
1.2 |
11.5% |
22.6% |
.288 |
90 |
95 |
4.64 |
111 |
0.0 |
| Oscar Rayo |
73.7 |
5.7 |
3.1 |
1.2 |
7.8% |
14.7% |
.288 |
85 |
90 |
4.87 |
118 |
-0.1 |
| Ryan Brady |
47.0 |
6.5 |
3.1 |
1.1 |
7.7% |
16.4% |
.299 |
87 |
91 |
4.59 |
115 |
-0.1 |
| Cruz Noriega |
49.7 |
6.3 |
3.6 |
1.3 |
9.0% |
15.8% |
.295 |
82 |
84 |
4.92 |
122 |
-0.1 |
| Anthony Simonelli |
47.0 |
7.9 |
4.2 |
1.3 |
10.5% |
19.5% |
.292 |
87 |
89 |
4.95 |
115 |
-0.1 |
| A.J. Causey |
64.3 |
7.3 |
3.4 |
1.1 |
8.6% |
18.7% |
.284 |
93 |
99 |
4.47 |
107 |
-0.1 |
| Justin Dunn |
50.7 |
6.9 |
4.8 |
1.4 |
11.7% |
17.0% |
.283 |
76 |
76 |
5.69 |
132 |
-0.2 |
| Nate Ackenhausen |
39.7 |
7.7 |
4.8 |
1.1 |
11.9% |
19.2% |
.287 |
83 |
89 |
4.83 |
120 |
-0.2 |
| Rich Hill |
80.0 |
7.4 |
4.1 |
1.6 |
10.1% |
18.6% |
.294 |
77 |
73 |
5.29 |
130 |
-0.2 |
| Nick Robertson |
47.7 |
8.1 |
4.5 |
1.1 |
11.2% |
20.1% |
.297 |
88 |
92 |
4.63 |
114 |
-0.2 |
| Sam Long |
52.3 |
7.4 |
4.5 |
1.2 |
11.1% |
18.3% |
.290 |
87 |
85 |
4.86 |
115 |
-0.3 |
| Joey Krehbiel |
49.3 |
5.8 |
3.5 |
1.3 |
8.7% |
14.7% |
.291 |
85 |
82 |
4.93 |
118 |
-0.3 |
| Chazz Martinez |
62.0 |
7.4 |
4.2 |
1.2 |
10.4% |
18.3% |
.293 |
87 |
91 |
4.89 |
115 |
-0.3 |
| Frank Mozzicato |
85.7 |
6.4 |
5.8 |
1.3 |
13.6% |
15.1% |
.289 |
75 |
81 |
5.59 |
134 |
-0.4 |
| Christian Chamberlain |
43.0 |
8.8 |
6.1 |
1.0 |
14.6% |
21.2% |
.282 |
83 |
86 |
5.16 |
121 |
-0.4 |
| Caden Monke |
53.3 |
7.4 |
5.2 |
1.0 |
12.7% |
18.0% |
.291 |
85 |
88 |
4.94 |
117 |
-0.4 |
| Ben Sears |
56.0 |
5.8 |
3.2 |
1.3 |
8.2% |
14.7% |
.289 |
81 |
85 |
5.02 |
123 |
-0.5 |
| Brandon Johnson |
59.7 |
7.7 |
4.1 |
1.4 |
10.2% |
19.2% |
.291 |
81 |
84 |
4.92 |
123 |
-0.5 |
| Nicholas Regalado |
45.3 |
6.6 |
5.2 |
1.2 |
12.3% |
15.6% |
.293 |
75 |
79 |
5.48 |
133 |
-0.6 |
| Beck Way |
66.7 |
6.1 |
5.1 |
1.1 |
12.3% |
14.6% |
.286 |
75 |
78 |
5.53 |
133 |
-0.6 |
| Ethan Bosacker |
89.7 |
4.6 |
3.2 |
1.5 |
8.1% |
11.6% |
.286 |
73 |
77 |
5.55 |
137 |
-0.6 |
| Natanael Garabitos |
34.3 |
6.3 |
6.6 |
1.3 |
14.9% |
14.3% |
.290 |
69 |
74 |
6.19 |
145 |
-0.7 |
| Marlin Willis |
30.7 |
7.9 |
7.6 |
1.5 |
17.0% |
17.6% |
.284 |
65 |
67 |
6.55 |
155 |
-0.8 |
Pitchers – Top Near-Age Comps
Pitchers – Splits and Percentiles
| Player |
BA vs. L |
OBP vs. L |
SLG vs. L |
BA vs. R |
OBP vs. R |
SLG vs. R |
80th WAR |
20th WAR |
80th ERA |
20th ERA |
| Cole Ragans |
.241 |
.301 |
.384 |
.204 |
.276 |
.333 |
3.2 |
1.1 |
2.85 |
4.29 |
| Kris Bubic |
.250 |
.309 |
.370 |
.234 |
.297 |
.365 |
2.7 |
1.1 |
2.98 |
4.19 |
| Noah Cameron |
.218 |
.282 |
.387 |
.257 |
.316 |
.421 |
2.6 |
0.7 |
3.62 |
4.67 |
| Michael Wacha |
.235 |
.295 |
.377 |
.265 |
.315 |
.434 |
2.5 |
0.8 |
3.66 |
4.68 |
| Stephen Kolek |
.254 |
.325 |
.390 |
.255 |
.318 |
.387 |
2.1 |
0.6 |
3.76 |
4.74 |
| Seth Lugo |
.255 |
.328 |
.448 |
.251 |
.304 |
.414 |
2.1 |
0.3 |
3.75 |
5.02 |
| Hunter Harvey |
.226 |
.293 |
.369 |
.226 |
.270 |
.333 |
1.5 |
0.4 |
2.34 |
4.38 |
| Michael Lorenzen |
.246 |
.324 |
.431 |
.257 |
.315 |
.439 |
1.6 |
-0.1 |
4.09 |
5.26 |
| Bailey Falter |
.264 |
.309 |
.419 |
.250 |
.315 |
.419 |
1.6 |
0.1 |
4.04 |
5.11 |
| Ryan Bergert |
.254 |
.333 |
.418 |
.245 |
.316 |
.396 |
1.5 |
0.1 |
3.92 |
4.99 |
| Luinder Avila |
.246 |
.338 |
.381 |
.244 |
.325 |
.406 |
1.1 |
0.0 |
3.93 |
5.01 |
| Kyle Wright |
.260 |
.339 |
.473 |
.236 |
.309 |
.331 |
1.2 |
0.1 |
3.95 |
5.16 |
| Daniel Lynch IV |
.247 |
.315 |
.381 |
.263 |
.324 |
.436 |
1.2 |
-0.1 |
3.88 |
5.11 |
| Angel Zerpa |
.239 |
.299 |
.352 |
.251 |
.317 |
.404 |
1.1 |
0.1 |
3.34 |
4.56 |
| Jonathan Bowlan |
.248 |
.318 |
.418 |
.246 |
.311 |
.394 |
1.0 |
-0.1 |
3.75 |
5.11 |
| Lucas Erceg |
.235 |
.333 |
.367 |
.232 |
.304 |
.330 |
1.1 |
-0.2 |
3.09 |
4.65 |
| Ben Kudrna |
.250 |
.330 |
.383 |
.256 |
.337 |
.425 |
0.9 |
-0.2 |
4.45 |
5.40 |
| Carlos Estévez |
.238 |
.316 |
.376 |
.227 |
.289 |
.373 |
1.0 |
-0.3 |
3.18 |
5.00 |
| Hunter Owen |
.230 |
.304 |
.320 |
.264 |
.342 |
.457 |
0.9 |
-0.3 |
4.36 |
5.46 |
| John Schreiber |
.258 |
.330 |
.423 |
.220 |
.290 |
.339 |
0.9 |
-0.4 |
3.17 |
5.17 |
| Alex Lange |
.209 |
.329 |
.328 |
.222 |
.333 |
.333 |
0.7 |
-0.2 |
3.07 |
4.85 |
| Alec Marsh |
.273 |
.351 |
.460 |
.225 |
.309 |
.374 |
0.9 |
-0.4 |
4.30 |
5.52 |
| James McArthur |
.250 |
.330 |
.393 |
.242 |
.309 |
.384 |
0.6 |
-0.2 |
3.68 |
5.09 |
| Mason Black |
.233 |
.333 |
.402 |
.273 |
.342 |
.441 |
1.0 |
-0.5 |
4.48 |
5.62 |
| Steven Zobac |
.281 |
.342 |
.489 |
.250 |
.301 |
.406 |
0.8 |
-0.3 |
4.24 |
5.57 |
| Hunter Patteson |
.235 |
.281 |
.361 |
.280 |
.342 |
.477 |
0.7 |
-0.4 |
4.56 |
5.63 |
| Tyson Guerrero |
.253 |
.333 |
.391 |
.255 |
.341 |
.450 |
0.8 |
-0.5 |
4.38 |
5.63 |
| Steven Cruz |
.216 |
.303 |
.330 |
.245 |
.333 |
.391 |
0.5 |
-0.3 |
3.64 |
4.88 |
| Chandler Champlain |
.266 |
.336 |
.442 |
.270 |
.330 |
.430 |
1.1 |
-0.5 |
4.42 |
5.55 |
| Spencer Turnbull |
.266 |
.349 |
.430 |
.262 |
.340 |
.408 |
0.5 |
-0.3 |
4.47 |
5.76 |
| Jonathan Heasley |
.262 |
.331 |
.440 |
.267 |
.328 |
.447 |
0.5 |
-0.4 |
4.50 |
5.59 |
| Dallas Keuchel |
.255 |
.309 |
.353 |
.291 |
.358 |
.469 |
0.4 |
-0.3 |
4.48 |
5.88 |
| John Gant |
.270 |
.353 |
.467 |
.268 |
.333 |
.436 |
0.4 |
-0.5 |
4.63 |
5.84 |
| Henry Williams |
.252 |
.339 |
.380 |
.270 |
.339 |
.477 |
0.5 |
-0.6 |
4.80 |
5.76 |
| Ryan Ramsey |
.252 |
.347 |
.430 |
.262 |
.347 |
.431 |
0.5 |
-0.7 |
4.67 |
5.79 |
| Shane Panzini |
.267 |
.366 |
.453 |
.259 |
.332 |
.435 |
0.5 |
-0.6 |
4.67 |
5.72 |
| Taylor Clarke |
.263 |
.327 |
.434 |
.261 |
.306 |
.435 |
0.4 |
-0.5 |
3.94 |
5.52 |
| Stephen Nogosek |
.250 |
.351 |
.429 |
.248 |
.330 |
.386 |
0.4 |
-0.5 |
4.13 |
5.75 |
| Eric Cerantola |
.211 |
.314 |
.344 |
.252 |
.353 |
.429 |
0.5 |
-0.4 |
3.93 |
5.33 |
| Oscar Rayo |
.261 |
.327 |
.409 |
.267 |
.333 |
.447 |
0.3 |
-0.7 |
4.38 |
5.58 |
| Ryan Brady |
.259 |
.326 |
.400 |
.267 |
.328 |
.438 |
0.2 |
-0.6 |
4.25 |
5.65 |
| Cruz Noriega |
.256 |
.340 |
.411 |
.275 |
.333 |
.459 |
0.2 |
-0.6 |
4.54 |
5.98 |
| Anthony Simonelli |
.256 |
.356 |
.410 |
.252 |
.331 |
.449 |
0.2 |
-0.6 |
4.18 |
5.55 |
| A.J. Causey |
.284 |
.354 |
.474 |
.215 |
.291 |
.341 |
0.4 |
-0.6 |
3.90 |
5.15 |
| Justin Dunn |
.266 |
.391 |
.468 |
.250 |
.336 |
.423 |
0.2 |
-0.6 |
4.88 |
6.17 |
| Nate Ackenhausen |
.213 |
.327 |
.298 |
.259 |
.347 |
.454 |
0.1 |
-0.5 |
4.38 |
5.70 |
| Rich Hill |
.253 |
.352 |
.400 |
.266 |
.339 |
.480 |
0.4 |
-0.9 |
4.72 |
6.24 |
| Nick Robertson |
.253 |
.340 |
.410 |
.245 |
.336 |
.406 |
0.2 |
-0.7 |
4.07 |
5.55 |
| Sam Long |
.242 |
.329 |
.379 |
.259 |
.346 |
.439 |
0.1 |
-0.8 |
4.24 |
5.80 |
| Joey Krehbiel |
.262 |
.330 |
.393 |
.274 |
.336 |
.478 |
0.0 |
-0.7 |
4.32 |
5.67 |
| Chazz Martinez |
.257 |
.349 |
.351 |
.251 |
.342 |
.439 |
0.2 |
-0.8 |
4.13 |
5.51 |
| Frank Mozzicato |
.274 |
.386 |
.411 |
.255 |
.356 |
.441 |
0.2 |
-1.0 |
5.06 |
6.20 |
| Christian Chamberlain |
.218 |
.358 |
.309 |
.241 |
.371 |
.426 |
0.0 |
-0.7 |
4.26 |
5.76 |
| Caden Monke |
.230 |
.351 |
.361 |
.255 |
.353 |
.409 |
0.0 |
-0.8 |
4.30 |
5.63 |
| Ben Sears |
.250 |
.315 |
.400 |
.278 |
.348 |
.460 |
-0.2 |
-0.9 |
4.58 |
5.78 |
| Brandon Johnson |
.255 |
.342 |
.422 |
.254 |
.331 |
.433 |
-0.1 |
-1.0 |
4.59 |
5.90 |
| Nicholas Regalado |
.288 |
.400 |
.475 |
.238 |
.339 |
.386 |
-0.3 |
-0.9 |
5.02 |
6.13 |
| Beck Way |
.287 |
.399 |
.443 |
.236 |
.349 |
.399 |
-0.2 |
-1.2 |
4.98 |
6.38 |
| Ethan Bosacker |
.273 |
.344 |
.429 |
.282 |
.341 |
.505 |
-0.1 |
-1.2 |
5.23 |
6.29 |
| Natanael Garabitos |
.276 |
.408 |
.448 |
.256 |
.379 |
.449 |
-0.4 |
-1.0 |
5.45 |
7.00 |
| Marlin Willis |
.250 |
.400 |
.361 |
.250 |
.402 |
.476 |
-0.4 |
-1.1 |
5.56 |
7.69 |
Players are listed with their most recent teams wherever possible. This includes players who are unsigned or have retired, players who will miss 2026 due to injury, and players who were released in 2025. So yes, if you see Joe Schmoe, who quit baseball back in August to form a Ambient Math-Rock Trip-Hop Yacht Metal band that only performs in abandoned malls, he’s still listed here intentionally. ZiPS is assuming a league with an ERA of 4.16.
Hitters are ranked by zWAR, which is to say, WAR values as calculated by me, Dan Szymborski, whose surname is spelled with a z. WAR values might differ slightly from those that appear in the full release of ZiPS. Finally, I will advise anyone against — and might karate chop anyone guilty of — merely adding up WAR totals on a depth chart to produce projected team WAR. It is important to remember that ZiPS is agnostic about playing time, and has no information about, for example, how quickly a team will call up a prospect or what veteran has fallen into disfavor.
As always, incorrect projections are either caused by misinformation, a non-pragmatic reality, or by the skillful sabotage of our friend and former editor. You can, however, still get mad at me on Twitter or on Bluesky. This last is, however, not an actual requirement.