Archive for Daily Graphings

Contract Crowdsourcing: Adrian Beltre

Adrian Beltre took a one year deal with the Red Sox in order to reestablish his value and hit the market with better numbers than he posted last year. Mission accomplished, and then some. Beltre’s +7.1 WAR is second only to Josh Hamilton in the American League, as he’s been a revelation for the Red Sox. In addition to his legendary defense at third base, he’s found his power stroke again and has been one of the league’s best hitters this year. That combination of production on both sides of the field is something few players bring, and you can expect Scott Boras to point that out all winter long.

If Beltre could be expected to repeat his 2010 season, he’d be in for a monstrous payday. But Beltre is something of an enigma on offense, as his career batting runs totals show: from 2000, he’s gone +15.7, -2.3, -2.3, -7.8 +55.3, -6.9, +7.0, +10.3, +6.0, -7.9, and +33.9. You don’t really know what kind of production you’re going to get from him at the plate. He’s had two great years mixed in with a host of solid ones, and the uncertainty of knowing which version of Beltre you might get creates some risk, which drives down prices. But the upside is tantalizing, and while Beltre does turn 32 next year, he’s shown no signs of aging, and is as durable as they come.

He’s clearly the best third baseman on the market, and every team with a hole at the position will at least kick the tires to see what Boras’ asking price will be. So, now, it’s up to you guys to determine what that price will eventually settle on. What will Adrian Beltre sign for this winter?


Pedro Feliciano’s Elastic Arm

Without any inside knowledge about Pedro Feliciano’s personality or attitude toward New York, I have to imagine he is thrilled to be nearing free agency. That’s because over the last few seasons Feliciano has received fewer days off than the postal service. If he goes to another team, maybe he’ll be able to relax every once and a while.

Drafted by the Dodgers in 1995, the 31st round pick never appeared in the majors before signing with the Reds as a minor league free agent in 2001. Almost a year later, the Reds sent Feliciano to the Mets in a trade that also saw Brady Clark and Shawn Estes moved. Feliciano made his major league debut weeks later but the Mets placed him on waivers nearly three months to the day of acquiring him. The Tigers won the claim and then released him at the three-month anniversary too.

The Mets signed Feliciano once more and he made 23 appearances for them as a 26-year-old. After 2004, in which he saw 22 games but only 18 innings, the organization sold him to a team in Japan. Feliciano returned to the Big Apple in 2006, again with the Mets, and he has averaged 68 appearances per season since. It’s not just that Feliciano showed a rubber arm in one season either. His outings totals have increased in each subsequent season, although his innings pitched have not correlated perfectly.

His next appearance will mark a single season high 89th and that’s during a lost campaign for the Mets. One can only wonder if Jerry Manuel would flick his left wrist for Feliciano 100 times if it meant trying to keep up in a heated divisional race. Yet, Feliciano has been there each time, even though it’s meant zero days rest on 42 occasions.

One thing left unnoted is that Feliciano throws with his left arm. In his excellent book, Diamond Dollars, Vince Gennaro suggested that left-handed pitchers receive more pay than righties on the free agent market. I am unsure if that goes for relievers as well as starters, but Feliciano’s career .278 on-base percentage against same handed batters makes him a LOOGY delight. His numbers against righties the last few years suggest he’s probably best off facing lefties, which make his platoon numbers in 2007 look a bit weird.

Season – Percentage of Plate Appearances Versus LHB
2006 – 50%
2007 – 41%
2008 – 50%
2009 – 64%
2010 – 50%

Feliciano is in the midst of a career best season. If Manuel somehow returns as Mets’ manager, you have to think he’d want him back. If not because he’s good, just because he knows his name. Otherwise, some team in need of a left-handed set-up man will probably give Feliciano a multiple year deal and bank off his ability to stay healthy and active.


Carlos Lee to First?

This piece by Nick Cafardo of the Boston Globe mostly focuses on the postseason chances of Roy Oswalt‘s Philadelphia Phillies, but buried in there is also a nugget about Oswalt’s former team, the Houston Astros. Cafardo reports that in an attempt to increase Carlos Lee’s trade value, the team will move the struggling outfielder to first base to start the 2011 season.

Lee has had a terrible year by anybody’s standards, let alone his own. After ten straight seasons of above average offensive performance and a total of 149 runs above average in that timeframe, Lee has collapsed in 2010. His slash line has dropped to .246/.289/.415 this season. Much of that is part of a BABIP collapse to .238, but his power numbers have continued to decline after his ISO dropped below .200 for the first time since 2001. Overall, Lee has a .306 wOBA and a 91 wRC+ – numbers that aren’t terrible overall, but a player needs to provide some defensive value to back up those kind of hitting numbers.

If it weren’t for defensive issues, a move to first base wouldn’t even be in the discussion. However, Lee is utterly Dunnian (or maybe Hawpesque?) when it comes to the outfield. He was serviceable earlier in his career, but his age has caught up to him, and an utter lack of quickness or speed makes Lee a liability in left field. DRS and UZR both have Lee between -15 and -17 runs this season in left field, and Tom Tango’s Fans Scouting Report ranks Lee as one of the bottom 10 left fielders in the majors. That kind of performance puts Lee’s defensive contributions below the value of a designated hitter.

In that sense, a move to first probably makes sense – not only is first base the easiest position, but it also sees the fewest chances of any position as well. Due to this lack of chances, it’s hard to imagine Lee as much worse than -10 – although it’s certainly possible – which is the level that would be equal to -15 in LF. If he can play at even a -5 level, that would make him about half a win better, and if Lee is an average first baseman, then his defensive value is probably increased by about one full win.

Of course, that won’t matter if his hitting doesn’t rebound – nobody’s going to give up prospects or take on salary to add a first baseman with a sub-.300 on-base percentage. There is a chance that he could improve, though. Lee’s contact skills are excellent, as he has only struck out 109 times in nearly 1300 plate appearances over the last two seasons. The problem is being able to produce with that contact, something that’s nearly impossible with a .238 BABIP, and the decline in power production hasn’t helped either.

As a plodding 34 year old with a drastically falling line drive rate, it’s not surprising that Lee’s BABIP has plummeted, and given that profile, there’s no guarantee that it rebounds. Even if it does, it probably won’t get above .300 – the last time Lee posted a .300+ BABIP was 2004. However, CHONE’s projection of .282/.328/.478 would at least make him an above average hitter. With a conservative estimate of -3 runs at first base, that would make Lee a 1.0 WAR player.

That looks like it would certainly increase Lee’s value, although not enough to get anything of value in return, particularly if the Lance Berkman trade or the Roy Oswalt trade are indicators at all. However, this analysis so far has overlooked the presence of Brett Wallace at first base. Wallace has looked awful in the majors to date, but he is rated highly by some talent evaluators. Starting Lee at first base would mean that Wallace is either relegated to AAA or the bench. The latter could be a disastrous decision for Wallace’s development. The former would mean a third tour through AAA, a league in which he has already posted .800+ OPSs twice. Perhaps Wallace, who turned 24 last month, could learn more with another stint in the minors, but it’s also possible that he needs to develop at the MLB level.

When it comes to trade value, the book on Carlos Lee is simple: he has none, and barring an unlikely offensive explosion at the age of 35, he won’t have any next year either. In any case, the position that he plays is probably inconsequential. The real issue for the Astros here isn’t Carlos Lee, but instead the developmental track for Brett Wallace. This decision says to me that the player development sector of the Astros front office thinks Wallace needs time in AAA. If Carlos Lee can bring in any sort of value back in a trade – sometimes, the trade market is quite unpredictable – then that’s just gravy for Houston.


Taking a Swing at a Mark Reynolds Trade

Mark Reynolds’ skill set is one of the most combustible in the majors and this season he busted more than he boomed. That Kevin Towers is supposedly looking to shear some strikeouts from his new roster means Reynolds is almost certainly on the market. Those familiar with Towers’ dealings, like Padres fan Marc Normandin, suggested as much moments after Towers took over. If such presage comes to fruition, then we should witness one of the most interesting trades in recent memory.

The 26-year-old third baseman is due $5 million next season and is under team control through the 2013 season at a cost of roughly $23.5 million. Towers’ trade partner may only be concerned with the next season or two if acquiring Reynolds to push his team over the top, but assume that Reynolds’ performance over the duration of the deal is under the microscope. What are we to make of his prospects?

Reynolds fans a lot. In 2007, he broke onto the scene striking out 35.2% of the time. That number has increased in each subsequent season (now up to 41.9%) and even those who refuse to trust trends over weighted averages have to admit the roof on Reynolds’ strikeouts sits uncomfortably high, even in an era where high-power, strikeout-heavy hitters are romanticized more than ever before.

Finding a comparable is difficult. Dave Kingman struck out a lot, but as much as Reynolds has over such an established length of time. Adam Dunn strikes out a lot and yet his career average (32%) would represent a career-low for Reynolds. Rob Deer might be the truest comparison and his career took the form of a downward spiral after turning 27.

How do other teams evaluate Reynolds? Do any teams view Reynolds as Dunn with fewer walkways and more holes in the wall? Does any team hold a belief that their hitting coaches and instructors could work tirelessly with him and curb his hackitude? Do they view him as a two-win player with four-win potential, or as something more with league-average downside?

There is a lot of risk involved in each aspect of a Reynolds’ deal. The acquiring team risks Reynolds flaming out while on their payroll. Without knowing the suitors or the asking price, the opportunity cost does not lend itself easily to speculation.

The aforementioned Normandin – who knows Towers’ tendencies about as well as anyone in the analytical community – suggests that Towers would probably take a stack of arms the other organization considers disposable. Think the Jake Peavy deal, which lifted a burdensome contract from San Diego’s books while allotting four usable arms into the system.

Towers runs the risk of angering the portion of his new fan base with their minds on home runs and runs batted in, while also placating those with phobia of strikeouts. To complicate manners, Towers has no obvious heirs in his cabinet and a parched free agent class presents few temptations. There’s a chance the D-Backs could run with filler at third base next year which means they would probably want at least one player near the majors in order to avoid a total public relations meltdown if/when the new third baseman failed to lace up Reynolds’ offensive boots.

Occasionally a trade becomes a microcosm for the player involved. This is one of those cases, as a Reynolds’ deal stands a good chance of becoming a homer or a strikeout.


The Sabermetric Project and the “Science of Words”

Before I hit the record button on our recent conversation together, Geoff Young and I meditated briefly on the relationship between words and numbers — and the respective contributions of each to the sabermetric project. Young said something to the effect that he’d always regarded Bill James (i.e. father of us all) as a writer and thinker first, a statistician second. If I’m remembering correctly, James has said something very similar to this on more than one occasion.

Around this time last year, in these electronic pages, I addressed James’ opinion on the narrative quality of numbers. It could certainly be treated at greater length, but, to paraphrase, his most basic thoughts on the matter are summarized in this statement:

When the numbers melt into the language, they acquire the power to do all of the things which language can do, to become fiction and drama and poetry.

Another voice — and another perspective — in this conversation belongs to an unlikely source: Romantic Poet and Manly Christian Samuel Taylor Coleridge. I’ve recently acquired from the University of Wisconsin Library a copy of Coleridge’s Aids to Reflection. The first thing to say about the text — not entirely related, but relevant insofar as it’s awesome — is that the specific copy I’ve checked out was published in 1863 (and is, in fact, inscribed by one John L. Ladds, dated 1865). There’s a pleasure to this: to read the exact words that someone 150 years ago also saw fit to read.

More relevant to the present discussion, however, is the following sentiment. Attempting to summarize the purpose of his book, Coleridge states in the preface that his intent is to

direct the reader’s attention to the value of the science of words, their use and abuse, and the incalcuable advantages attached to the habit of using them appropriately, and with a distinct knowledge of their primary, derivative, and metaphorical senses. [Emphasis mine.]

Here we have an idea both opposite, and intimately related, to James’s. Coleridge is concerned not with the capacity for cold data to become warm and rich when organized meaningfully, but rather with properties of words and their particular effects on readers. Of course, there actually is a science more or less dedicated to this: linguistics (and rhetoric, too). That’s not news. But for a community that recognizes implicitly the importance of numbers to our enjoyment and understanding of baseball, it makes sense also to understand the role of words in the same.

Josh Levin considered something like this back in 2003, in a piece he wrote for Slate. In his article, he asks a simple question: Why doesn’t football have a Bill James?

Aaron Schatz of Football Outsiders answered the question ably, stating that “baseball analysis exists as it does today because Bill James is one of the people who, in American intellectual history, is a force of nature.”

Levin is smart enough to recognize some other obvious reasons as to why baseball analysis has proliferated. Like, for example, that baseball is older, and also that, being a turn-based game, it lends itself more to quantitative analysis.

Still, it’s a fact: especially in the early years of the Abstract, when he was writing and publishing his annual almost entirely by himself, James’ output was incredible. For not only was he doing all that junk on his own, but he was, more or less, inventing a genre of literature.

What sort of person is capable of such singular focus and ubermenschiness? The same sort who’d write the following words, also in Slate, earlier this month:

I myself am a stubborn, sometimes arrogant person who refuses to obey some of the rules that everybody else follows. I pay no attention to the rules of grammar. I write fragments if I goddamned well feel like it. I refuse to follow many of the principles of proper research that are agreed upon by the rest of the academic world. An editor said to me last year, “Well, you’ve earned the right to do things your own way.” Bullshit; I was that way when I was 25. It has to do with following the rules that make sense to me and ignoring the ones that don’t. It doesn’t make me a bad person; it makes me who I am. I started the Baseball Abstract, self-publishing it when self-publishing was cumbersome and impractical, because it was my book and nobody was going to tell me how to write it or tell me what people were interested in.

Words, numbers, and baseball — and the overlapping relationships between the three — were recently addressed by Will Carroll and (by way of response to Carroll) Tom Tango.

Read the rest of this entry »


Matt Cain’s Pitch Selection by Count

Matt Cain effectively eliminated the Rockies from playoff contention yesterday afternon, pitching a no-hitter into the 8th inning and finishing all nine innings allowing two earned runs with eight strikeouts and one walk. Cain has been able to keep the HR/FB ratio down from 8.4% last season to 6.4% this season, reducing his HR/9 from 0.91 to 0.77. Dropping to 7.06 K/9 from 8.45 K/9 in his first full season (back in 2006) may be a concern, but overall, Matt Cain is enjoying the best season of his career in terms of FIP, with a career low mark of 3.54. Yesterday, Cain was able to induce 13 swinging strikes using all four of his pitches: four-seam fastball, slider, curveball, and changeup.

A pitcher with a variety of pitch types like Matt Cain will mix them based on the count and the batter’s handedness. What would be interesting to investigate is how Cain uses his fastball, silder, curveball, and changeup based on the count. First, let’s look at how many pitches Cain has thrown for each count this season:

All effective pitchers will avoid the three ball count as much as possible, and Cain has thrown 38 3-0 pitches all season in 210.1 IP. Next, let’s look at Cain’s pitch selection by count by first looking at how often he throws the four-seam fastball by count, while referring to the sample size from the above table to keep ourselves honest:

Obviously, Cain uses his fastball most frequently, but notice how he uses the fastball more when there are more balls in the count. In these situations, Cain would want to throw a strike, so using a pitch that he has more control over makes sense. On two strikes against both hitters, Cain throws the fastball about or over 50% of the time. Let’s look at Cain’s slider use by count:

Cain’s slider moves away from RHH and in on LHH. As a result, he rarely uses his slider against LHH in all counts, occasionally using it on two strikes. But against RHH, Cain utilizes the slider up to 20.5% of the time depending on the count. Let’s take a look at Cain’s curveball use:

Cain uses the curveball more often on the first pitch against LHH than against RHH, but uses the curveball as much as the slider on two strikes against RHH. It seems that, in addition to the fastball, Cain likes to use both the slider and curveball as his punch-out pitch against RHH. Finally, let’s look at Cain’s changeup use by count:

Whereas Matt Cain uses his slider against RHH often, he utilizes his changeup against LHH. This is because Cain’s changeup has different horizontal movement than his slider, moving toward RHH and away from LHH instead. Pitches that move away from the batter are harder to hit, so it makes sense that Cain distributes his slider and changeup in this way based on the batter’s handedness. It’s interesting to note that Cain rarely uses his changeup against LHH on the first pitch (12.5%), but uses it more frequently in every other count (up to 33.7% with a 1-1 count) except when there are three balls.

Cain is scheduled for one more start this season — this weekend against the San Diego Padres. The Padres and Giants are locked in a battle for first in the NL West, with the Braves battling for the NL Wild Card spot, as well. For the Padres’ lineup to be successful against Cain, the right-handed hitters could either sit on the fastball or anticipate the breaking ball with two strikes, while the left-handed hitters can expect a timely changeup deep in the at-bat.


2010 AL Playoff Rotations: Texas Rangers

This past weekend the Rangers clinched the AL West, their first division championship since 1999. Many things have gone well for the Rangers this season, and while a full look back will be worth doing after the playoffs, this post, like Friday’s on the Minnesota Twins, is a forward-looking post about their starting rotation going into the American League playoffs.

The simplistic take on past Rangers teams has been “good hitting, bad pitching.” This has always been at least a bit problematic in the past because the Rangers’ home park has tended to exaggerate both their hitters’ prowess and their pitchers’ futility, at least when looking at raw stats. This season, they’ve hit well, but their pitching has taken a step up. One season’s stats don’t tell the whole story, so while I’ll list each player’s 2010 statistics, I’ll also include numbers from the most recent update of CHONE’s pitcher projections (using CHONE’s context-neutral component nERA and also a FIP I derived from the stat line) to give a sense of each pitcher’s current “true talent.”

1) Cliff Lee, CHONE: 3.29 nERA , 3.16 FIP
2010: 6.6 WAR, 2.66 FIP, 3.28 xFIP, 2.75 tERA, 3.29 ERA

I’d call Lee the other forgotten AL Cy Young candidate, except I just remembered that what a player does in May and June doesn’t count for awards voting. But hasn’t Lee been a lot worse in Texas, anyway? Let’s see, his K/9 rate is slightly higher. His walk rate has doubled all the way up to over one per nine innings, and his HR/FB rate skyrocketed to almost league average. His xFIP in Seattle was 3.21; in Texas, it is 3.35. Whatever might be going on with Lee’s back, it looks to me like he’s basically the same pitcher as he was in Seattle, except he forgot not to let his HR/FB ratio regress to the mean when moving from one of the best pitcher’s parks in the league to one of the most hitter-friendly parks. Since 2008, Cliff Lee been one of the best pitchers in baseball. Of the likely AL playoff starters, only Francisco Liriano and CC Sabathia really match up with Lee.

2) C.J. Wilson, CHONE: 3.13 nERA,* 3.53 FIP*
2010: 4.2 WAR, 3.58 FIP, 4.23 xFIP, 3.78 tERA, 3.15 ERA

I include the asterisks because it looks like CHONE is still projecting him as a reliever. I’m not sure how CHONE or other projection systems handle reliever-starter switches, and obviously it needs to be accounted for. The (very) general rule is to add one to a reliever’s FIP/ERA to see what he would produce as a starter. That is a only a general guideline, though, and Wilson has outperformed all but the loftiest expectations of his transition into a starting role. Wilson walks a lot of batters, and his 4.23 xFIP reflects some good fortune on fly balls (5.1% HR/FB ratio, the league average this season is about twice that). However, Wilson strikes out a lot of hitters and keeps the ball on the ground enough to make it work.

3) Colby Lewis, CHONE: 3.47 nERA , 3.48 FIP
2010: 4.4 WAR, 3.52 FIP, 3.94 xFIP, 3.51 tERA, 3.72 ERA

Lewis has probably been better than Wilson; he has a better FIP, xFIP and tERA. Lewis hasn’t quite had Wilson’s good fortune on fly balls (although Lewis certainly hasn’t been unlucky) , and that’s a bit more of a problem because he’s a flyball pitcher. However, he has a very good walk rate and a higher 2010 K/9 rate than any of the other starters on Texas’ staff.

4) Tommy Hunter, CHONE: 4.83 nERA , 5.07 FIP
2010: 0.7 WAR, 5.02 FIP, 4.75 xFIP, 5.20 tERA, 3.83 ERA

…and then there’s Tommy Hunter. Yes, his ERA is good this season, and yes, xFIP indicates he’s has some bad luck. But he’s basically the Rangers’ version of Nick Blackburn. I guess Hunter strikes out a few more hitters than Blackburn, but he also walks more and gives up more fly balls. Basically, he’s an acceptable back-of-the-rotation starter during the regular season who a team really shouldn’t want to count on during the postseason.

The good news for Rangers fans is that Texas may not have to start Hunter in the Divisional Series, as the team is considering pitching Lee on short rest. As far as I can tell, the Rangers are the only team in the American League with three starters each over 4.0 WAR so far this season. Assuming Lee is healthy (and I doubt the Rangers would consider pitching him on short rest if they didn’t think so), the combination of Lee, Lewis and Wilson may be the best “top three” in the AL playoffs.


Shutdowns, Meltdowns and Making the Playoffs

Earlier this season, I brought up my dislike for the Saves statistic. Then, Tom Tango got the ball rolling (here and here) on creating a better way of measuring relief appearance success and, within a couple of days, the statistics Meltdowns and Shutdowns were available here at Fangraphs.

Shutdowns were supposed to mirror the total number of holds and saves in a season. As of yesterday, a total of 3403 number of shutdowns have occurred so far this season compared to a total of 3142 saves and holds. With only about 8% more shutdowns being recorded compared to saves and holds, the logic behind the values seem to be holding up fairly decent.

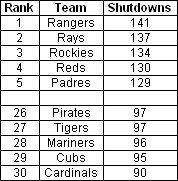
To see how teams stack up comparably, here is a look at the leaders and laggards in shutdowns across the league:

shutdowns

It seems the cream rises to the top as the top five teams have made the playoffs or are still in contention, while the bottom five teams are not going to make the postseason.

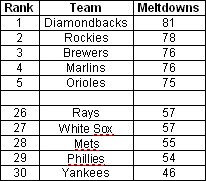
Along with shutdowns, meltdowns were created to measure the relief appearances that significantly hurt a team’s chances of winning. In comparision, here are leaders and laggards in the number of meltdowns:

meltdown

All the teams with the most meltdowns won’t make the playoffs, except maybe Colorado. Three of the five teams with the least number of meltdowns will make the playoffs with the Mets and While Sox being the exceptions.

Finally, the best way to see how the pen has done as a whole is to get the ratio of the number of shutdowns compared to the number of meltdowns. So far this season the league average is 1.73 shutdowns for every meltdown. Again here is a list of the top and bottom teams in the league:

ratio_leaders

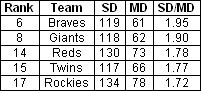
No real surprise here with five playoff or likely playoff teams making the top list and five non-playoff teams at the bottom. Besides the top-five teams, here are how the rest of the possible playoff teams rank:

ratio_rest

Having a capable bullpen that keeps its team in games (compiling shutdowns) and doesn’t blowup (meltdowns) isn’t all that a team needs in order to make the playoffs, but all the teams making the playoffs have addressed it nicely during this season.


2010 NL Playoff Rotations: Philadelphia Phillies

Matt has already started looking at AL playoff rotations. Since the NL demands equal treatment, we’ll also look at the rotations for those six teams. The only sensible starting point is the team that has already clinched. As with Matt’s, we’ll go with each pitcher’s basic season numbers, plus the park- and defense-neutralized ERA (nERA) from the CHONE August projections and the FIP derived from that.

1) Roy Halladay CHONE: nERA 3.15, FIP 2.84
2010: 6.5 WAR, 3.07 FIP, 2.95 xFIP, 3.44 tERA, 2.53 ERA

Halladay has done exactly what everyone expected following his move to the National League. His ERA, 2.53, is his lowest since 2005, which is in some part due to his high strand rate, 82.5 percent. On one hand, that could change in the playoffs when he’s facing the better lineups in the league. On the other hand, the Phillies could face the Giants in the first round.

Even still, there’s little reason to doubt Halladay. He’ll be pitching more innings than in years past, but that doesn’t seem like much of a concern. The way Halladay has thrown the ball in the past five years it looks like he could keep going forever.

2) Cole Hamels CHONE: nERA 3.88, FIP 3.66
2010: 3.9 WAR, 3.09 FIP, 3.44 xFIP, 3.74 tERA, 3.70 ERA

In 2010, Hamels has established himself as a model DIPS pitcher. For the past three seasons now he has sported nearly identical FIP numbers while seeing fluctuating ERAs. Last year was a down year, a 4.32 ERA, but this year he’s back to the 3.09 mark he had in 2008. Chances are Charlie Manuel will name him the Game 2 starter, if for no reason other than his handedness. But that doesn’t take away from Hamels’ excellent season.

Like Halladay, Hamels has a higher strand rate than normal. That’s about the only bad thing about him. His groundball rate is higher than ever and he’s striking out a batter more per inning than he did in 2008 and 09. While the Phillies had questions about Hamels heading into the 2009 playoffs, there are none this year. It’s like 2008 all over again, only this time the Phils have a pitcher even better to take the ball in Game 1.

3) Roy Oswalt CHONE: nERA 3.86, FIP 3.58
2010: 4.7 WAR, 3.29 FIP, 3.44 xFIP, 3.42 tERA, 2.80 ERA

While the CHONE formula projects Oswalt to perform a bit worse than he has, it’s tough to watch his starts and come to a similar conclusion. Even with his rough first start for the Phillies, he has a 1.76 ERA and 3.07 FIP with his new, contending team. Even though he’s 32 he’s proven that he’s durable. He’s also worked through a long playoff run, pitching almost 270 innings in 2005.

In 2009, the Phillies acquired Cliff Lee at the trade deadline, and he led them through the regular season, into the playoffs, and eventually to the World Series. In 2010, Roy Oswalt doesn’t have to do that. Just as the Phillies have 2008 all over again with Hamels, they have 2009 all over again with Oswalt replacing Lee. Only, again, they have the best pitcher in the league taking the ball in Game 1, and another top of the rotation starter in Game 2.

4) Joe Blanton CHONE nERA 4.52, 4.26 FIP
2010: 1.9 WAR, 4.34 FIP, 4.04 xFIP, 4.58 tERA 4.94 ERA

As long as the Phillies hang onto the NL’s best record, they won’t even need Joe Blanton in the first round. They can simply skip him over and start Halladay, Hamels, and Oswalt on normal rest in all five games. He only becomes a factor in the ALCS and World Series, and even then it’s just one game. Even then it’s not all downside. His 4.94 ERA might look ugly, but as you can see nearly every component ERA rates him a bit better. This doesn’t make him a good pitcher; it simply means that having him start once a series shouldn’t kill the team. There’s a chance, too, that Blanton makes zero postseason starts.

Update: On the advice of commenter NEPP I checked the splits, and Blanton has seemingly gotten better every month this season. His overall numbers are certainly hurt by his first two months, which came after he missed April with an injury. He has also struck out 30 in 29 innings this month, which boggles the mind. I’d still advocate a three-man rotation, but with the way Blanton has been pitching and with the decisions Manuel made last year I’m fairly certain he’ll stick with having his guys on normal rest.

Question marks

The only question mark facing the Phillies rotation is of whether they’ll take the 2009 Yankees’ route and use only three starters. As David Murphy explained last week, Oswalt, Hamels, and Halladay can start 17 of 19 postseason games. But perhaps Charlie Manuel learned last year that going all-in is the right tactic.

Because the only off-days in the LCS occur between Games 2 and 3, and Games 5 and 6, the Phillies would have to throw each of their starters on short rest in order to avoid Blanton. That changes the situation somewhat; the Yankees were able to get through the 2009 playoffs with three pitchers largely because they got an extra day off in the LCS and had to throw only CC Sabathia on short rest in that round. But unless the Phillies find themselves up 3-0 heading into Game 4, it sounds like a good move for Manuel to go with Halladay.

It’s tough to pick against the Phillies in the NL as it is right now. Imagine if they throw out the inferior fourth starter and just go with their top three throughout the playoffs. They already have three of the top five or six playoff starters. If they throw only those three I don’t see how any other team stacks up.


Saying Goodbye To A Prince

In the eighth inning of yesterday’s otherwise meaningless game between the Milwaukee Brewers and the Florida Marlins, Prince Fielder received a standing ovation after being removed for a pinch-runner. It very well could have been the last thing he ever did at home as a member of the Brewers, and everyone in attendance knew it.

Fielder is probably the most likely big name player to be traded this winter, as the Brewers have come to the conclusion that they’re not going to be able to sign their first baseman to a long term extension. Talks with Scott Boras earlier this spring apparently ended after the team’s offer – reportedly for 5 years and $100 million or so – was rebuffed, and it seems unlikely that either side will have a change of heart now. Fielder is looking for a market rate paycheck, while the Brewers are just not going to give him one.

So, the Brewers face a choice – they could keep their slugging first baseman, hope the 2011 team performs well in the first half of the season, and evaluate their potential playoff chances before deciding whether to move him at the deadline or collect two draft picks next winter, or they can trade him this winter and retool their roster. If they keep him, they run the risk of having to compete with San Diego next summer, who may be shopping Adrian Gonzalez if their season doesn’t work out so well. They also run the risk of Fielder getting hurt or having a down season, or potentially few contenders needing a 1B/DH type at the deadline, which would create diminished demand for his services.

The smart decision seems to be to move him. However, that might not be as easy as it sounds. Fielder is going to be a 5th year arbitration guy coming off a $10.5 million salary and with strong numbers in traditional categories, so he’s looking at a $15 million plus paycheck for 2011. And, while he’s a good player, that isn’t all that much of a bargain.

In five seasons as a big leaguer, Fielder has hit .281/.385/.538, good for a .389 wOBA. That’s very good, of course, but the only place he adds value is at the plate. UZR has consistently rated him as a below average defender, as he averages about -7 runs per season as a first baseman. While he moves pretty decently for a guy his size, he’s not any kind of asset on the bases. He’s a hitter, and a good one, but that’s all he is. And there are a lot of those available in free agency this winter.

For instance, most teams that would be interested in Fielder would probably also take a look at Adam Dunn, whose .251/.381/.522 career mark is very similar to Fielder’s. They have similar skillsets, and while Dunn is older, teams can sign him without surrendering prospects in their system or have to worry about the long term contract that Boras is seeking for his client. Even if you have to give up a draft pick to sign Dunn, he’ll look like a pretty attractive option at 4/40 compared to giving up premium talent to sign Fielder and then having Boras ask for six years and $150 million at the negotiating table.

While Fielder is a good player, he’s not a huge asset, because his annual salary is already pretty pricey and his lack of value beyond his bat is nonexistent. He’s a good player, but not a superstar, as his career +3.5 WAR per 600 PA shows. Even if we called him a +4 to +5 win player, he’s probably not worth $20 million per year, and Boras has already demonstrated that the expected price tag of keeping him is over that mark.

Realistically, the Brewers are probably better off finding a team who would see Fielder as a rental – a club that needs a big time slugger to put them over the top next year, and is willing to switch out prospects for present value and some long term draft picks. Rather than focusing on finding Fielder’s permanent home, it’s probably in everyone’s best interests if he’s a hired hand for one year, and then lets the market determine his landing place next winter.

How much is a one year rental 1B/DH with an expected salary of $15 million worth? Probably a lot less than Brewer fans are hoping for.