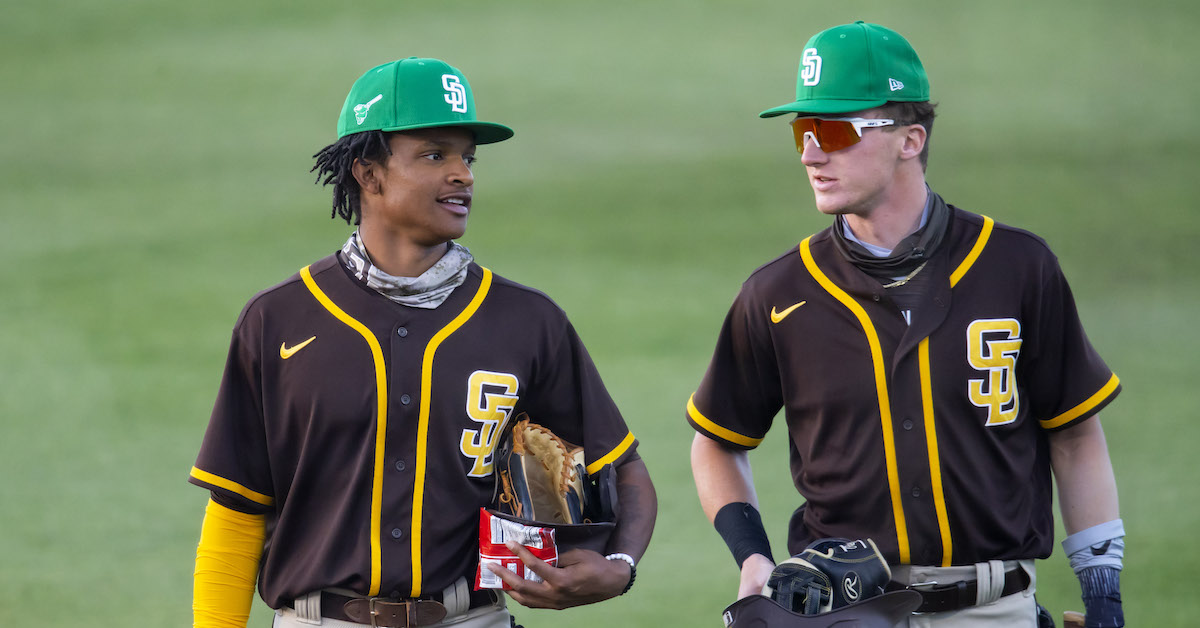
Below is our list of the top 100 prospects in baseball. The scouting summaries were compiled with information provided by available data and industry sources, as well as from our own observations. This is the second year we’re delineating between two anticipated relief roles, the abbreviations for which you’ll see in the “position” column below: MIRP for multi-inning relief pitchers, and SIRP for single-inning relief pitchers.
And now, a few important things to keep in mind as you’re perusing the Top 100. You’ll note that prospects are ranked by number but also lie within tiers demarcated by their Future Value grades. The FV grade is more important than the ordinal ranking. For example, the gap between Julio Rodríguez (No. 4) and Triston Casas (No. 16) is 12 spots, and there’s a substantial difference in talent between them. The gap between Mark Vientos (No. 64) and Patrick Bailey (No. 76), meanwhile, is also 12 numerical places, but the difference in talent is relatively small. You may have noticed that there are more than 100 prospects in the table below, and more than 100 scouting summaries. That’s because we have also included 50 FV prospects whose ranking fell outside the 100. Their reports appear below, under the “Other 50 FV Prospects” header. The same comparative principle applies to them.
You’ll also notice that there is a Future Value outcome distribution graph for each prospect on the list. This is an attempt to graphically represent how likely each FV outcome is for each prospect. Before his departure for ESPN, Kiley McDaniel used the great work of our former colleague Craig Edwards to find the base rates for each FV tier of prospect (separately for hitters and pitchers), and the likelihood of each FV outcome. For example, based on Craig’s research, the average 60 FV hitter on a list becomes a perennial 5-plus WAR player over his six controlled years 26% of the time, and has a 27% chance of accumulating, at most, a couple of WAR during his six controlled years. We started with those base rates for every player on this year’s list and then manually tweaked them depending on our more specific opinions about the player. For instance, Elly De La Cruz and Steven Kwan are both 50 FV prospects, but they are nothing alike. De La Cruz could be a switch-hitting shortstop with plus-plus power or he might turn into Seuly Matias. Meanwhile, Kwan has performed through the upper minors and is almost certain to contribute to a big league team, but doesn’t have nearly the same power potential or high-end ceiling De La Cruz does. Our hope is that the distribution graphs reflect these kinds of differences.
This year’s crop of prospects is a little bit down in the 60 and 55 FV tiers. Typically, the 55 FV tier runs to about the 50th overall prospect on the Top 100 (which again isn’t really a Top 100, so much as a ranking of all the 50 FV and above prospects, but that title is an SEO nightmare), but this year’s group only extends through No. 32. This might be due to random variation in the prospect population, or have to do with the lost year of development in 2020 or the new rules surrounding rookie eligibility, which caused several players to graduate off our lists more quickly than in the past. Jose Barrero and Keibert Ruiz, for example, would have been eligible under the older roster rules. Those guys can be found on The Board’s Graduates section. Or perhaps our evaluations are just wrong.
For a further explanation of the merits and drawbacks of Future Value, please read this and this. If you would like to read a book-length treatment on the subject, one is available here. Read the rest of this entry »