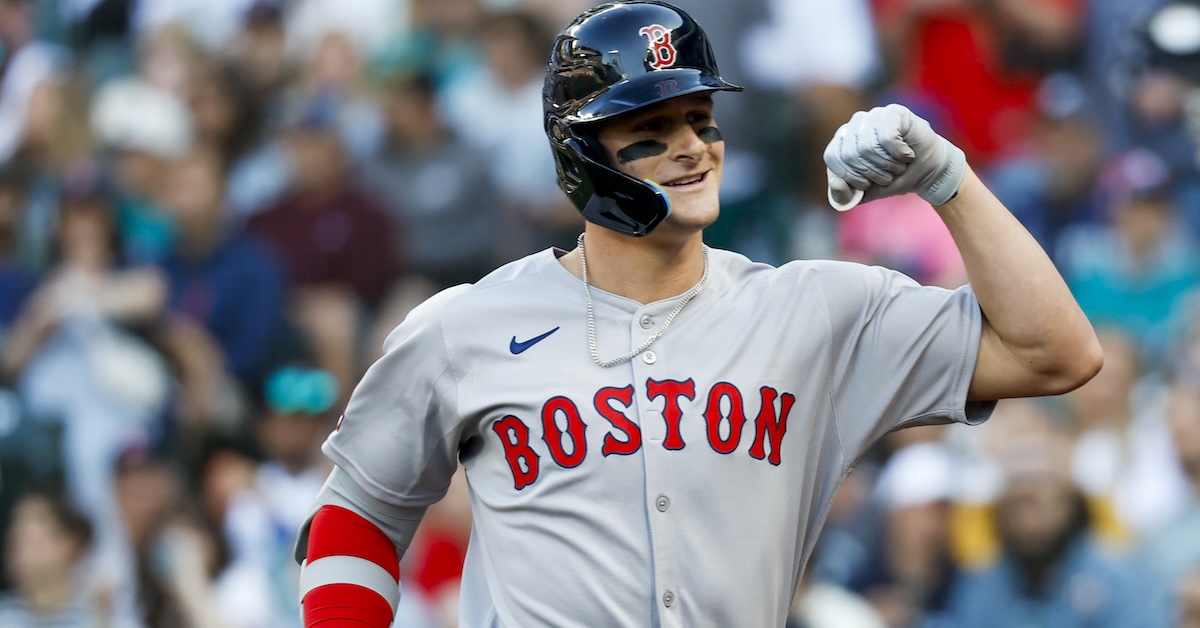
Archive for Featured

2024 Trade Value: Nos. 1-10

Daniel Kucin Jr.-USA TODAY Sports

As is tradition at FanGraphs, we’re using the lead-up to the trade deadline to take stock of the top 50 players in baseball by trade value. For a more detailed introduction to this year’s exercise, as well as a look at the players who fell just short of the top 50, be sure to read the Introduction and Honorable Mentions piece, which can be found in the widget above.

For those of you who have been reading the Trade Value Series the last few seasons, the format should look familiar. For every player, you’ll see a table with the player’s projected five-year WAR from 2025-2029, courtesy of Dan Szymborski’s ZiPS projections. The table will also include the player’s guaranteed money, if any, the year through which their team has contractual control of them, last year’s rank (if applicable), and then projections, contract status, and age for each individual season through 2029 (assuming the player is under contract or team control for those seasons). Last year’s rank includes a link to the relevant 2023 post. Thanks are due to Sean Dolinar for his technical wizardry. At the bottom of the page, there is a grid showing all of the players who have been ranked up to this point.

A note on the rankings: As we ascend towards the top of the list, the tiers matter more and more. There are clear gaps in value. Don’t get too hung up on what number a player is, because who they’re grouped with is a more important indicator. There are three distinct tiers in today’s group of 10 players, and I think they have clearly different valuations; I’d prefer everyone in a given tier over everyone below it, but I’m far less certain within each group. I’ll note places where I disagreed meaningfully with people I spoke with in calibrating this list, and I’ll also note players whose value was the subject of disagreement among my contacts. As I mentioned in the Introduction and Honorable Mentions piece, I’ll indicate tier breaks between players where appropriate, both in their capsules and bolded in the table at the end of the piece.

With that out of the way, let’s get to the final batch of players. Read the rest of this entry »


2024 Trade Value: Nos. 11-20

Robert Edwards-USA TODAY Sports

As is tradition at FanGraphs, we’re using the lead-up to the trade deadline to take stock of the top 50 players in baseball by trade value. For a more detailed introduction to this year’s exercise, as well as a look at the players who fell just short of the top 50, be sure to read the Introduction and Honorable Mentions piece, which can be found in the widget above.

For those of you who have been reading the Trade Value Series the last few seasons, the format should look familiar. For every player, you’ll see a table with the player’s projected five-year WAR from 2025-2029, courtesy of Dan Szymborski’s ZiPS projections. The table will also include the player’s guaranteed money, if any, the year through which their team has contractual control of them, last year’s rank (if applicable), and then projections, contract status, and age for each individual season through 2029 (assuming the player is under contract or team control for those seasons). Last year’s rank includes a link to the relevant 2023 post. Thanks are due to Sean Dolinar for his technical wizardry. At the bottom of the page, there is a grid showing all of the players who have been ranked up to this point.

A note on the rankings: As we ascend towards the top of the list, the tiers matter more and more. There are clear gaps in value. Don’t get too caught up on what number a player is, because who they’re grouped with is a more important indicator. The gap between no. 20 and 19 is next to nothing; between 11 and 10, it’s much steeper. I’ll note places where I disagreed meaningfully with people I spoke with in calibrating this list, and I’ll also note players whose value was the subject of disagreement among my contacts. As I mentioned in the Introduction and Honorable Mentions piece, I’ll indicate tier breaks between players where appropriate, both in their capsules and bolded in the table at the end of the piece.

With that out of the way, let’s get to the next batch of players. Read the rest of this entry »


2024 Trade Value: Nos. 21-30

Jeff Lange/USA TODAY NETWORK

As is tradition at FanGraphs, we’re using the lead-up to the trade deadline to take stock of the top 50 players in baseball by trade value. For a more detailed introduction to this year’s exercise, as well as a look at the players who fell just short of the top 50, be sure to read the Introduction and Honorable Mentions piece, which can be found in the widget above.

For those of you who have been reading the Trade Value Series the last few seasons, the format should look familiar. For every player, you’ll see a table with the player’s projected five-year WAR from 2025-2029, courtesy of Dan Szymborski’s ZiPS projections. The table will also include the player’s guaranteed money, if any, the year through which their team has contractual control of them, last year’s rank (if applicable), and then projections, contract status, and age for each individual season through 2029 (assuming the player is under contract or team control for those seasons). Last year’s rank includes a link to the relevant 2023 post. Thanks are due to Sean Dolinar for his technical wizardry. At the bottom of the page, there is a grid showing all of the players who have been ranked up to this point.

A note on the rankings: As we ascend towards the top of the list, the tiers matter more and more. There are clear gaps in value. Don’t get too caught up on what number a player is, because who they’re grouped with is a more important indicator. The gap between no. 20 and 19 is next to nothing; between 12 and 11, it’s much steeper. I’ll note places where I disagreed meaningfully with people I spoke with in calibrating this list, and I’ll also note players whose value was the subject of disagreement among my contacts. As I mentioned in the Introduction and Honorable Mentions piece, I’ll indicate tier breaks between players where appropriate, both in their capsules and bolded in the table at the end of the piece.

With that out of the way, let’s get to the next batch of players. Read the rest of this entry »


2024 Trade Value: Nos. 31-40

Tim Vizer-USA TODAY Sports

As is tradition at FanGraphs, we’re using the lead-up to the trade deadline to take stock of the top 50 players in baseball by trade value. For a more detailed introduction to this year’s exercise, as well as a look at the players who fell just short of the top 50, be sure to read the Introduction and Honorable Mentions piece, which can be found in the widget above.

For those of you who have been reading the Trade Value Series the last few seasons, the format should look familiar. For every player, you’ll see a table with the player’s projected five-year WAR from 2025-2029, courtesy of Dan Szymborski’s ZiPS projections. The table will also include the player’s guaranteed money, if any, the year through which their team has contractual control of them, last year’s rank (if applicable), and then projections, contract status, and age for each individual season through 2029 (assuming the player is under contract or team control for those seasons). Last year’s rank includes a link to the relevant 2023 post. Thanks are due to Sean Dolinar for his technical wizardry. At the bottom of the page, there is a grid showing all of the players who have been ranked up to this point.

One note on the rankings: Particularly at the bottom of the list, there isn’t a lot of room between the players. The ordinal rankings clearly matter, and we put them there for a reason, but there isn’t much of a gap between, say, the 38th-ranked player and the 60th. The magnitude of the differences in this part of the list is quite small. Several of the folks I talked to might prefer a player in the honorable mentions section to one on the back end of the list, or vice versa. I think the broad strokes are correct, and this is my opinion of the best order, but with so many players carrying roughly equivalent value, disagreements abounded. I’ll note places where I disagreed meaningfully with people I spoke with in calibrating this list, and I’ll also note players whose value was the subject of disagreement among my contacts. As I mentioned in the Introduction and Honorable Mentions piece, I’ll also indicate tier breaks between players where appropriate, both in their capsules and bolded in the table at the end of the piece.

With that out of the way, let’s get to the next batch of players. Read the rest of this entry »


2024 Trade Value: Nos. 41-50

John Geliebter-USA TODAY Sports

As is tradition at FanGraphs, we’re using the lead-up to the trade deadline to take stock of the top 50 players in baseball by trade value. For a more detailed introduction to this year’s exercise, as well as a look at the players who fell just short of the top 50, be sure to read the Introduction and Honorable Mentions piece, which can be found in the widget above.

For those of you who have been reading the Trade Value Series the last few seasons, the format should look familiar. For every player, you’ll see a table with the player’s projected five-year WAR from 2025-2029, courtesy of Dan Szymborski’s ZiPS projections. The table will also include the player’s guaranteed money, if any, the year through which their team has contractual control of them, last year’s rank (if applicable), and then projections, contract status, and age for each individual season through 2029 (assuming the player is under contract or team control for those seasons). Last year’s rank includes a link to the relevant 2023 post. Thanks are due to Sean Dolinar for his technical wizardry. At the bottom of the page, there is a grid showing all of the players who have been ranked up to this point.

One note on the rankings: Particularly at the bottom of the list, there isn’t a lot of room between the players. The ordinal rankings clearly matter, and we put them there for a reason, but there isn’t much of a gap between, say, the 38th-ranked player and the 60th. The magnitude of the differences in this part of the list is quite small. Several of the folks I talked to might prefer a player in the honorable mentions section to one on the back end of the list, or vice versa. I think the broad strokes are correct, and this is my opinion of the best order, but with so many players carrying roughly equivalent value, disagreements abounded. I’ll note places where I disagreed meaningfully with people I spoke with in calibrating this list, and I’ll also note players whose value was the subject of disagreement among my contacts. As I mentioned in the Introduction and Honorable Mentions piece, I’ll also indicate tier breaks between players where appropriate, both in their capsules and in the table at the end of the piece.

With that out of the way, let’s get to the first batch of players. Read the rest of this entry »


2024 Trade Value: Introduction and Honorable Mentions

David Butler II-USA TODAY Sports

Would you trade me your sandwich for my bag of chips? What if I threw in a pudding cup? Should we swap backpacks? Baseball cards? The desire to work out exchanges – and to do the comparative analysis necessary to decide whether you’d make a trade – is universal. It’s only natural that sports accentuate that feeling: At their core, sports are mostly about deciding which of two things is better.

Welcome to the 2024 edition of our annual Trade Value series. Starting today and continuing all week, we’re releasing our list of the 50 most valuable players in baseball, taking player performance, age, and contract into account. Dave Cameron, Kiley McDaniel, Craig Edwards, and Kevin Goldstein have all headlined this column before; this is my third year doing it on my own.

I say “on my own,” but that only describes the first half of the process. To start, I gathered every possible input I could think of: age, contract status, measures of current production, estimates of future production, Statcast data, pitch-level modeling — the list goes on. I used all of those inputs to come up with an initial quantitatively defined ranking, then honed that ranking by diving into individual player comparisons in greater detail. With that done, I got feedback from the FanGraphs staff (special thanks to Dan Szymborski for his ZiPS assistance and to Meg Rowley for being a frequent sounding board) to refine my thinking further. Read the rest of this entry »


Sunday Notes: Cole Ragans Got His Tight Cluster Back By Moving on the Rubber

A more-consistent arm slot related to a move back to the third base side of the rubber has contributed to Cole Ragans’s success this season. The raw stuff was obviously already there. As Ben Clemens wrote back in March, the Kansas City Royals left-hander “looks like an absolute terror on the mound.” My colleague went on to say that if he “were designing a pitcher in a laboratory, he’d look a lot like Ragans.”

When I talked to the 2024 American League All-Star on the eve of the break, he told me that going into full attack mode following last year’s oft-reported velocity jump played a huge role in his emergence as a front-line starter. As he put it, “I kind of had to teach myself that I could get away with a little more of a miss compared to when I was throwing 90-91 [mph]. I have a good arsenal in my opinion, so I can just go after hitters.”

And then there’s the work he does in the laboratory.

“I use TrackMan in my bullpens, especially with the slider and the cutter, to kind of see where I’m at,” said Ragans, whose heater is now mid-to-high 90s. “The biggest thing for me is my release points, making sure that my pitches are in a tight cluster. I want everything coming out of the same tunnel. I don’t want to be throwing a fastball from this release height, and my slider from a lower release height.” Read the rest of this entry »


Five Things I Liked (Or Didn’t Like) This Week, July 19

Kevin Jairaj-USA TODAY Sports

Welcome to another edition of Five Things I Liked (Or Didn’t Like) this week. This is a strange week for the column. The All-Star break cut into the number of games available to watch; mathematically speaking, fewer games means fewer chances for weird things to happen. I took a weekend trip and didn’t watch any MLB games on Friday or Saturday. I’m also hard at work on the upcoming trade value series, which comes out between the All-Star game and the deadline every year – check back Monday for that annual exercise’s kickoff. In any case, that means this is a hodgepodge list: some stuff from this week, sure, but also plays and series that got left out last week, and some low-level baseball to boot. Thanks, as always, to ESPN’s Zach Lowe for the format idea. And two quick programming notes: I won’t be doing my regular Monday chat or Five Things next week; instead, I’ll be doing a jumbo-sized chat Friday morning.

1. The New Derby Format
The modern swing-happy Home Run Derby has been a great success, at least as far as I’m concerned. It’s more fun to see sluggers launch as many home runs as they possibly can than it is to see them agonize over every single swing. The format wasn’t perfect, though. I’m not trying to be a grump about it – is it even possible to be a grump about the Home Run Derby? – but there was one downside to the timed-round format: not enough drama.
Read the rest of this entry »


2024 MLB Draft: Day Two and Three Roundup

Kevin Jairaj-USA TODAY Sports

The 2024 MLB Draft has concluded, and it’s time to make definitive judgments about which teams did the best and worst before many of the players have even signed their deals. Just kidding — while I do have a few team-specific thoughts below, this piece is more about what unfolded across the draft as a whole. I texted folks in the industry (scouts, executives, and agents) to see what they thought of the overall results, and if they noticed a continuation of broad industry trends or observed behavior specific to this year’s proceedings. I’ve incorporated some of their thoughts below. Read the rest of this entry »


The 2024 Replacement-Level Killers: Left Field & Right Field

Bill Streicher-USA TODAY Sports

Today the Killers list turns the corner — or rather turns to the teams receiving less-than-acceptable production in the outfield corners. While still focusing on teams that meet the loose definition of contenders (Playoff Odds of at least 9.5%), and that have gotten about 0.6 WAR or less out of a position thus far — which prorates to 1.0 WAR over a full season — I have also incorporated our Depth Charts’ rest-of-season WAR projections into the equation for an additional perspective. Sometimes that may suggest that the team will clear the bar by a significant margin, but even so, I’ve included them here because the team’s performance at that spot is worth a look.

As noted previously, some of these situations are more dire than others, particularly when taken in the context of the rest of their roster. I’ve batched the two corners together into one supersized roundup because three of the seven teams below the WAR cutoff for left field also make the list for right field, and because there’s plenty of crossover in play with regards to personnel. The capsules are listed in order of their left field rankings first, while noting those three crossover teams with an asterisk. As always, I don’t expect every team here to go out and track down upgrades before the July 30 deadline, but these are teams to keep an eye on. All statistics are through July 14.

2024 Replacement-Level Killers: Left Field
Team AVG OBP SLG wRC+ Bat BsR Fld WAR ROS WAR Tot WAR
Braves .218 .266 .332 67 -13.7 -0.6 1.1 -0.6 0.4 -0.2
Dodgers .216 .289 .354 84 -7.7 -0.4 -4.8 -0.4 1.0 0.6
Royals .205 .270 .353 72 -12.1 2.2 -0.9 -0.3 0.5 0.2
Pirates .232 .300 .422 99 -0.4 0.7 -10.8 -0.1 1.1 1.0
Rays .196 .302 .340 91 -4.6 -1.0 -2.5 0.1 1.1 1.2
Mariners .230 .278 .379 89 -4.5 2.2 -0.4 0.5 0.7 1.2
Twins .228 .310 .383 98 -0.7 1.3 -3.8 0.5 0.8 1.3
All statistics through July 14.

2024 Replacement-Level Killers: Right Field
Team AVG OBP SLG wRC+ Bat BsR Fld WAR ROS WAR Tot WAR
Royals .204 .268 .353 72 -12.0 -2.2 -0.7 -0.8 0.5 -0.3
Pirates .237 .327 .339 90 -4.9 -0.6 -10.1 -0.6 1.1 0.5
Mariners .206 .290 .345 86 -6.6 0.4 -5.9 -0.4 0.6 0.2
Phillies .235 .297 .393 93 -3.3 -2.4 -5.9 -0.3 0.3 0.0
Guardians .204 .288 .343 82 -7.6 0.0 0.5 0.1 0.7 0.8
Rangers .226 .291 .390 90 -4.6 0.9 -0.6 0.4 1.0 1.4
Mets .251 .303 .404 103 1.4 1.9 -7.4 0.5 0.8 1.3
All statistics through July 14.

Read the rest of this entry »