Archive for Research

Let’s Admire Some of the Strongest Arms in Baseball

© David Richard-USA TODAY Sports

I’m not sure about you, but I’ve been eagerly awaiting the release of Statcast arm strength data for a while now. At the end of September, the day finally came, inspiring me to dive into the metrics of some of my favorite throwers in the league. Fielding mechanics are an under-appreciated part of the game. So much goes into having the appropriate footwork to direct yourself towards a base in order to make an accurate, strong throw, and some do it better than others. With the help of the Statcast Arm Strength leaderboard, I’m going to show you exactly what sets those players apart from the rest of the pack.

There are a few different ways to sort through the leaderboard. You can change the minimum number of throws if you’re mainly interested in finding who has the highest peak arm strength, regardless of how many total throws they’ve made. I settled on 100 throws, the default on the leaderboard. From there, I set out to find concrete examples of players near the top of leaderboard making accurate throws to nail runners between second base and home. Why? Because throwing isn’t just about arm strength – accuracy also plays a big role when it comes to outfield throws. The time it takes for a fielder to step to a ball or move their glove across their body can be the difference between a runner being called safe or out, while a strong and accurate throw gives their teammates the best chance to make a play. At home plate, throws on a fly or one long hop are crucial for catchers. It’s extremely difficult to make a play on a short hop while trying to get a tag down. After my search, I settled on five players from a sample of 20 to 25 who showcased great footwork and instincts to pair with their strong, accurate throws. Below is a representative play for each. To MLB’s Film Room!

Nate Eaton, Kansas City Royals (no. 1 overall)

Nate Eaton has an absolute cannon for an arm. Of all the players in the league with at least 100 throws in 2022, he ranks first on the arm strength leaderboard with an average throw of 98.1 mph. Statcast calculates this number by averaging the top portion of a player’s throws. Eaton is the only player with a number above 98 mph; he also has the highest maximum throw at 103.3 mph. There are only a few players who make your jaw drop when they make throws and Eaton is one of them.

After Gary Sánchez lined this pitch down the left field line, Eaton had a beat on the ball and immediately knew how to attack it. Knowing Sánchez’s speed, he got to the ball and took a few extra steps to plant on his back foot and push a speeding mack truck’s amount of force into the ground. I sometimes get frustrated watching position players throw because they forget their glove side exists. That isn’t a problem for Eaton. After planting, he creates a perfect angle to use his left arm as a coil to throw off of, leading to a seed right over the bag and a nice outfield assist.

Aristides Aquino, Cincinnati Reds (no. 3 overall)

It isn’t hyperbole to say that this is one of the most impressive throws you’ll ever see. Some of the best opportunities for a guy to make a play with his arm come after a misread, when he has overestimated his chances of making a play with his glove. After Aristides Aquino jumped up on the wall to save a few runs, the ball ricocheted off and forced him to scurry after it. After gathering himself and seeing how far Rhys Hoskins was from home, he knew he had a shot.

The two most important parts of this throw are the lead leg block (foot plant) and the crazy sub-scapula adduction (pinching of both scapula). Foot planting like this after running is nothing to bat an eye at. That, on top of his hyper mobile scapula, equated to a beautiful throw. Aquino’s max throw this year was 101.6 mph. I imagine this was pretty close to that.

Michael Harris II, Atlanta Braves (no. 18 overall)

Michael Harris II isn’t quite as large as Eaton or Aquino, making this throw and his maximum throwing velocity of 100.0 mph incredibly impressive. And unlike Aquino and Eaton, this play came on a standard outfield groundball. Harris played the hop perfectly, used a pro step to direct himself, and threw a missile through the would-be cutoff man for a perfect one-hopper to nail Luis Guillorme at the plate.

The pro step is a simple fundamental move where you take your throwing-side leg and swing it right behind your plant foot to properly align yourself toward the ball’s destination. It’s a quick move and the perfect one for attacking a grounder you need to make a throw on. It’s not in this view, but Harris also finishes with a nice little spin after releasing, also known as a janitor throw. It’s a reciprocal movement for the quick rotation that a throw like this requires.

Aaron Judge, New York Yankees (no. 25 overall)

Aaron Judge ranks 25th (92.3 mph) on the arm strength leaderboard. You might expect to see him ranked higher given his size, but if you watch him regularly, you know that he tones it down to make accurate throws like this one. I’m not sure there is a better baiter in the league than Judge. His awareness and feel around the short porch in Yankee Stadium allows him to fool runners into thinking they have a shot at second base.

Tommy Pham is pretty fast! His 64th percentile sprint speed is decently above average, yet, Judge makes him look slow as molasses as he waltzed to this ball in the corner. The fundamentals here are all impeccable. Once Judge knows he can’t get it on the fly, he reorients himself and prepares his hands for a smooth transfer. That part reminded me of a catcher. As a backstop, you’re taught to transfer the ball as deep into your body and as close to your ear as possible when preparing to throw a runner out. It leaves little room for error. Judge did exactly that when reacting to this hop off the wall and made throwing out Pham look easy with a perfect no-hopper. If I had to guess what his hardest throw of the year was, it would be this one.

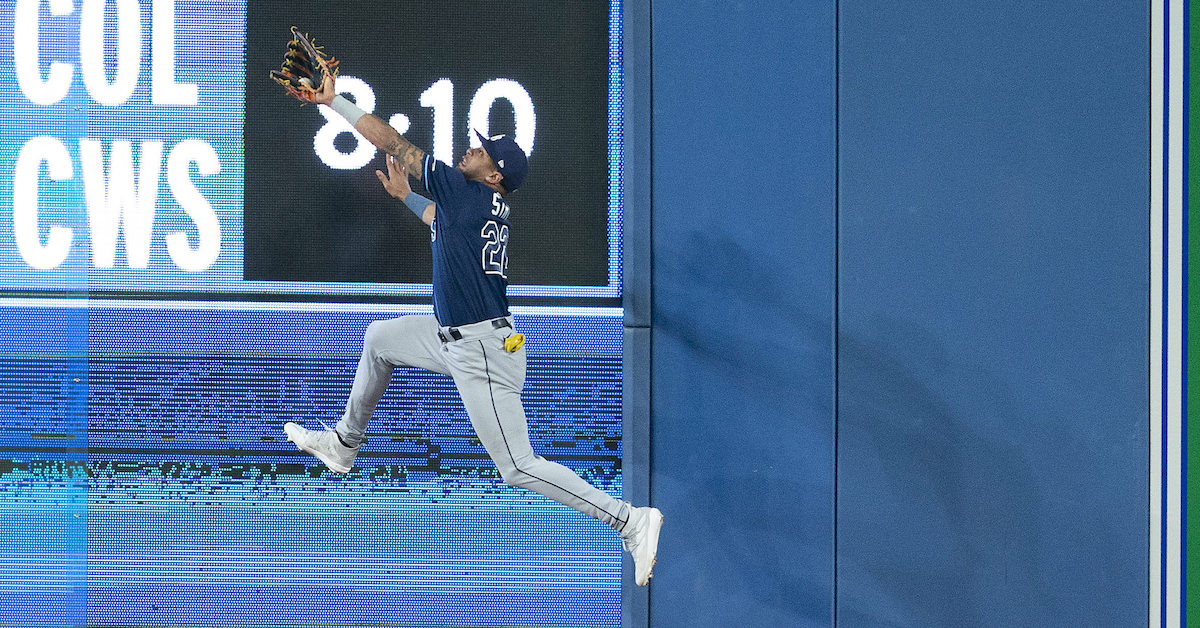
Julio Rodríguez, Seattle Mariners, (no. 14 overall)

Speaking of baiting, this play by Julio Rodríguez was prime example of the skill. As the ball was lined into center, Rodríguez remained calm and threw up his hands as if he was preparing to catch it on a line. Little did Lourdes Gurriel Jr. know, this ball wasn’t even close to being caught on a fly. This is a combination of lack of awareness and trickery leading to a perfect chance for Rodríguez to nab Gurriel on a force out.

He wouldn’t have been able to do this without his 96th percentile arm strength. Ranked 14th, Rodríguez is a threat to throw out any runner. Typically, a player should have no chance of getting a force out at third base from the outfield, but a slight hesitation due to the hand deke was enough for him to unload a pill. Unlike Harris, Rodríguez opted for a mini crow hop and not a pro step. It’s a slower movement, but my goodness, if you can throw a ball this hard off a crow hop, then I’d say you’ve made the right decision!

I’m going to have a ton of fun with this new leaderboard. To me, a high throwing velocity is just as impressive as a high exit velocity. Seeing arm strength numbers on broadcasts will add interesting insight and context to games. How fast does a throw need to be to turn a double play or nail a runner at home? These are great questions that I’d love to see answered. For now, I’ll leave you with this. Arm strength is the first step in being a great thrower from the outfield, but that doesn’t mean you can discount the importance of accuracy. Each of the throws I highlighted today has something in common in addition to their impressive speeds: they all ended up right over the bag or plate.


Learning From Statcast’s Outfield Jump Metrics

© Nick Turchiaro-USA TODAY Sports

Everybody loves a shiny new tool. A new tool holds the promise of a better future. “This new spatula,” we say to ourselves, “will transport us to a world of fluffier pancakes.” “Loved ones,” we say to our loved ones, “this cordless drill is going to revolutionize the way we drill holes into things, if and when we decide to start drilling holes into things.”

Statcast’s Outfielder Jump Leaderboard is very shiny. For balls with a catch probability of 90% or lower, it lists every player’s average in several categories. Playing with this leaderboard, I envisioned a bright new future. A future where I could definitively tell anyone unfortunate enough to be within earshot whether it’s more important to get a good jump on a ball or take a good route to it.

Predictably, I broke the tool immediately. Or at least, I thought I did. What I noticed was that the players who took good routes tended to be, well, bad. They had worse reactions, bursts, and Outs Above Average. Most damningly, they counted among their number one Kyle Schwarber. That made me curious. Read the rest of this entry »


High Sliders: Junk or Genius?

Janson Junk
Jayne Kamin-Oncea-USA TODAY Sports

In my time at Sports Info Solutions this summer, I scored both of Janson Junk’s 2022 major league starts. Typically, getting assigned to an Angels’ game, especially a Mike Trout-less one (he was injured at the time), would elicit a groan. However, come the second Junk start, I was admittedly a bit excited, because in his first turn, I saw a lot of this:

I kept the audio in that clip so that you can hear the announcer say “there you go, there’s another one” — specifically, another whiff on a high slider. I put the announcer’s assertion to the test by defining a high pitch as one in the highlighted part of Statcast’s strike zone:

In that start against the Royals alone, Junk threw 36 sliders, 17 of which were high. All four of his slider whiffs came on the high hard ones. In his next start against the lowly A’s, Junk didn’t fare as well, but the high slider wasn’t to blame. He threw 24 more sliders, eight of which were high. His only slider whiff came on a high one, and the two doubles he allowed off sliders were not off high ones.

Sadly, that’s all the data we have to go on, as Junk was demoted after failing to quiet Oakland’s typically silent bats. In Triple-A the rest of the year, he pitched to a 6.12 ERA and 5.10 FIP, making it unlikely he’d receive another nod in the majors this year. So I had to search elsewhere for a verdict on whether high sliders were truly effective in the majors. They certainly remain uncommon, with little change from last year to this year:

Using my Statcast-aided definition of high sliders, their usage has actually decreased from 18.0% last year to 17.3% this year, a statistically significant difference. Read the rest of this entry »


Baseball’s Top Relievers Are Really Good

© Jeff Curry-USA TODAY Sports

Tuesday night, I watched Ryan Helsley face the middle of the Brewers order in the bottom of the eighth inning. It went roughly how you’d expect – strikeout, groundout, strikeout. He came back out for the ninth, and after an inning-opening walk, closed out the frame with another two strikeouts and a groundout. It didn’t feel surprising; that’s just what great relievers do at the end of games.

That wasn’t always the case. The game has changed over the years. Relievers are pitching fewer innings per appearance, and doing so in better-defined roles. Strikeouts are up everywhere. Velocity is up everywhere. Individual reliever workloads are down, which means higher effort in a given appearance despite bullpens covering more aggregate innings. I’m not trying to say that the current crop of relievers doesn’t have structural tailwinds helping them excel. But seriously – top relievers now are so good.

Look at the top of this year’s WAR leaderboard for relievers – either RA9-WAR or FIP-based WAR will do – and you’ll see a veritable wall of strikeouts. Edwin Díaz, Devin Williams, A.J. Minter, Helsley, and Andrés Muñoz are all in the top 10 and all run preposterous strikeout rates. They’re good in an in-your-face way. Since I’ve watched baseball, dominant late-inning relievers have succeeded by striking batters out, but that trend has accelerated in the past decade or so. Here, take a look at the strikeout rate of the 10 top relievers in baseball, as determined by fWAR, every year since integration:

Read the rest of this entry »


Why Are Catchers So Dang Slow?

Yadier Molina
Jeff Curry-USA TODAY Sports

It doesn’t take a keen eye for analysis to watch a baseball game and guess which player is the slowest. You could grab a stopwatch and time them running to first, or you could just take a look at the short and stout guy crouching all game and wearing body armor. I’m not breaking any ground when I tell you that catchers are the slowest major leaguers.

A less settled question: why are they so slow? Is it the armor? Is it the short and stout part? Is it the deleterious effect of crouching all day? We have eight years of sprint speed data, so I decided to dig into it and look for an answer.

First things first: I constructed a sprint speed aging curve. To do that, I took every player-season with at least 10 competitive runs starting in 2015. For each player-season, I noted their age, position, sprint speed in year one, and change in sprint speed in the subsequent year (assuming they made at least 10 competitive runs). For example, Byron Buxton was 21 in 2015 and posted an average sprint speed of 30.9 ft/sec on competitive runs while playing center field. The next year, he again posted an average sprint speed of 30.9 ft/sec. Thus, I recorded 21, CF, 30.9, and 0 (change). Read the rest of this entry »


The Guardians Saved Their Closer

© Ken Blaze-USA TODAY Sports

Tuesday night, the White Sox and Guardians played to a standstill over the first eight innings of a game that would help decide the fate of the American League Central. Of course, getting late into the game with a chance to win suits both teams just fine. The White Sox have Liam Hendriks anchoring their bullpen, while the Guardians have Emmanuel Clase in the same role in theirs.

Hendriks pitched a scoreless top of the ninth. But even with the Guardians’ two best setup men, Trevor Stephan and James Karinchak, out of the game, Clase cooled his heels in the Cleveland bullpen while Enyel De Los Santos matched Hendriks out for out. What was Terry Francona up to?

He was, in fact, playing the percentages. “Never save your closer” is a modern analytical truism, but it wasn’t designed for the zombie runner rule. When every inning works the same, you should always get your best pitchers into the game post haste. The only difference between the ninth and 10th innings used to be that you might not get to play the 10th. That’s not the case anymore.

As I examined in 2020, making the 10th inning a higher-scoring affair than the ninth changes optimal pitcher usage. When all the action is in the 10th, it follows that you want your best arm pitching then. Walking the tightrope in extra innings and escaping without a run allowed is quite difficult; it’s an inherently higher-leverage spot, which means using your best reliever pays off.

The easiest way to think about it is with someone like Ryan Helsley or Edwin Díaz, a pitcher who frequently ignores runners on base thanks to strikeouts. Outs aren’t all created equal. With a runner on first and less than two outs, a groundout is the best kind of out thanks to the chance of a double play. With a runner on third and less than two outs, strikeouts and popups reign supreme. With the bases empty, everything is the same. The base/out state determines a lot about the optimal style of pitching. Read the rest of this entry »


Jakob Junis and the Disappearing Fastball

© Isaiah J. Downing-USA TODAY Sports

This is Kyle’s first piece as a FanGraphs contributor. Kyle is a lifelong baseball fan who has always been enamored with the numbers and analytics behind the game. He has written for PitcherList on the pitcher GIFs team and for his own personal blog, covering topics from player analysis to the draft, mostly focused on the Angels. Kyle is a senior at the University of California, living in the Bay Area and studying education and math. As an aspiring teacher, he wants to think and write about the game of baseball from the perspective of an educator.

From 2017-20, Jakob Junis was a below-average starter for the Royals, posting a 4.78 ERA and 4.77 FIP. After a poor 2021 that saw him pitch out of the bullpen, he was non-tendered by Kansas City and signed with the Giants. Fresh off a 107-win season that was bolstered by career resurgences from hurlers like Johnny Cueto, Anthony DeSclafani, and Alex Wood, San Francisco clearly saw a path to improvement for Junis. Mostly serving as a member of the starting rotation, Junis has done just that – his FIP has improved by about a full run (3.83). While he hasn’t thrown harder, landed more strikes, or added movement to his pitches (his sweeping slider has actually lost about an inch of break), he’s made one important change, and it’s one that is emblematic of pitching philosophy in the modern age.

Jakob Junis Pitch Usage
Year(s) Fastball/Sinker Slider Changeup Other
2017-20 52.6% 39.9% 5.9% 1.7%
2022 32.5% 51.8% 15.7% 0%

Read the rest of this entry »


The Secret Benefit (And Cost) Of Sweeping Sliders

© Kirby Lee-USA TODAY Sports

I, for one, am not a fan of the breakout of the “sweeper” in recent years. It’s not because I don’t enjoy frisbee-ish pitches that seem to pull out a map, ask for directions, and take a sharp turn on their way from the mound to home. A big part of my job is making GIFs of fun pitches, so I obviously love that part. Personally, I just don’t like the annoyance involved in classifying them.

To give you an example, I decided to do some research on sweeping sliders, or whirlies if you’re into weird nomenclature. In fact, that’s what this article is about. On my way to doing so, however, I had to spend some time getting obnoxiously technical. First, I downloaded all the sliders that right-handed pitchers have thrown this year. I separated them by movement profile, then started asking questions.

I asked a few people, “Does this scatter plot look like it separates out sweepers and non-sweepers to you?” It kind of did, and it also kind of didn’t. Are pitches that have 30% more horizontal break than vertical break sweepers? What about 50%? What about pitches that break a foot horizontally but move six inches downward? I sent several variations of that chart trying to nail it down, but nothing felt quite right – I’ll spare you having to look at the mess I ended up with. Read the rest of this entry »


Why Are the Orioles’ Playoff Odds So Low?

© Troy Taormina-USA TODAY Sports

At this point, it’s becoming a meme. The Orioles chug along, at or around .500, and our playoff odds continue to say that they’ll almost certainly miss postseason play. Across the internet, sites like Baseball Reference and FiveThirtyEight give them a higher chance. The headlines write themselves: “Why doesn’t FanGraphs believe in the Orioles?”

Just to give you an example, after the games of July 29, the Orioles were 51–49. Baseball Reference gave them a 34% chance of reaching the playoffs; we gave them a 4.6% chance. Ten days later, on August 8, Baseball Prospectus pegged them at 22.2% while we had them at 5.4%. On August 11, FiveThirtyEight estimated their playoff odds at 16%; we had those odds at 5.7%. Another week later, on August 19, Baseball Reference pegged them at 35.5% to reach the playoffs; we gave them a 4% chance. You can snapshot whatever day you’d like and you’d reach the same conclusion: we don’t think the Orioles are very likely to make the playoffs, while other outlets do.

Now, we’re getting down to brass tacks. The Orioles are 68–61 after Wednesday’s games. Baseball Reference thinks they are 43.6% to reach the postseason. FiveThirtyEight isn’t quite so optimistic, but still gives them 23% odds, while Baseball Prospectus has them at 29.9%. Here at FanGraphs, we’re down at 6.6%, even after they called up top prospect Gunnar Henderson. Why don’t we believe? Read the rest of this entry »


Do Head-to-Head Regular Season Records Matter in the Playoffs?

© Jayne Kamin-Oncea-USA TODAY Sports

Since I’m an obnoxiously determined Devil’s advocate, one of my favorite uses of data is tackling conventional wisdom. For example, one such bit of wisdom that always bugs me is when pundits insist that the best teams are the ones that win close games. In fact, the opposite is true. The most predictive run differential comes in blowouts — the good teams are the ones that are more likely to humiliate their opponents, not squeeze out a close one. This time of year, you start to see a lot of analysis asserting that X team is definitely blessed or doomed come playoff time because of some randomly chosen factor Y. We could do a column a day on these and still have dozens of unwritten pieces by the time the actual playoffs roll around, but let’s focus on a few specific ones, concentrating on who good teams beat rather than how many games they win.

First off, do regular season head-to-head records matter in the playoffs? Since the start of divisional play in 1969, teams that face each other in the playoffs have frequently met in the regular season. Interleague play added eventual World Series matchups to the regular season, and starting in 2023, every playoff matchup will have already occurred during the regular season. Given the sample size of playoff series, if we construct a simple model of series winning percentage that only consists of a team’s regular season winning percentage and its winning percentage in head-to-head matchups, the model horribly inaccurate, with an r-squared of 0.0886 and a mean absolute error of 275 points of winning percentage.

But including head-to-head winning percentage doesn’t really even have a marginal influence on the coin flip; without the head-to-head matchups, the model’s MAE increases to 276 points of winning percentage. Now, a head-to-head record may imply something about a team’s overall strength that isn’t captured in its overall record, but rather than pick up a small sample implication, we can use strength of schedule directly, which does help the model a tiny bit (playoff series are always going to be very uncertain unless we move to best-of-75 series or something wacky). Read the rest of this entry »