Up in Seattle, the Mariners had a problem. Eugenio Suárez, who the team initially acquired as salary ballast in the trade that brought them Jesse Winker, was due to make $11 million next year – $13 million if you count a buyout on a team option for 2025. This wasn’t a huge problem – Suárez had been solid since joining the team, racking up 7.3 WAR in two seasons – but for a club whose payroll has bounced around between $110 million and $140 million in recent years, it’s a sizable chunk of the puzzle.
What’s more, Jerry Dipoto telegraphed the team’s intention to favor long-term budget sustainability over short-term upgrades in his now-infamous 54% remark. Dipoto apologized for the tone of those comments – “doing the fans a favor” is just not a good way to phrase things – but the broad point was hard to miss. The Mariners are committed to building their team for the long run on their own terms, which seems to mean prioritizing payroll savings and cost-controlled players wherever possible. Read the rest of this entry »
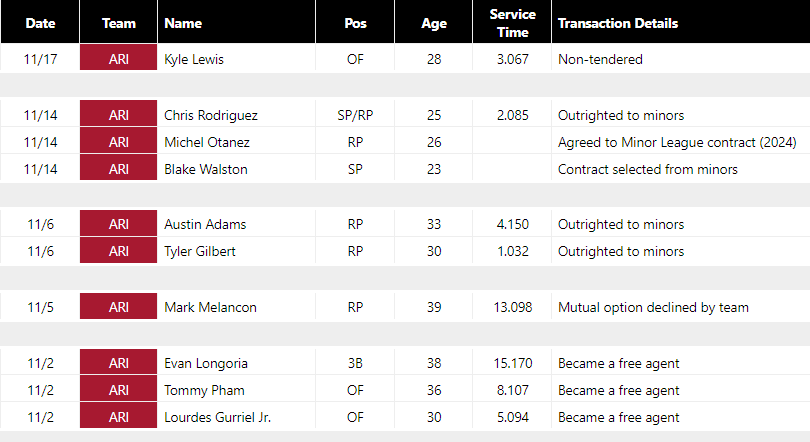
Last week I covered the American League half of the flurry of transactional activity that occurred as a result of the 40-man roster and non-tender deadlines. Is any one move here as impactful as signing a Yoshinobu Yamamoto or a Matt Chapman? No, but when your favorite team experiences a rash of injuries in June, whether or not they have the depth to scrap and compete is often dictated by the people and processes that surround this day. Below are my thoughts on the National League, with some quick scouting snippets on most of the added players and thoughts about roster construction where I had something to say.
Arizona Diamondbacks
The Diamondbacks lone addition was lefty Blake Walston, a former $2.5 million high school signee who, despite being young for his class and physically projectable as an amateur, has seen his fastball velocity plateau and slightly decline since he signed. He’s had fits and starts where he’s thrown harder, but for the most part, Walston’s fastball still sits 89-92 mph and his performance peripherals took a nosedive in 2023, though part of that was likely because of the PCL hitting environment. The lanky 22-year-old is still a fair long-term prospect because of his age and what one could reasonably hope will still be late-arriving physicality, but for now, I’d consider him at the very back of Arizona’s 40-man starting pitching depth chart. Read the rest of this entry »
The first of MLB’s major awards to be announced for 2023, the Rookie of the Year awards, were given out Monday evening, with Arizona’s Corbin Carroll and Baltimore’s Gunnar Henderson taking the laurels in the NL and AL races, respectively.
Getting inappropriately annoyed with year-end awards — more specifically in 1995, the year Mo Vaughn beat Albert Belle in the AL and Dante Bichette confusingly finished second in the NL — was one of the things that got me reading Usenet. A high schooler at the time, I had little idea that it was the start of a surprising career path. And even back then, I was frustrated that the writers who voted for these awards didn’t always make convincing arguments about their picks and, occasionally, offered no justifications at all.
I still believe that this kind of transparency is crucial for the legitimacy of any type of award. This is ostensibly an expert panel; if it’s not, there’s no purpose for the award to exist. As such, a secret ballot is not appropriate the way I believe it is for, say, a presidential or parliamentary election. So, as usual, this is my explanation (or apologia depending on your point of view) of why I voted the way I did. I don’t expect 100% of people to agree with my reasoning, which I doubt has happened for any opinion I’ve expressed ever, but that doesn’t mean I don’t owe you, the reader, the details of my vote.
This is my fifth Rookie of the Year vote. Previously, I gave my first-place votes to Spencer Strider, Trevor Rogers, Pete Alonso, and Corey Seager. This year, my ballot, starting at the top, was Carroll, the Mets’ Kodai Senga, and the Reds’ Matt McLain. Let’s start at the top. I’m also including preliminary 2024 ZiPS projections because, hey, why not? (They didn’t have any bearing on my vote, nor did the preseason projections.)
The Easy Part: Corbin Carroll
My last two first-place votes were close for me, and it took a while to decide on them. But this one was the easiest since Seager in 2016 (and I’m not forgetting Alonso versus Michael Soroka). Everyone expected Carroll to steamroll the league, and that’s just what he did. And while he didn’t have a Mike Trout-esque rookie season, who does?
For much of the season, Carroll logically was part of the MVP discussion, though by the time September rolled around, Ronald Acuña Jr. and Mookie Betts had an obvious advantage, with Freddie Freeman and Matt Olson being clearly superior, too. But if I had voted for the NL MVP, Carroll would have still landed somewhere in the back of my ballot. He hit .285/.362/.506, clubbed 25 homers and stole 50 bases, and played all three outfield positions at least respectably. He is the type of player for whom the phrase “speed kills” makes sense, because his skill set is broad enough that he can actually weaponize that speed. For the season, he was seventh in sprint speed, had dominating baserunning numbers beyond stolen bases, and in 90-foot splits, he was bested only by Elly De La Cruz.
ZiPS Projection – Corbin Carroll
Year
BA
OBP
SLG
AB
R
H
2B
3B
HR
RBI
BB
SO
SB
OPS+
DR
WAR
2024
.279
.362
.485
555
99
155
27
12
21
90
61
141
39
129
10
5.4
2025
.275
.359
.480
571
104
157
28
10
23
94
64
139
39
127
10
5.4
2026
.272
.358
.474
570
104
155
28
9
23
95
65
133
37
125
10
5.2
2027
.273
.361
.479
568
105
155
29
8
24
95
67
129
36
127
9
5.4
2028
.272
.363
.479
566
105
154
29
8
24
94
69
125
33
128
9
5.3
The Still Pretty Easy Part: Kodai Senga
I’m inclined to like Senga considerably more than his WAR simply because he has a significant history of outperforming his peripherals in Japan as well, so there’s more basis for believing in his ERA than for the typical pitcher in this position. Because of that, I’m closer to bWAR on Senga (4.4) than I am to fWAR. If forced at gunpoint to name the Dan’s Brain WAR for Senga, I’d probably put him at 3.8–4.0 or so. Also, that’s a very weird use of a firearm.
There’s always a writer or two who complains about Japanese players being eligible for the RoY award, but I think the idea that they shouldn’t be is preposterous. Nippon Professional Baseball appears a bit closer to the majors than Triple-A ball in the U.S. is — something like Triple-A 1/2 — but it’s a very different kind of league. While Triple-A hitters may be easier than NPB hitters, you’re also facing a rather different style of play and plate approaches, and now that some of the recent rule changes have hit in the majors, Triple-A ball is roughly a not-as-good MLB.
Despite facing different types of hitters, a spate of different rules, and against the backdrop of New York pressure and a collapsing team behind him, Senga was one of the few players who could really be counted on there. He had some issues with walks early on, and to his credit, he adjusted. But it wasn’t actually his control that was the issue; he actually threw more strikes earlier in the season! Instead, the issue was that after putting up an out-of-zone swing rate above 30% in each of his last two seasons in Japan, he was down in the low-20s early on with the Mets. As time went on, he got a better feel on how to lure MLB batters to their doom; in the second half, his 31.1% out-of-zone swing rate was right where it was in Japan.
ZiPS Projection – Kodai Senga
Year
W
L
ERA
FIP
G
GS
IP
H
ER
HR
BB
SO
ERA+
WAR
2024
11
8
3.63
3.87
28
28
161.0
132
65
18
76
190
122
3.4
2025
10
7
3.72
3.94
26
26
150.0
126
62
17
69
171
119
3.0
2026
9
7
3.82
4.06
24
24
141.3
124
60
17
63
156
116
2.7
2027
8
7
3.98
4.24
22
22
129.0
118
57
17
58
138
111
2.3
2028
7
8
4.21
4.46
21
21
124.0
118
58
17
56
128
105
1.9
The Excruciating Part and the Fifth Wheel: Matt McLain versus Nolan Jones versus James Outman
I don’t see Rookie of the Year as necessarily meaning Most Valuable Rookie, but as Best Rookie. As such, in a kind of small-scale examination of Hall of Fame candidates’ peak versus career numbers, I don’t necessarily think measures against replacement are as important as in the MVP voting, which has directions that more strongly imply an emphasis on quantity.
Outman was probably the most valuable of the three hitters I listed above, but he also got a lot more playing time, winning the job from the start. Both McLain and Jones out-hit him from a quality standpoint, with a 128 wRC+ from McLain, a 135 from Jones, and a 118 from Outman. I might discount this if there were evidence from their minor league time that the major league time was flukier, but both played in Triple-A just about how you’d expect from their actual major league performances. Outman was an excellent player and a big part of why the Dodgers survived the loss of a lot of players, but I would have him fifth in a larger ballot because he wasn’t quite as good as McLain or Jones. Per WAA on Baseball-Reference, both McLain and Jones were well ahead of him.
McLain versus Jones was very difficult for me, and I went back and forth on it the entire Sunday I made my vote (the last day of the season). And it still wasn’t an obvious result, more a 51%–49% judgment; if asked on a different day, I might have said Jones instead of McLain. But at the end of the day, I had to pick one. McLain hit almost as well as Jones did and played the hardest non-catcher defensive position. I don’t like deciding based on small things, but it’s inevitable if the big things can’t settle the score. The slight nudge to McLain comes on the balance of having the more valuable defensive versatility (2B/SS for him versus 3B/OF for Jones) and the fact that he played for a team that was playing higher-leverage games all season, with a deep roster of prospects that could push him off a job at any time. The Rockies, meanwhile, were a basement dweller without a lot in the cupboard.
Jones may have just missed my ballot, but it’s no negative reflection on what was an excellent season. I was quite perturbed that he didn’t start the season in Colorado, with the Rockies apparently deciding that Mike Moustakas was nine years better in age than Jones, but they at least weren’t stubborn after he crushed pitchers in the Pacific Coast League. That wRC+ of 135 was an OPS+ of 138 if you like the simpler approach, and both numbers are park-adjusted, so he was Actual Good, not merely Coors Field Good.
Outside of Senga, no pitcher was close to making my ballot, though these three came closest. The Dodgers should be greatly pleased about having Miller’s services, but his numbers weren’t enough to balance out a rather low innings total. Pérez not being called up until May was a handicap, and while the Marlins being cautious with his workload to the extent of giving him a bit of a mini-vacation in July may be good for his future, it’s hard to give a Rookie of the Year vote to someone who threw less than 100 innings. Abbott’s mid-rotation performance was absolutely needed by the Reds, but again, not quite enough.
Of the rest of the field, the closest to making my ballot was Bailey, who was absurdly good defensively in 2023. I could have voted for a player short on playing time; I clearly did with McLain and was close with Jones. But to vote for a hitter at any position who slashed .233/.285/.359 over Outman, McLain, and Jones, I’d need a lot more certainty with defensive numbers than I have. We’ve made great progress in evaluating defense, but it remains extremely volatile, meaning that we simply can’t count on a small sample of defensive data to the same degree as a small sample of offensive data.
I have little doubt that Bailey is an elite defensive catcher, but just how elite is crucial to advancing him over the others with only 97 games played. And it was just a bridge too far for me; if he had been the catcher at the start of the season, there would have likely been a little more flexibility on how to deal with a defense-only candidate.
Steer played the entire season but was basically a league-average starter — something that had value, but he was clearly behind several others in quality. Alvarez hit a lot of homers (25) but was rather one-note in his offensive contributions, though he really surprised with his framing numbers. Tovar was brilliant defensively, and it was nice to see him as a Gold Glove finalist, but his offense was well behind his glove.
De La Cruz was arguably the most exciting of the prospects, maybe even more than Carroll, but he still has some serious holes in his game that were exposed with time in the majors. At the very least, he’s going to need to shore up his plate discipline or become better at effectively connecting with junk in the way Tim Anderson was able to do at his peak.
As I’ve done for the past fewyears, I’m going to be grading each eliminated postseason manager on their decision-making. We spend the year mostly ignoring managers’ on-field contributions, because to be honest, they’re pretty small. Using the wrong reliever in the eighth inning just doesn’t feel that bad on June 22; there are so many more games still coming, and the regular season is more about managing the grind than getting every possible edge every day. The playoffs aren’t like that; with so few games to separate wheat from chaff, every last ounce of win probability matters, and managers make personnel decisions accordingly. What better time to grade them?
My goal is to evaluate each manager in terms of process, not results. If you bring in your best pitcher to face their best hitter in a huge spot, that’s a good decision regardless of outcome. Try a triple steal with the bases loaded only to have the other team make four throwing errors to score three runs? I’m probably going to call that a blunder even though it worked out. Managers do plenty of other things — getting team buy-in for new strategies and unconventional bullpen usage behind closed doors is a skill I find particularly valuable — but as I have no insight into how that’s accomplished or how each manager differs, I can’t exactly assign grades for it.
I’m also purposefully avoiding vague qualitative concerns like “trusting your veterans because they’ve been there before.” Playoff coverage lovingly focuses on clutch plays by proven performers, but Corbin Carroll and Evan Carter were important, too. Forget trusting your veterans; the playoffs are about trusting your best players. Corey Seager is valuable because he’s great, not because of the number of playoff series he’s appeared in. There’s nothing inherently good about having been around a long time; when I’m evaluating decisions, “but he’s a veteran” just doesn’t enter my thought process.
One note: In the pitching section, I took a more specific look at reliever matchups. This 2022 Cameron Grove study measures a repeat-matchup reliever penalty. A recent article examines the issue without focusing on specific matchups, but rather looking at relievers pitching on back-to-back days or on short rest after heavy workloads. Both of these things are, unsurprisingly, bad for reliever performance. Managing the balance between starter and reliever over-work is really hard. I probably haven’t given enough credit to the necessity of balancing bullpen workloads against particular opposing batters in the past, but I’ll make a note of it going forward.
When I began writing this piece about Alek Thomas‘ defense, it was in response to the excellence he had shown in the postseason as Arizona’s everyday centerfielder. Since then, an elephant walked into the room in the form of his ninth-inning error in Game 5 of the World Series, and while it didn’t cost the Diamondbacks the title or even the game, it undoubtedly left a bitter taste in his mouth that he’ll likely spend much of the offseason trying to rinse out. But his late-game error was a tragically timed blip on an otherwise excellent performance this October — one that speaks to the specific improvements he’s made to his outfield defense, and how those adjustments have altered his forecast as a big leaguer. So let’s take a look at how Thomas’ defense has evolved since his days as a bat-first prospect, rewinding to this catch in Monday night’s Game 3.
That catch was one of several he made throughout the postseason, which provided Thomas with a national audience to wow with his range in the outfield. The way he covered ground out there played well on TV, too, particularly how he went back on deep balls to center field, sprinting with his head down toward the wall and making mid-route adjustments as needed. But while his wall-banging robbery of what would otherwise have been an RBI double for Mitch Garver was an obvious defensive highlight in its own right, it was also a clear indication of the improvements Thomas has made to his center field defense over the past couple seasons. Read the rest of this entry »
You might have noticed a surfeit of bunting in this postseason, or at least it seemed that way because Geraldo Perdomo was in the World Series. I, the man who launched an impromptu Bunt Week two months ago, could not let the opportunity pass to sit in judgment of these bunts.
We often decry the sacrifice bunt as a needless waste of outs, but a bunt for a hit can be one of the most audacious, skilled plays in the sport, as beautiful in its own way as a light-tower home run. In fact, every bunt is distinctive and wonderful, and so each must be examined — all 26 of them — for procedural and results-based value, tactical and strategic context, as well as aesthetic value. These are just the 26 bunts that resulted in action, according to Baseball Savant, so be warned: failed bunt attempts are not featured. If you’re looking for that failed Trea Turnerpush bunt in Game 7 of the NLCS, you will not find it here. (Though for the record, I didn’t hate it.)
In Game 4 of the NLCS, Torey Lovullo ran out of starting pitchers, so he sent Joe Mantiply out there, and decided to mix and match with the rest of his relievers until the game was either won or lost. And it worked. Phillies manager Rob Thomson also went to his bullpen early, and before too long we had a close matchup of dueling bullpens. The hope in such a strategy is merely to survive to see the endgame, and pit one’s high-leverage relievers against the opponent’s offense, just as would be the case with a conventional starter.
Both teams got that far. Andrew Saalfrank had a little bit of a meltdown, but Orion Kerkering and Craig Kimbrel had a big meltdown, so the Diamondbacks won. Faced with an identical conundrum in Game 4 of the World Series, Lovullo played “Freebird” again and called on Mantiply once more.
How did it go? Not too badly for Mantiply, who was a bit unlucky to take the loss after striking out three batters and allowing two hits in an inning and a third. But after that, the Arizona bullpen imploded like an overripe tomato under the wheel of a dump truck. Read the rest of this entry »
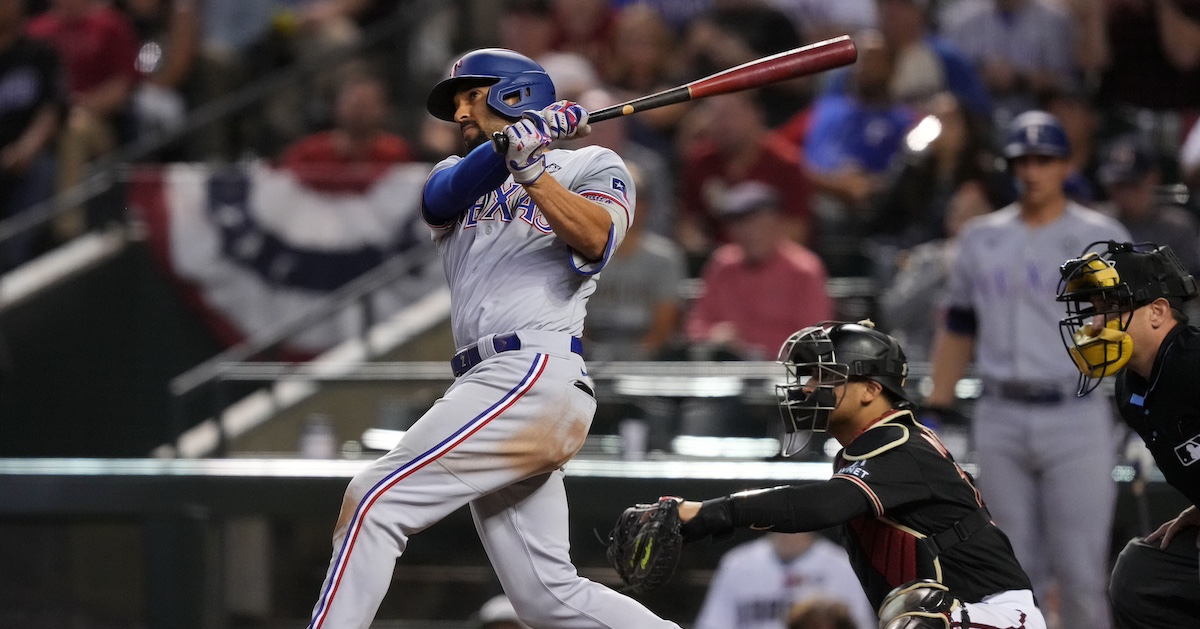
The last of the extant pre-divisional era franchises to not have won the World Series has finally hoisted their own trophy, as the Texas Rangers shut down the Arizona Diamondbacks, 5-0, to score the team’s first championship. Texas’ starter, Nathan Eovaldi, was shaky in the early going, but every last one of Arizona’s runners were stranded on the basepaths, and the shelling of Paul Sewald in the ninth sealed the deal with insurance runs.
If you just watched the starting pitchers, Eovaldi and Zac Gallen, for the first five innings on Wednesday night, you might be surprised that the series didn’t find its way back to Texas. The Rangers entered Game 5 having won all five of Eovaldi’s starts this postseason, but it was Gallen who looked to have the advantage early on. Eovaldi’s control was spotty. He allowed five walks over five innings, the most free passes he’s issued in a decade, going back to when he was a hard-throwing Marlins prospect who had trouble putting away batters. Read the rest of this entry »
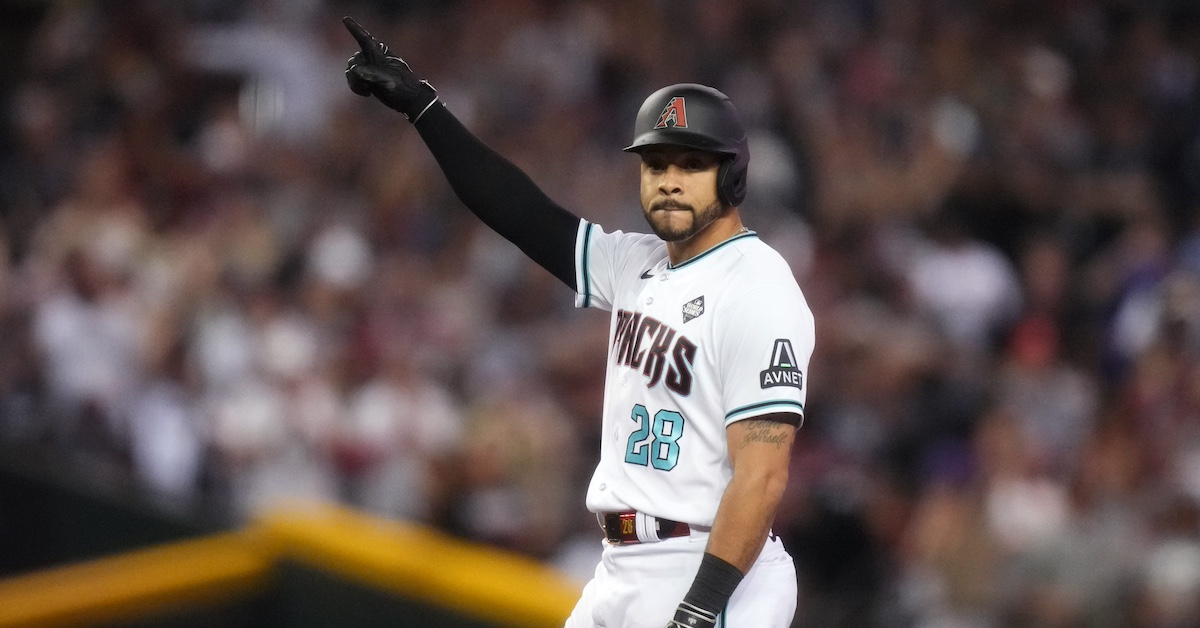
Tommy Pham got benched this postseason. That probably sounds weird to you, and for good reason. He’s been one of Arizona’s most consistent players in the World Series, with hits in every game and a boatload of loud contact. But not so long ago – Game 5 of the NLCS, to be precise – Torey Lovullo sent Pham to the bench and didn’t even call on him to pinch-hit.
Why? It’s pretty simple: Pham wasn’t hitting. He struck out six times in his first 13 plate appearances of the championship series. More broadly, he was mired in a postseason-long funk. He was hitting .229/.250/.314 in October, and his peripherals were somehow even worse than that. He posted a 2.8% walk rate and 30.6% strikeout rate. His chase rate was up five percentage points compared to the regular season. His hard-hit rate was down, albeit in a tiny sample. Don’t write this off as merely a random blip; Pham was legitimately playing worse, and the poor results were a natural consequence.
While Torey Lovullo phrased it as more of a rest day – “I just was giving him a little bit of a blow,” he told Sam Blum – I think there was a little more to it than that. Zack Wheeler, the pitcher that night, has an expansive arsenal, but against righties, he tends to feature his sinker and sweeper. Sinkers might be Pham’s greatest weakness. Read the rest of this entry »
Do you like pitchers? Of course you do – you’re reading a recap of a World Series game on FanGraphs. Good news, then: Game 4 had so many pitchers. Swingmen, high-leverage guys, LOOGYs, ROOGYs, forgotten starters who had accumulated a light covering of dust throughout the playoffs, closers, setup men. You name it, this one had it. Unless, of course, you were rooting for the Diamondbacks.
When bullpen games work, a whirling mass of relievers traipse onto the mound and befuddle the hitters. When bullpen games don’t work, a whirling mass of relievers still traipse onto the mound, but with significantly less befuddling. Tuesday was one of those nights.
Joe Mantiply started off smoothly for the Diamondbacks, with four outs among the first six hitters. The bottom of the lineup was up, but Mantiply had already thrown 28 pitches, and Torey Lovullo started the bullpen carousel. Miguel Castro came in – and then things fell apart.
Castro retired the first batter he faced, but he just didn’t have it. Even that at-bat featured spotty command, and things got worse from there. With Leody Taveras batting, Castro uncorked a wild pitch that allowed a run to score. Then he walked Taveras. Then Travis Jankowski, who had only batted twice this postseason and was only in the lineup due to Adolis García’s oblique injury, laced a line drive single. Suddenly Texas’ best hitters were up with a chance to do damage. Read the rest of this entry »