Archive for Mariners

ZiPS Stretch Run Update: And Then There Were Four

Below you’ll find today’s ZiPS stretch run update. For details on just what’s going on here, please refer to my original article describing all these mathnanigans.

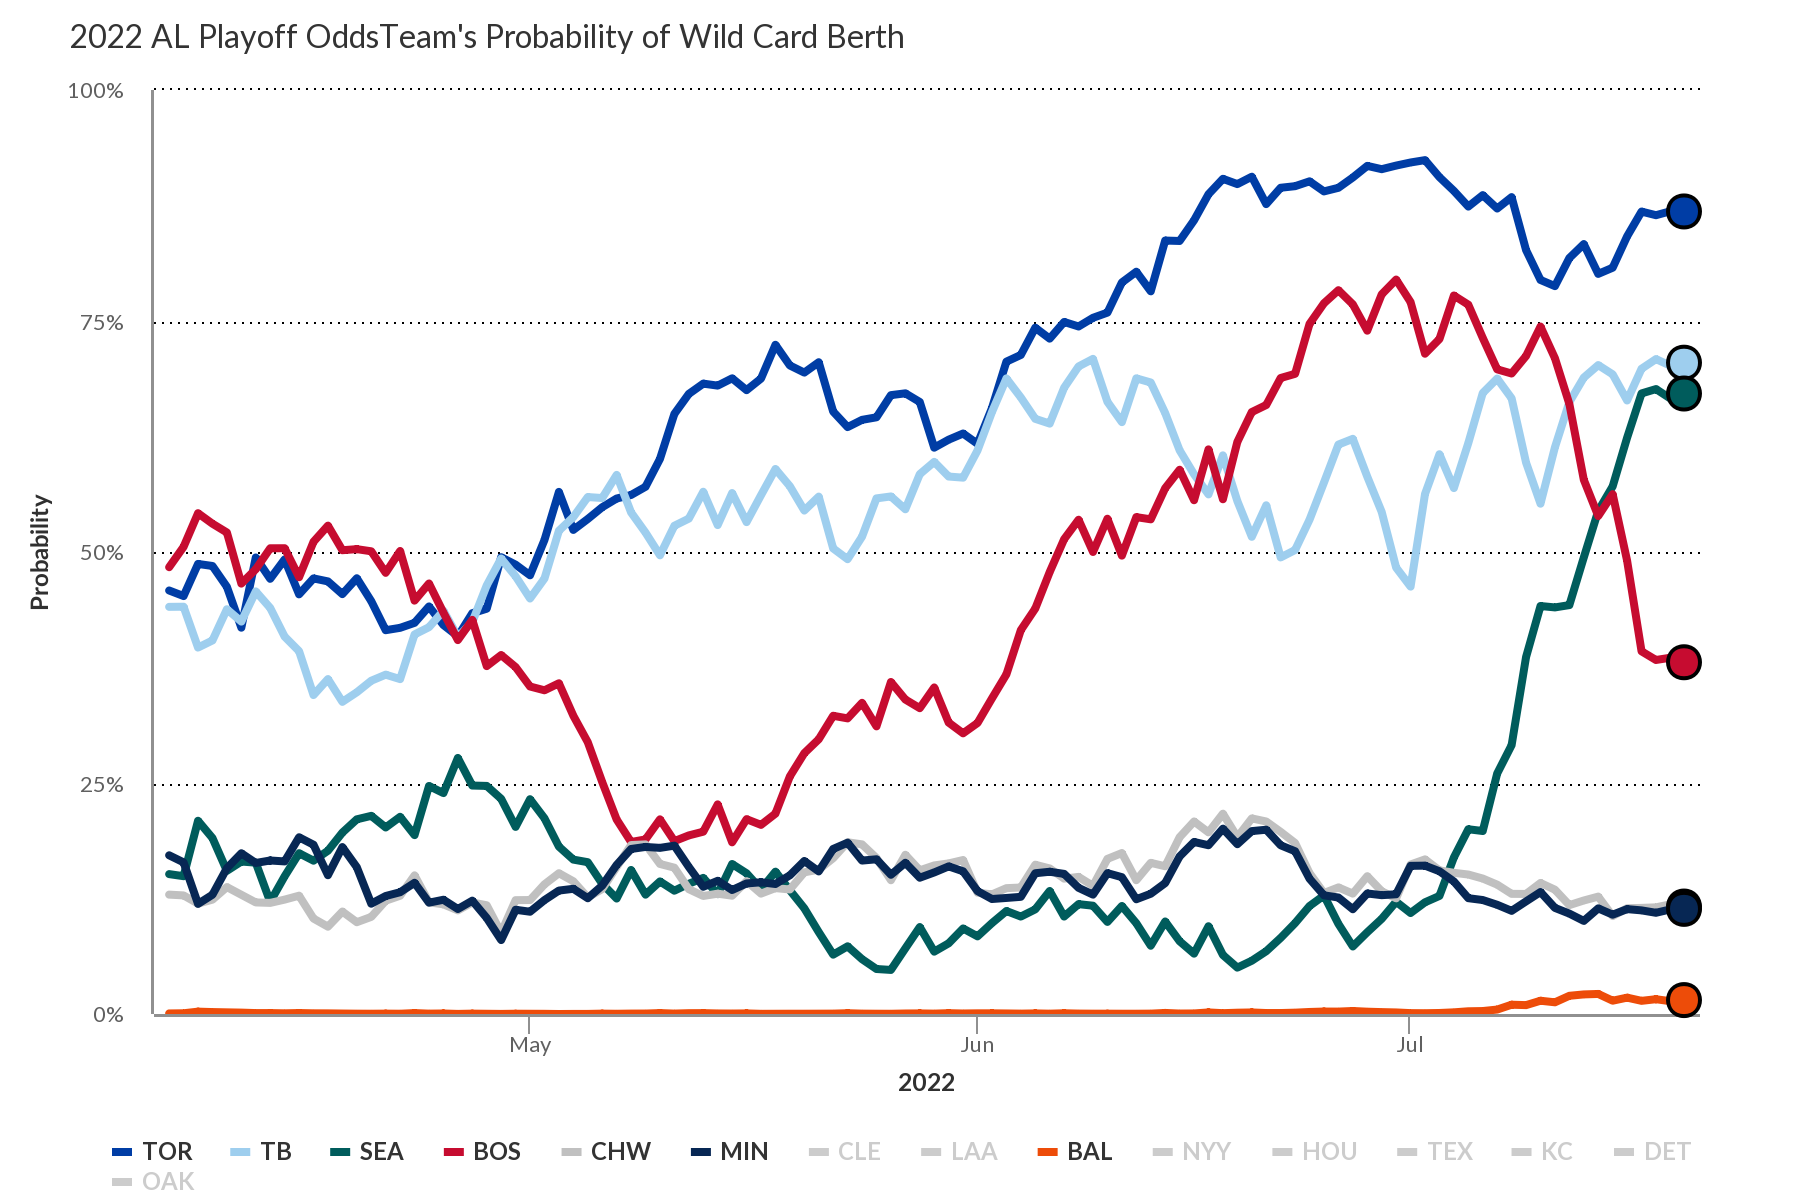
American League Wild Card

Seattle beat Oakland on Wednesday, sweeping the series and knocking the A’s out of playoff contention. As such, Oakland is no longer a participant in these charts. The Blue Jays won the second game of their series against the Yankees, preventing them from falling to fourth in the playoff probabilities, behind the Mariners. We’ll be a lot closer to knowing who makes the playoffs in the AL after tonight’s games, as those contests — the last contender vs. contender matchup, as well as the biggest creampuff game for a contender — are the two highest leverage games remaining. Read the rest of this entry »


ZiPS Stretch Run Updates for 9/29

A few days ago, I wrote about projections and the stretch run, using ZiPS to project each individual game and estimate its relative importance for the final standings. With just a few games remaining, most have the potential to drastically swing the disposition of the race. For example, the Mariners saw their playoff probability quintuple with last night’s win over the A’s! Let’s break down the latest and greatest.

AL Wild Card

This one is still very wide open, with the main difference from 48 hours ago being that the Mariners have pushed the A’s to the brink of elimination. Oakland can still make the playoffs, but the path is narrow and would require Oakland to win three or four games while Toronto, Boston, and Seattle mostly lose, and then perhaps survive a tiebreaker. Oakland can no longer catch the Yankees, so it’s in the A’s interest for the Yankees to finish a sweep of the Jays: Read the rest of this entry »


One Last Week For All the Marbles: ZiPS Projects the Postseason Home Stretch (9/28 Update)

9/28 Late Morning Update

ZiPS Playoff Drive Projections – AL Wild Cards
Day Home Team Starter Road Team Road Starter Home Team Wins Road Team Wins
9/28 Orioles Bruce Zimmermann Red Sox Chris Sale 37.5% 62.5%
9/28 Blue Jays Hyun Jin Ryu Yankees Jameson Taillon 56.1% 43.9%
9/28 Mariners Tyler Anderson Athletics Chris Bassitt 41.1% 58.9%
9/29 Orioles Zac Lowther Red Sox Nathan Eovaldi 31.6% 68.4%
9/29 Blue Jays José Berríos Yankees Gerrit Cole 51.9% 48.1%
9/29 Mariners Logan Gilbert Athletics Frankie Montas 45.0% 55.0%
9/30 Orioles Alexander Wells Red Sox Nick Pivetta 31.4% 68.6%
9/30 Blue Jays Robbie Ray Yankees Corey Kluber 56.9% 43.1%
10/1 Blue Jays Alek Manoah Orioles Chris Ellis 74.5% 25.5%
10/1 Nationals Erick Fedde Red Sox Eduardo Rodriguez 47.3% 52.7%
10/1 Yankees Nestor Cortés Jr. Rays Luis Patino 54.3% 45.7%
10/1 Mariners Marco Gonzales Angels Jose Suarez 46.2% 53.8%
10/1 Astros Zack Greinke Athletics Sean Manaea 57.0% 43.0%
10/2 Blue Jays Steven Matz Orioles John Means 62.7% 37.3%
10/2 Nationals Josh Rogers Red Sox Tanner Houck 38.8% 61.2%
10/2 Yankees Jordan Montgomery Rays Shane McClanahan 53.7% 46.3%
10/2 Mariners Chris Flexen Angels Jhonathan Diaz 50.7% 49.3%
10/2 Astros Framber Valdez Athletics Paul Blackburn 64.7% 35.3%
10/3 Blue Jays Hyun Jin Ryu Orioles Bruce Zimmermann 66.0% 34.0%
10/3 Nationals Josiah Gray Red Sox Chris Sale 41.6% 58.4%
10/3 Yankees Jameson Taillon Rays Shane Baz 45.3% 54.7%
10/3 Mariners Tyler Anderson Angels Shohei Ohtani 38.4% 61.6%
10/3 Astros Jake Odorizzi Athletics Cole Irvin 63.5% 36.5%


ZiPS Playoff Drive Projections – AL Wild Card Standings
Team Wild Card 1 Wild Card 2 Playoffs
Boston 37.2% 42.1% 79.3%
New York 46.0% 29.4% 75.3%
Toronto 16.0% 24.1% 40.2%
Seattle 0.8% 4.3% 5.2%
Oakland 0.0% 0.1% 0.1%

`

ZiPS Playoff Drive Projections – Changes in Playoff Projections
Scenario BOS NYA TOR SEA OAK
Boston Beats Washington on Friday 9.3% -2.8% -5.0% -1.4% 0.0%
Boston Beats Washington on Sunday 8.3% -2.6% -4.3% -1.3% -0.1%
Boston Beats Washington on Saturday 7.6% -2.4% -3.9% -1.3% 0.0%
Boston Beats Baltimore on Tuesday 7.6% -2.3% -3.9% -1.4% 0.0%
Baltimore Beats Toronto on Friday 7.1% 7.0% -15.9% 1.8% 0.0%
Boston Beats Baltimore on Thursday 6.8% -2.0% -3.6% -1.1% -0.1%
Baltimore Beats Toronto on Sunday 6.7% 6.4% -14.6% 1.5% 0.0%
Boston Beats Baltimore on Wednesday 6.6% -2.1% -3.4% -1.1% 0.0%
Baltimore Beats Toronto on Saturday 6.4% 6.2% -14.2% 1.6% 0.0%
New York Beats Toronto on Tuesday 3.5% 15.3% -19.1% 0.3% 0.0%
Tampa Bay Beats New York on Friday 3.5% -9.6% 5.0% 1.1% 0.0%
Tampa Bay Beats New York on Saturday 3.4% -9.6% 5.0% 1.2% 0.0%
New York Beats Toronto on Thursday 3.2% 15.3% -18.8% 0.3% 0.0%
New York Beats Toronto on Wednesday 2.9% 14.6% -17.9% 0.3% 0.0%
Tampa Bay Beats New York on Sunday 2.8% -7.6% 4.0% 0.8% 0.0%
Los Angeles Beats Seattle on Saturday 1.6% 0.9% 1.1% -3.6% 0.0%
Los Angeles Beats Seattle on Sunday 1.5% 0.8% 1.1% -3.3% 0.0%
Los Angeles Beats Seattle on Friday 1.5% 0.8% 1.2% -3.5% 0.0%
Oakland Beats Seattle on Wednesday 1.3% 0.8% 1.1% -3.3% 0.1%
Oakland Beats Seattle on Tuesday 1.2% 0.9% 1.0% -3.2% 0.1%
Houston Beats Oakland on Friday 0.0% 0.0% 0.0% 0.0% -0.1%
Houston Beats Oakland on Saturday 0.0% 0.0% 0.0% 0.0% -0.1%
Houston Beats Oakland on Sunday 0.0% 0.0% 0.0% 0.0% 0.0%
Oakland Beats Houston on Friday 0.0% 0.0% 0.0% 0.0% 0.1%
Oakland Beats Houston on Saturday 0.0% 0.0% -0.1% 0.0% 0.1%
Oakland Beats Houston on Sunday -0.1% 0.0% 0.0% 0.0% 0.1%
Seattle Beats Los Angeles on Saturday -1.7% -0.9% -0.9% 3.5% 0.0%
Seattle Beats Oakland on Wednesday -1.9% -1.2% -1.3% 4.4% 0.0%
Seattle Beats Los Angeles on Friday -2.0% -1.0% -1.1% 4.1% 0.0%
Toronto Beats New York on Tuesday -2.2% -11.6% 14.0% -0.2% 0.0%
Seattle Beats Oakland on Tuesday -2.2% -1.2% -1.5% 4.9% -0.1%
Toronto Beats New York on Thursday -2.3% -11.7% 14.1% -0.2% 0.0%
Toronto Beats Baltimore on Friday -2.4% -2.4% 5.3% -0.5% 0.0%
Seatle Beats Los Angeles on Sunday -2.4% -1.5% -1.6% 5.5% 0.0%
Toronto Beats New York on Wednesday -2.6% -13.1% 16.1% -0.3% 0.0%
New York Beats Tampa Bay on Saturday -2.6% 8.4% -4.6% -1.1% 0.0%
New York Beats Tampa Bay on Friday -2.8% 8.6% -4.8% -1.0% 0.0%
New York Beats Tampa Bay on Sunday -3.1% 9.2% -5.0% -1.0% 0.0%
Toronto Beats Baltimore on Sunday -3.4% -3.1% 7.3% -0.8% 0.0%
Toronto Beats Baltimore on Saturday -3.5% -3.6% 8.1% -1.0% 0.0%
Washington Beats Boston on Friday -10.4% 3.1% 5.4% 1.9% 0.0%
Washington Beats Boston on Sunday -11.6% 3.4% 6.0% 2.1% 0.1%
Washington Beats Boston on Saturday -12.5% 3.6% 6.5% 2.3% 0.1%
Baltimore Beats Boston On Tuesday -12.8% 3.8% 6.6% 2.5% 0.0%
Baltimore Beats Boston on Thursday -14.6% 4.3% 7.5% 2.7% 0.1%
Baltimore Beats Boston on Wednesday -14.8% 4.3% 7.6% 2.9% 0.0%


ZiPS Playoff Drive Projections – Game Leverage
Game Leverage
Toronto vs. New York on Wednesday 0.34
Toronto vs. New York on Tuesday 0.33
Toronto vs. New York on Thursday 0.33
Toronto vs. Baltimore on Saturday 0.22
Toronto vs. Baltimore on Sunday 0.22
Baltimore vs. Boston on Wednesday 0.21
Baltimore vs. Boston on Thursday 0.21
Toronto vs. Baltimore on Friday 0.21
Baltimore vs. Boston On Tuesday 0.20
Washington vs. Boston on Saturday 0.20
Washington vs. Boston on Sunday 0.20
Washington vs. Boston on Friday 0.20
New York vs. Tampa Bay on Friday 0.18
New York vs. Tampa Bay on Saturday 0.18
New York vs. Tampa Bay on Sunday 0.17
Seatle vs. Los Angeles on Sunday 0.09
Seattle vs. Oakland on Tuesday 0.08
Seattle vs. Oakland on Wednesday 0.08
Seattle vs. Los Angeles on Friday 0.08
Seattle vs. Los Angeles on Saturday 0.07
Houston vs. Oakland on Saturday 0.00
Houston vs. Oakland on Sunday 0.00
Houston vs. Oakland on Friday 0.00

The original data and methodology are below.
==
We’ve reached the final week of the 2021 regular season, and for fans of high-intensity, stretch-drive baseball — a group I think we can refer to as “everyone” — there’s still quite a lot to play for. Only five of the 10 playoff spots are claimed, with two of those five teams in a battle for a division title. And since there are just a handful of games left to play, we can move the ZiPS projections from the macro to the micro. In April, it’s always hard to project specific pitcher matchups, but with a week left to go in the season, it’s a more reasonable task of extrapolation. As a result, that allows me to adapt the ZiPS model into a game-by-game projection of the final week of the season for the relevant teams.

I’ve focused on three of the playoff spots, the two AL wild cards, and the NL East, along with the division versus wild card battle in the NL West. The Astros can still technically lose the division to the Mariners (one-in-about-1,800) or the Athletics (one-in-about-2,150), and the Cardinals could still have an epic collapse in which they lose six, the Reds win six, and they lose the tiebreaker (one-in-about-3,300). These could also become mathematical impossibilities quickly; if they become plausible rather than proverbial lottery tickets, I’ll update with the data.

Let’s start with the easy races.

NL East

The Braves enter the final week with a 2 1/2-game lead in the division but three games remaining against the Phillies. Their schedules are similar in strength, with Atlanta getting home games and Philadelphia on the road, something that’s largely canceled out by the former getting the slightly harder opponent (the Mets versus the Marlins). The edge comes from the cushion.

ZiPS Playoff Drive Projections – NL East
Day Home Team Starter Road Team Road Starter Home Team Wins Road Team Wins
9/28 Braves Charlie Morton Phillies Zack Wheeler 55.3% 44.7%
9/29 Braves Max Fried Phillies Aaron Nola 52.9% 47.1%
9/30 Braves Ian Anderson Phillies Kyle Gibson 57.4% 42.6%
10/1 Braves Huascar Ynoa Mets Carlos Carrasco 56.4% 43.6%
10/1 Marlins Sandy Alcantara Phillies Ranger Suárez 47.9% 52.1%
10/2 Braves Jesse Chavez Mets Trevor Williams 58.7% 41.3%
10/2 Marlins Jesús Luzardo Phillies Hans Crouse 50.1% 49.9%
10/3 Braves Charlie Morton Mets Marcus Stroman 62.0% 38.0%
10/3 Marlins Trevor Rogers Phillies Zack Wheeler 42.3% 57.7%
10/4 Braves Max Fried Rockies Kyle Freeland 54.6% 45.4%
10/5 Phillies Aaron Nola Braves Ian Anderson 51.7% 48.3%

With the edge in the standings, ZiPS projects just over a four-in-five chance that the Braves will not have to play the Rockies in a makeup game on Monday. Overall, the Braves win the division 87.7% of the time without the makeup game, and the Phillies stick the Braves in at least a 1 1/2-game hole 1.0% of the time.

Read the rest of this entry »

Daily Prospect Notes: 9/14/2021

These are notes on prospects from Eric Longenhagen. Read previous installments of the Daily Prospect Notes here.

Games on 9/12

Mason Fox, RHP, San Diego Padres
Level & Affiliate: Double-A San Antonio Age: 21 Org Rank: 38 FV: 35+
Line:
1 IP, 3 K

Notes
Fox’s previously dominant fastball (he had a 0.55 ERA and 0.98 WHIP in 2019, mostly in short-season ball) wasn’t as nasty during the spring. Sitting in the low-90s, he struggled and was shut down, and was put on the Development List for most of July and August. Back for about three weeks now, his fastball velocity has more often been in the 93-95 range again, though his curveball still lacks bat-missing power and depth. Because 2021 is his roster evaluation year (either he’s put on the 40-man or subject to the Rule 5 Draft in December) and because he’s thrown so few innings so far this season, the Arizona Fall league is perhaps a logical assignment for Fox and the Padres.

Jackson Rutledge, RHP, Washington Nationals
Level & Affiliate: Low-A Fredricksburg Age: 22 Org Rank: 5 FV: 45+
Line:
4 IP, 3 H, 1 BB, 1 R, 4 K

Notes
Speaking of other potential Fall League candidates (I’m drawing logical conclusions here, not reporting anything or leaking dope), Jackson Rutledge has struggled to take the ball every fifth day because of an early-season shoulder injury, and more recently, recurring blister issues. Sunday was Rutledge’s third blister-free start since his most recent activation. He’s sitting in the 94-98 range since returning, with his stuff intact coming off those dreaded shoulder issues. Obviously context is important here (it’s not as if Rutledge has gone every fifth day all year and is sitting 94-98), but that’s an encouraging sign for his health. Having amassed just 32 innings this season, Rutledge is a prime Fall League candidate. Read the rest of this entry »


Jarred Kelenic Keeps Coming Up Empty

In the days leading up to the trade deadline, Jarred Kelenic earned himself a mention in Jay Jaffe’s corner outfield replacement-level killers, a series that analyzes the players who are dragging down contending teams. The idea is to identify positions of need for potential trades to come, but Kelenic’s struggles in the majors weren’t going to force the team to make a deal. Instead, as Jay put it, “this should probably be a sink-or-swim situation unless he’s totally overwhelmed.”

Kelenic has already been in the spotlight because of the Mariners gaming his service time; his performance since his promotion has put him back in it. He got the call on May 13, but simply didn’t hit: In his first 23 games over a total of 92 plate appearances, he slashed .096/.185/.193. He collected just eight hits total and had come up empty in his last 44 plate appearances when the Mariners optioned him back to Triple-A in early June.

After a successful stint at Tacoma — a 137 wRC+ — Kelenic was brought back to Seattle. This time around, the results have been a bit better, but they’re still ugly overall, as he’s gone from a 10 wRC+ in that first stint to a .181/.263/.315 line and 65 wRC+ since his second promotion. Through Tuesday’s action, he’s up to a 45 wRC+ and -1.1 WAR in 64 games:

Jarred Kelenic by Major League Stint
ML Stint PA AVG OBP SLG BB% K% wOBA wRC+
First 92 .096 .185 .193 8.7% 28.3% .177 10
Second 167 .181 .263 .315 9.6% 30.5% .258 65

Even with the improved numbers since his return from Triple-A, Kelenic is still running the 11th-lowest wRC+ among qualified hitters in that time. He’s still not hitting well. But while there may not be one answer for why he is struggling, I believe that there’s a huge plate discipline problem that isn’t entirely captured in the walk and strikeout rates alone. Read the rest of this entry »


Paul Sewald Shows Us Why Vertical Approach Angle Matters

One of the biggest reasons the Mariners have stuck around the fringes of the AL wild card race despite a -60 run differential has been the collective performance of their bullpen. Kendall Graveman had established himself as a bonafide relief ace before being traded to the Astros in late-July, and Drew Steckenrider has revived his career after falling apart in Miami two years ago. But equally unexpected, and perhaps the biggest reason Seattle felt comfortable dealing Graveman at all, has been the fantastic season put together by its other breakout relief ace: Paul Sewald.

Drafted as a reliever by the Mets in the 10th round of the 2012 draft, Sewald came with two years of college experience under his belt at the University of San Diego and quickly moved through the farm system. He reached the majors in 2017 and made 125 appearances out of the bullpen through 2020, but outside of a 23.5% strikeout rate that was just a hair above league average, he was mostly forgettable as a Met; across 147.1 innings in New York, he posted a 5.50 ERA. He was non-tendered this past offseason and signed a minor-league contract with the Mariners in January.

Even though Sewald wasn’t able to make the major league roster out of spring training, he has thrived in Seattle. He was called up on May 13, the same day Jarred Kelenic and Logan Gilbert made their debuts, and while his return to the majors was much less heralded than those two top prospects, he’s arguably been more important to the Mariners this season than either. He’s upped his strikeout rate to 40.3% in 2021, the fifth highest rate among all qualified relievers, and all those strikeouts have helped him drop his FIP to just 1.95. In just 45.1 innings, he’s more than doubled his total career WAR.

Michael Ajeto of Lookout Landing was one of the first to write about Sewald’s breakout, but the reasons for his improvement are tough to spot on the surface. He’s simplified his pitch mix a bit, cutting out his rarely thrown changeup and increasing the usage of his slider to make him a two-pitch pitcher:

Both the fastball and slider are returning better-than-ever results, with the latter generating a 38.6% whiff rate and a .270 wOBA against. But as good as his breaking ball has been, the four-seam fastball has been even better. Its whiff rate is up to 35.3%, the 12th-highest mark among all four-seam fastballs thrown at least 100 times this year, and it boasts the 12th-highest CSW% (35.7) in that group.

Read the rest of this entry »


Daily Prospect Notes: AL Postseason Pitching On the Way

Whether it’s because they’re only just getting healthy or someone ahead of them has gotten hurt or their talent is kicking down the doors of roster manipulation made brittle by actual competitive spirit, some potentially important participants in postseason play are currently in the minors as we speak. This is especially likely when it comes to pitching, where health and effectiveness are tenuous, and team behavior surrounding promotion tends to be more opportunistic and aggressive.

For both leagues, I’m providing a scouting-centric update on pitching currently in the minors, either because the players are prospects who could conceivably play a September role or make a postseason roster, or because the player in question is a rehabbing big leaguer. Pitching can be streaky and fragile, so any of these guys could be in the big leagues at the drop of a hat, or they may simply convince their front office, like several rookies did last year, that they’re one of the best 26 guys in the org and need to be put on the playoff roster. The level of impact could range from Hunter Greene or Shane Baz dominating like Francisco Rodriguez in 2002, to Connor Seabold or Thomas Hatch humbly eating innings in a blowout loss in effort to save the rest of the bullpen for the series’ next game like J.A. Happ in 2008.

I’ll touch first on the American League this week, then provide some National League options next week. If any prospects moved on The Board due to info or opinions brought to light from this piece, I’ll note that below.

Read the rest of this entry »


The Mariners Are Trying To Be the Clutchiest Team on Record… Again

On July 26, the Seattle Mariners experienced what was perhaps the apex of their season. Down 6-0 against the Astros until the third inning, they embarked on an improbable rally that would culminate in an 11-8 victory. Let’s take some time to admire Dylan Moore and his swing, which produced the grand slam that punctuated the uphill battle:

Chills! It was a great moment, and not just for Mariners fans but for baseball in general. Who doesn’t love a cathartic underdog upset? (Well, maybe not the Astros in this moment.) But it was also a reminder of how the team had gotten to that point. Despite an ugly run differential, the Mariners had managed to squeeze out key wins throughout the season. This latest against the Astros gave them a 55-46 record. Suddenly, a Wild Card berth didn’t seem out of reach.

Two weeks later, the Mariners are still going. I had planned to write this article as early as July 24, when I tweeted about the team’s offense. In the back of my mind, I sort of assumed they’d fizzle out. But here we are, and the Mariners have a respectable 58-51 record – three games behind Oakland, and just a few more behind Boston. No team has been more clutch. Read the rest of this entry »


Ranking the Prospects Traded During the 2021 Deadline

What a ride this year’s deadline was. All told, we had 75 prospects move in the last month. They are ranked below, with brief scouting reports written by me and Kevin Goldstein. Most of the deals these prospects were a part of were analyzed at length on this site. An index of those pieces can be found here, or by clicking the hyperlink in the “Trade” column below. I’ve moved all of the players listed here to their new orgs over on The Board, so you can click through to see where they rank among their new teammates. Our farm rankings, which now update live, also reflect these changes, so you can see where teams’ systems stack up post-deadline.

A couple of quick notes before I get to the rankings. We’ve included a few post-prospect players here (those marked in blue) so you can get an idea of where we value them now as opposed to where we had them at their prospect peak. Those players, as well as the Compensatory pick the Rockies will receive after they extend Trevor Story a qualifying offer and he signs elsewhere, are highlighted below. We had closer to 40 prospects (and 23 Players to be Named Later) traded last year, with the PTBNL number inflated by 2020’s COVID-related transaction rules. The backfields are not well-represented here, with just four prospects who have yet to play in full-season ball. Two of those are currently in the DSL and have no official domestic pro experience, though Alberto Ciprian has played stateside for instructs/extended spring training. Now on to the rankings. Read the rest of this entry »


The M’s Find A Closer Upgrade While The Rays Confuse

The Mariners understandably upset their fan base on Wednesday when, while just one game out of the Wild Card race, they traded away Kendall Graveman, and to the Astros no less. While it’s still a debatable move, Seattle general manager Jerry Dipoto has shown a bit more of his hand since; after trading for Tyler Anderson to stabilize the rotation on Wednesday night, he found a better reliever than Graveman in the form of Rays closer Diego Castillo, who was acquired for righty J.T. Chargois and minor league corner infielder Austin Shenton. For Seattle, mystery solved, at least kind of; for the Rays, on the other hand, it’s a curious decision.

In getting Castillo, the Mariners have upgraded their late-inning options for the stretch run. Armed with one of the more deadly two-pitch combinations in the game, he is throwing more strikes than ever and missing more bats than ever, and given that he’s just 27, there’s still upside beyond what we’ve seen. There’s nothing complicated about what Castillo does or the way he does it; he’s a classic let-it-eat bullpen ace who sits 96–98 mph with the heater and has a slider in the upper-80s. In an era obsessed with revolutions per minute, he is the rare anti-spin guy, with below-average RPMs on both offerings, but he has found a way to add some two-plane break to his breaking ball this year. He’s also using his slider more than ever in 2021, with nearly 70% usage. Compare that to just two years ago, when he went after hitters with a nearly 50/50 mix.

While Castillo has greatly reduced his walks, he still certainly has far more control than command. It’s the same approach against every hitter: he elevates his fastball and throws his slider to the one location he can consistently get to, working the lower outer edge to right-handed hitters and back-footing lefties. It’s the kind of thing you can succeed at with quality pitches, and there’s no reason to think that success won’t continue. The Mariners added an elite high-leverage reliever who should be able to rack up saves in the Emerald City for three more years (Castillo is arbitration eligible for the first time this offseason), and they made their big league roster better, both right now and in the future.

Read the rest of this entry »