For the 22nd consecutive season, the ZiPS projection system is unleashing a full set of prognostications. For more information on the ZiPS projections, please consult this year’s introduction, as well as MLB’s glossary entry. The team order is selected by lot, and the next team up is the Chicago White Sox.
Batters
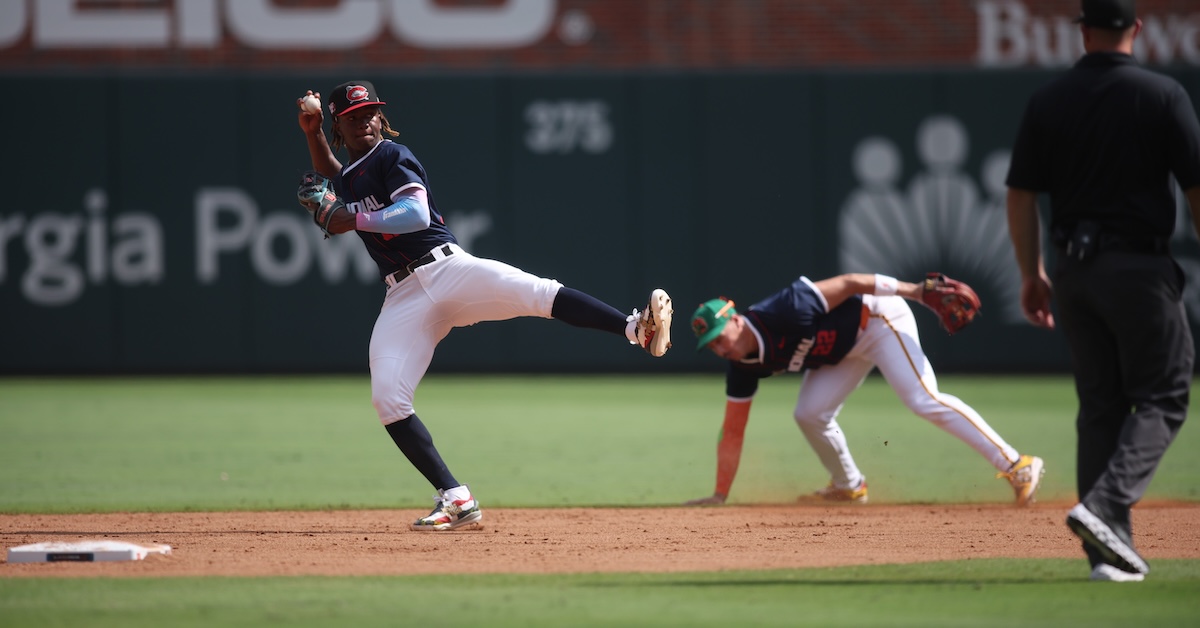
The 2025 White Sox performed the very weird dual feat of being one of baseball’s most improved teams compared to 2024 and losing more than a 100 games. There wasn’t much in the way of quality baseball on the South Side, but the Sox actually had enough things go their way this time around that they didn’t perform at the low end of their talent level. There were even a few things to like about the team, enough to motivate fans to turn on a game out of more than morbid curiosity.
One thing you’ll notice when looking at the depth chart below? No negative numbers! That’s a pretty low baseline, but the Sox have added enough talent that they’re clearly better than any of the teams in the International League. There are still questions about Colson Montgomery, and he likely won’t ever be a favorite to put up a good batting average or on-base percentage, but his power arrived and he can credibly play shortstop. The power has most certainly not arrived for Chase Meidroth, but he’s shown he can hack it at second base, he’s fairly disciplined at the plate, and he’s a pretty solid contact hitter. He doesn’t have a lot of star potential, but if the batting average creeps up a bit, he can be a useful OBP-heavy second baseman.
The White Sox haven’t figured out their catcher spot yet, but Kyle Teel probably has the best average outlook and the highest upside, so hopefully he’ll be given every chance to push out the competition and seize control of the job. Surprisingly, ZiPS thinks Luis Robert Jr. still has a decent amount of upside left, and the Sox might as well play him and see, since I don’t believe any team is going to be willing to pay the Pale Hose what they’d want to part with him. Miguel Vargas is fine as a stopgap third baseman, and he showed that many analysts had given up on his bat too quickly, but he’s still too much of a tweener: not good enough defensively to be plus at third, and not really interesting as a hitter if used at first base or designated hitter.
Of all the left-fielders in baseball, Andrew Benintendi is one of them. Lenyn Sosa will mostly play first base since the White Sox don’t have an obvious place to play him otherwise and he kinda hits, and right field and DH will largely be populated by whoever’s hanging around on the roster and isn’t starting elsewhere.
This offense will almost certainly be one of the worst in baseball in 2026, but I’d much rather watch this group than the one the team had entering 2024.
Pitchers
Chicago’s pitching staff was actually kinda adequate-ish in 2025, enough so that they mostly kept the games interesting. Shane Smith won’t make anyone forget Garrett Crochet, but he took a big step forward this season, and the team ought to be able to just stick him in the rotation and watch him pitch like a reasonable no. 2 starter. (I will note that there’s a bit of a disagreement between ZiPS and Steamer on Smith, with ZiPS the sunnier projection.)
Noah Schultz’s outlook has come down quite a bit in the projections thanks to some walk issues that popped up this year. In his first stint with Double-A Birmingham in 2024, he never allowed more than two walks in an outing, but he did that in seven different starts this year in his second Double-A go-around. He had mixed results after getting promoted to Triple-A Charlotte, but his time there was plagued by tendinitis in his knee. Still, Schultz only turned 22 a few months ago, so it’s too early to panic about his projection.
The rotation is basically no. 4/5 starters as far as the eye can see: If you couldn’t see the names on the projections for Davis Martin, Sean Burke, Jonathan Cannon, and Duncan Davitt, you probably wouldn’t be able to guess who is who. But on the plus side, the Sox are deep with these kinds of pitchers, and if a couple of them can have Smith-sized breakouts, the rotation might start to come together for the next few years. Hopefully the team is patient with Schultz and Hagen Smith, as neither of them is likely to be successful in the majors right away.
In terms of the bullpen, ZiPS is easily the most intrigued by Grant Taylor and would like to see him eventually get a chance at starting. But he ought to be fine in the ‘pen, and Jordan Leasure, Mike Vasil, and Brandon Eisert are an unexciting trio, but at least the games will end. The projections aren’t great, but for my part, I’m probably the most interested in seeing a healthy Prelander Berroa, as I still think that he’s one of the more interesting arms in the org.
The White Sox might keep their losses in the 90s in 2026, but I’d probably place the likelihood of a Cinderella season as being far lower for them than a lot of teams in that tier, such as the Nationals. While it’s not the kind of thing you actually want to say in a press release, I hope the Sox aren’t too obsessed with the exact number of wins they get next season, and focus on making their team a long-term contender instead of, say, pushing for .500 in 2026. We’ll see.
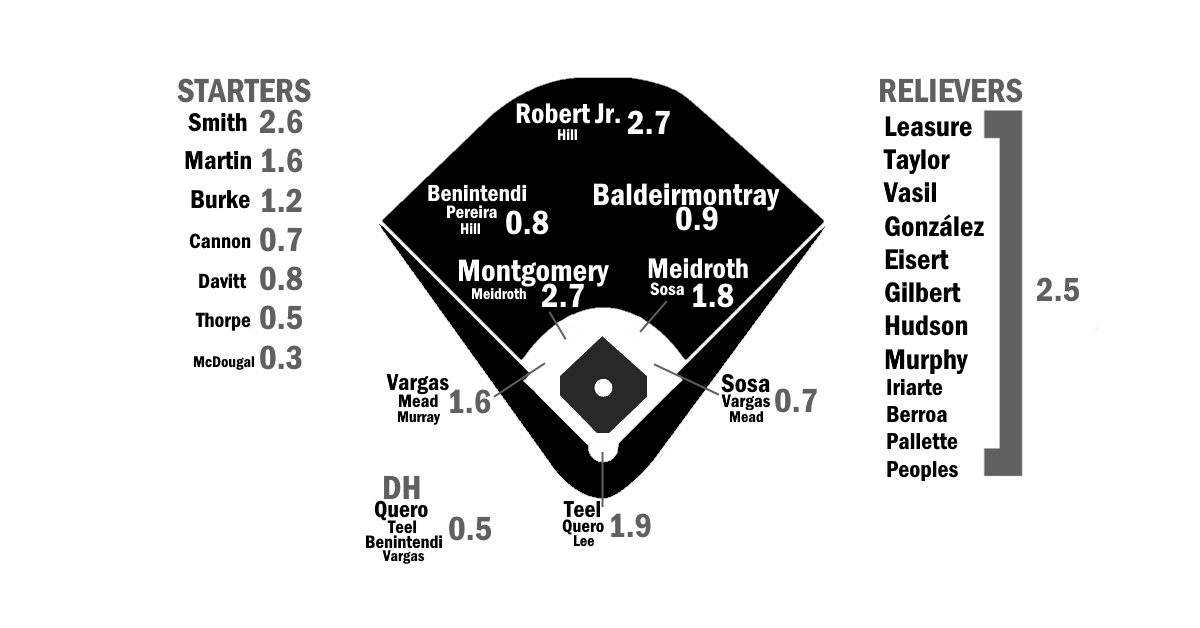
Ballpark graphic courtesy Eephus League. Depth charts constructed by way of those listed here. Size of player names is very roughly proportional to Depth Chart playing time. The final team projections may differ considerably from our Depth Chart playing time.
Batters – Standard
| Player |
B |
Age |
PO |
PA |
AB |
R |
H |
2B |
3B |
HR |
RBI |
BB |
SO |
SB |
CS |
| Kyle Teel |
L |
24 |
C |
506 |
445 |
64 |
110 |
18 |
1 |
12 |
55 |
54 |
128 |
7 |
2 |
| Colson Montgomery |
L |
24 |
SS |
527 |
473 |
63 |
102 |
17 |
3 |
23 |
83 |
43 |
159 |
2 |
1 |
| Luis Robert Jr. |
R |
28 |
CF |
470 |
428 |
59 |
101 |
19 |
0 |
18 |
62 |
35 |
124 |
24 |
6 |
| Sam Antonacci |
L |
23 |
2B |
514 |
431 |
66 |
106 |
18 |
5 |
4 |
60 |
46 |
87 |
21 |
6 |
| Chase Meidroth |
R |
24 |
SS |
547 |
473 |
66 |
115 |
16 |
1 |
7 |
45 |
60 |
83 |
12 |
4 |
| Miguel Vargas |
R |
26 |
3B |
551 |
480 |
76 |
113 |
27 |
2 |
16 |
60 |
60 |
100 |
7 |
2 |
| Curtis Mead |
R |
25 |
3B |
426 |
383 |
47 |
94 |
18 |
1 |
9 |
44 |
29 |
86 |
6 |
2 |
| Vinny Capra |
R |
29 |
3B |
344 |
308 |
38 |
71 |
13 |
1 |
5 |
31 |
28 |
71 |
6 |
1 |
| Dominic Fletcher |
L |
28 |
CF |
452 |
414 |
49 |
96 |
18 |
3 |
9 |
49 |
27 |
96 |
4 |
3 |
| Everson Pereira |
R |
25 |
CF |
424 |
381 |
62 |
89 |
13 |
2 |
16 |
50 |
35 |
136 |
9 |
3 |
| Derek Hill |
R |
30 |
CF |
332 |
301 |
42 |
70 |
11 |
2 |
8 |
35 |
21 |
94 |
11 |
2 |
| Tanner Murray |
R |
26 |
3B |
501 |
469 |
54 |
110 |
23 |
1 |
10 |
52 |
24 |
116 |
2 |
2 |
| Edgar Quero |
B |
23 |
C |
462 |
412 |
39 |
101 |
16 |
0 |
8 |
48 |
40 |
84 |
0 |
1 |
| William Bergolla |
L |
21 |
SS |
537 |
477 |
63 |
121 |
16 |
3 |
1 |
41 |
26 |
37 |
21 |
7 |
| Mike Tauchman |
L |
35 |
RF |
387 |
335 |
49 |
78 |
14 |
1 |
9 |
36 |
46 |
90 |
3 |
1 |
| Brooks Baldwin |
B |
25 |
LF |
463 |
423 |
53 |
106 |
18 |
2 |
15 |
58 |
31 |
103 |
9 |
3 |
| Braden Montgomery |
B |
23 |
CF |
538 |
489 |
55 |
114 |
30 |
3 |
11 |
60 |
39 |
163 |
7 |
4 |
| Zach DeLoach |
L |
27 |
RF |
444 |
398 |
53 |
90 |
17 |
2 |
8 |
45 |
40 |
129 |
7 |
3 |
| Michael A. Taylor |
R |
35 |
CF |
329 |
296 |
36 |
61 |
11 |
1 |
9 |
31 |
25 |
110 |
9 |
2 |
| Jackson Appel |
B |
24 |
C |
326 |
280 |
36 |
59 |
11 |
1 |
2 |
28 |
33 |
65 |
5 |
1 |
| Lenyn Sosa |
R |
26 |
2B |
526 |
496 |
53 |
123 |
20 |
1 |
18 |
68 |
22 |
116 |
2 |
2 |
| Jacob Amaya |
R |
27 |
SS |
417 |
372 |
45 |
77 |
12 |
1 |
8 |
38 |
38 |
109 |
5 |
2 |
| Josh Rojas |
L |
32 |
3B |
358 |
318 |
39 |
72 |
15 |
1 |
6 |
29 |
34 |
77 |
9 |
2 |
| Jeral Perez |
R |
21 |
2B |
549 |
505 |
57 |
108 |
21 |
2 |
17 |
64 |
34 |
143 |
5 |
2 |
| Ben Cowles |
R |
26 |
SS |
490 |
447 |
52 |
99 |
20 |
2 |
8 |
44 |
32 |
154 |
11 |
5 |
| Corey Julks |
R |
30 |
LF |
453 |
412 |
57 |
98 |
20 |
1 |
10 |
48 |
36 |
105 |
11 |
2 |
| Tim Elko |
R |
27 |
1B |
510 |
475 |
55 |
111 |
18 |
1 |
18 |
67 |
29 |
174 |
2 |
0 |
| Nick Maton |
L |
29 |
2B |
347 |
300 |
37 |
62 |
12 |
1 |
10 |
37 |
39 |
92 |
1 |
2 |
| Andrew Benintendi |
L |
31 |
LF |
492 |
444 |
55 |
110 |
18 |
1 |
15 |
59 |
42 |
84 |
3 |
1 |
| Andre Lipcius |
R |
28 |
1B |
484 |
436 |
51 |
99 |
17 |
1 |
13 |
56 |
40 |
104 |
3 |
2 |
| Korey Lee |
R |
27 |
C |
354 |
333 |
41 |
74 |
14 |
1 |
9 |
38 |
19 |
95 |
5 |
2 |
| Bryan Ramos |
R |
24 |
3B |
464 |
420 |
50 |
86 |
15 |
1 |
12 |
53 |
32 |
111 |
6 |
3 |
| Weston Eberly |
R |
25 |
C |
104 |
90 |
7 |
13 |
2 |
0 |
1 |
8 |
8 |
35 |
1 |
0 |
| Rikuu Nishida |
L |
25 |
RF |
513 |
441 |
68 |
103 |
9 |
2 |
0 |
40 |
50 |
78 |
20 |
8 |
| Joshua Palacios |
L |
30 |
RF |
319 |
286 |
34 |
66 |
11 |
1 |
8 |
35 |
25 |
70 |
5 |
3 |
| Caleb Bonemer |
R |
20 |
SS |
500 |
439 |
66 |
85 |
17 |
2 |
9 |
50 |
50 |
131 |
13 |
5 |
| Blake Sabol |
L |
28 |
C |
352 |
312 |
35 |
65 |
12 |
1 |
8 |
36 |
31 |
108 |
5 |
2 |
| Jason Matthews |
R |
29 |
3B |
337 |
296 |
35 |
53 |
7 |
1 |
3 |
26 |
27 |
109 |
4 |
2 |
| Nick Podkul |
R |
29 |
1B |
233 |
203 |
23 |
38 |
5 |
1 |
5 |
23 |
25 |
79 |
1 |
0 |
| Michael Turner |
L |
27 |
C |
306 |
273 |
23 |
57 |
13 |
0 |
1 |
23 |
29 |
77 |
1 |
0 |
| Kenedy Corona |
R |
26 |
C |
308 |
282 |
25 |
56 |
10 |
0 |
4 |
27 |
20 |
99 |
3 |
1 |
| Ryan Galanie |
R |
26 |
1B |
474 |
433 |
49 |
101 |
17 |
3 |
12 |
56 |
27 |
98 |
6 |
2 |
| Matt Hogan |
L |
26 |
CF |
266 |
231 |
23 |
42 |
8 |
3 |
3 |
25 |
25 |
109 |
6 |
3 |
| Terrell Tatum |
L |
26 |
LF |
421 |
370 |
47 |
72 |
14 |
2 |
4 |
33 |
42 |
144 |
19 |
4 |
| Mario Camilletti |
L |
27 |
3B |
406 |
354 |
36 |
72 |
10 |
1 |
3 |
30 |
44 |
100 |
3 |
1 |
| Dru Baker |
R |
26 |
CF |
424 |
389 |
45 |
92 |
10 |
2 |
4 |
38 |
26 |
116 |
17 |
6 |
| Jacob Gonzalez |
L |
24 |
2B |
527 |
483 |
47 |
105 |
20 |
2 |
8 |
53 |
30 |
92 |
8 |
2 |
| Calvin Harris |
L |
24 |
C |
325 |
300 |
34 |
62 |
8 |
2 |
2 |
25 |
21 |
90 |
2 |
1 |
| Colby Smelley |
R |
26 |
C |
230 |
208 |
16 |
44 |
7 |
1 |
1 |
20 |
15 |
62 |
0 |
0 |
| Jacob Burke |
R |
25 |
CF |
317 |
285 |
32 |
58 |
10 |
1 |
3 |
30 |
19 |
85 |
9 |
4 |
| Luis Pineda |
R |
24 |
C |
218 |
207 |
18 |
40 |
6 |
0 |
4 |
21 |
9 |
81 |
0 |
1 |
| Wilber Sanchez |
R |
24 |
SS |
272 |
248 |
24 |
43 |
7 |
1 |
3 |
20 |
19 |
85 |
8 |
4 |
| T.J. McCants |
L |
25 |
LF |
273 |
250 |
28 |
51 |
8 |
3 |
4 |
26 |
18 |
102 |
10 |
6 |
| Samuel Zavala |
L |
21 |
CF |
505 |
447 |
53 |
89 |
15 |
1 |
8 |
45 |
48 |
130 |
8 |
4 |
| Wilfred Veras |
R |
23 |
RF |
520 |
485 |
50 |
106 |
19 |
2 |
13 |
58 |
27 |
168 |
11 |
6 |
| Ryan Burrowes |
R |
21 |
2B |
431 |
389 |
51 |
79 |
11 |
2 |
5 |
39 |
27 |
143 |
19 |
3 |
| Jordan Sprinkle |
R |
25 |
2B |
390 |
341 |
39 |
66 |
9 |
1 |
1 |
27 |
31 |
95 |
23 |
4 |
| Caden Connor |
L |
25 |
LF |
514 |
464 |
49 |
106 |
17 |
1 |
7 |
49 |
40 |
99 |
5 |
2 |
| DJ Gladney |
R |
24 |
CF |
431 |
406 |
44 |
86 |
15 |
3 |
13 |
51 |
18 |
152 |
5 |
3 |
| Alec Makarewicz |
B |
25 |
1B |
447 |
416 |
40 |
84 |
16 |
4 |
9 |
42 |
26 |
147 |
4 |
0 |
| Drake Logan |
R |
25 |
RF |
319 |
294 |
34 |
60 |
8 |
1 |
5 |
32 |
19 |
147 |
10 |
3 |
| Miguel Santos |
R |
25 |
2B |
327 |
298 |
23 |
60 |
7 |
2 |
3 |
28 |
18 |
73 |
5 |
2 |
| Wes Kath |
L |
23 |
1B |
356 |
327 |
33 |
59 |
12 |
1 |
7 |
34 |
21 |
159 |
2 |
1 |
| Shawn Goosenberg |
R |
26 |
LF |
374 |
346 |
39 |
73 |
15 |
2 |
6 |
38 |
21 |
119 |
11 |
3 |
| Bryce Willits |
L |
26 |
3B |
356 |
324 |
30 |
65 |
10 |
1 |
3 |
28 |
27 |
86 |
3 |
2 |
| Lyle Miller-Green |
R |
25 |
1B |
392 |
344 |
45 |
64 |
11 |
3 |
8 |
38 |
38 |
148 |
4 |
2 |
| Arxy Hernandez |
R |
22 |
3B |
482 |
447 |
45 |
86 |
12 |
3 |
5 |
41 |
25 |
149 |
3 |
1 |
| Cole McConnell |
L |
25 |
LF |
376 |
338 |
35 |
63 |
11 |
0 |
4 |
32 |
29 |
139 |
2 |
4 |
Batters – Advanced
| Player |
PA |
BA |
OBP |
SLG |
OPS+ |
ISO |
BABIP |
Def |
WAR |
wOBA |
3YOPS+ |
RC |
| Kyle Teel |
506 |
.247 |
.333 |
.373 |
98 |
.126 |
.321 |
-1 |
2.3 |
.314 |
100 |
57 |
| Colson Montgomery |
527 |
.216 |
.292 |
.410 |
94 |
.195 |
.271 |
2 |
2.2 |
.305 |
96 |
58 |
| Luis Robert Jr. |
470 |
.236 |
.300 |
.407 |
96 |
.171 |
.290 |
4 |
2.1 |
.305 |
97 |
60 |
| Sam Antonacci |
514 |
.246 |
.354 |
.339 |
96 |
.093 |
.300 |
-1 |
2.1 |
.315 |
96 |
58 |
| Chase Meidroth |
547 |
.243 |
.339 |
.326 |
89 |
.082 |
.282 |
-3 |
1.7 |
.302 |
89 |
56 |
| Miguel Vargas |
551 |
.235 |
.325 |
.400 |
102 |
.165 |
.266 |
-7 |
1.5 |
.318 |
103 |
65 |
| Curtis Mead |
426 |
.245 |
.315 |
.368 |
91 |
.123 |
.295 |
0 |
1.1 |
.302 |
90 |
46 |
| Vinny Capra |
344 |
.231 |
.301 |
.328 |
77 |
.097 |
.284 |
7 |
1.1 |
.281 |
78 |
32 |
| Dominic Fletcher |
452 |
.232 |
.287 |
.355 |
79 |
.123 |
.282 |
6 |
1.0 |
.282 |
79 |
44 |
| Everson Pereira |
424 |
.234 |
.307 |
.404 |
98 |
.171 |
.319 |
-5 |
1.0 |
.311 |
100 |
50 |
| Derek Hill |
332 |
.233 |
.290 |
.362 |
82 |
.130 |
.312 |
3 |
1.0 |
.286 |
79 |
35 |
| Tanner Murray |
501 |
.235 |
.278 |
.352 |
75 |
.117 |
.292 |
7 |
0.9 |
.276 |
77 |
47 |
| Edgar Quero |
462 |
.245 |
.318 |
.342 |
86 |
.097 |
.291 |
-5 |
0.9 |
.295 |
87 |
45 |
| William Bergolla |
537 |
.254 |
.296 |
.306 |
70 |
.052 |
.273 |
3 |
0.8 |
.268 |
70 |
50 |
| Mike Tauchman |
387 |
.233 |
.331 |
.361 |
95 |
.128 |
.292 |
1 |
0.8 |
.308 |
88 |
41 |
| Brooks Baldwin |
463 |
.251 |
.303 |
.409 |
98 |
.158 |
.298 |
-1 |
0.7 |
.309 |
102 |
56 |
| Braden Montgomery |
538 |
.233 |
.297 |
.374 |
87 |
.141 |
.327 |
-4 |
0.6 |
.294 |
91 |
58 |
| Zach DeLoach |
444 |
.226 |
.300 |
.339 |
79 |
.113 |
.314 |
7 |
0.5 |
.284 |
81 |
43 |
| Michael A. Taylor |
329 |
.206 |
.271 |
.341 |
71 |
.135 |
.294 |
4 |
0.5 |
.270 |
64 |
30 |
| Jackson Appel |
326 |
.211 |
.309 |
.279 |
67 |
.068 |
.268 |
1 |
0.5 |
.269 |
71 |
25 |
| Lenyn Sosa |
526 |
.248 |
.282 |
.401 |
89 |
.153 |
.290 |
-7 |
0.5 |
.295 |
89 |
57 |
| Jacob Amaya |
417 |
.207 |
.281 |
.309 |
66 |
.102 |
.271 |
2 |
0.4 |
.264 |
68 |
34 |
| Josh Rojas |
358 |
.226 |
.301 |
.336 |
79 |
.110 |
.281 |
0 |
0.4 |
.282 |
74 |
35 |
| Jeral Perez |
549 |
.214 |
.271 |
.364 |
76 |
.150 |
.264 |
-1 |
0.4 |
.278 |
83 |
52 |
| Ben Cowles |
490 |
.221 |
.282 |
.329 |
71 |
.107 |
.319 |
-1 |
0.3 |
.271 |
73 |
46 |
| Corey Julks |
453 |
.238 |
.302 |
.364 |
86 |
.126 |
.296 |
0 |
0.3 |
.293 |
85 |
48 |
| Tim Elko |
510 |
.234 |
.282 |
.389 |
86 |
.156 |
.329 |
2 |
0.2 |
.292 |
88 |
53 |
| Nick Maton |
347 |
.207 |
.306 |
.353 |
85 |
.147 |
.263 |
-5 |
0.2 |
.293 |
84 |
34 |
| Andrew Benintendi |
492 |
.248 |
.313 |
.394 |
97 |
.146 |
.275 |
-6 |
0.1 |
.308 |
96 |
56 |
| Andre Lipcius |
484 |
.227 |
.295 |
.360 |
83 |
.133 |
.270 |
3 |
0.1 |
.289 |
85 |
48 |
| Korey Lee |
354 |
.222 |
.268 |
.351 |
72 |
.129 |
.284 |
-4 |
0.1 |
.272 |
73 |
33 |
| Bryan Ramos |
464 |
.205 |
.272 |
.331 |
68 |
.126 |
.249 |
2 |
0.0 |
.267 |
72 |
40 |
| Weston Eberly |
104 |
.144 |
.235 |
.200 |
24 |
.056 |
.222 |
4 |
0.0 |
.206 |
33 |
4 |
| Rikuu Nishida |
513 |
.234 |
.325 |
.263 |
69 |
.029 |
.284 |
6 |
0.0 |
.274 |
70 |
45 |
| Joshua Palacios |
319 |
.231 |
.303 |
.360 |
85 |
.129 |
.279 |
-1 |
0.0 |
.294 |
86 |
33 |
| Caleb Bonemer |
500 |
.194 |
.282 |
.303 |
65 |
.109 |
.254 |
-3 |
-0.1 |
.264 |
73 |
42 |
| Blake Sabol |
352 |
.208 |
.288 |
.330 |
73 |
.122 |
.291 |
-7 |
-0.1 |
.276 |
73 |
31 |
| Jason Matthews |
337 |
.179 |
.260 |
.240 |
42 |
.061 |
.272 |
9 |
-0.1 |
.231 |
42 |
20 |
| Nick Podkul |
233 |
.187 |
.292 |
.296 |
66 |
.108 |
.277 |
3 |
-0.2 |
.269 |
66 |
18 |
| Michael Turner |
306 |
.209 |
.288 |
.267 |
58 |
.059 |
.287 |
-2 |
-0.2 |
.254 |
58 |
21 |
| Kenedy Corona |
308 |
.199 |
.263 |
.277 |
52 |
.078 |
.291 |
1 |
-0.2 |
.244 |
53 |
22 |
| Ryan Galanie |
474 |
.233 |
.287 |
.370 |
83 |
.136 |
.276 |
0 |
-0.3 |
.286 |
83 |
48 |
| Matt Hogan |
266 |
.182 |
.277 |
.281 |
58 |
.100 |
.328 |
0 |
-0.3 |
.254 |
63 |
20 |
| Terrell Tatum |
421 |
.195 |
.283 |
.276 |
58 |
.081 |
.306 |
6 |
-0.3 |
.256 |
60 |
34 |
| Mario Camilletti |
406 |
.203 |
.295 |
.263 |
59 |
.059 |
.275 |
0 |
-0.4 |
.258 |
60 |
28 |
| Dru Baker |
424 |
.237 |
.292 |
.303 |
68 |
.067 |
.327 |
-4 |
-0.4 |
.267 |
71 |
40 |
| Jacob Gonzalez |
527 |
.217 |
.272 |
.317 |
65 |
.099 |
.253 |
-2 |
-0.4 |
.261 |
67 |
44 |
| Calvin Harris |
325 |
.207 |
.262 |
.267 |
49 |
.060 |
.288 |
0 |
-0.5 |
.238 |
54 |
22 |
| Colby Smelley |
230 |
.212 |
.279 |
.269 |
56 |
.058 |
.297 |
-4 |
-0.5 |
.250 |
60 |
16 |
| Jacob Burke |
317 |
.204 |
.273 |
.277 |
55 |
.074 |
.279 |
-1 |
-0.6 |
.250 |
59 |
25 |
| Luis Pineda |
218 |
.193 |
.229 |
.280 |
42 |
.087 |
.295 |
-1 |
-0.7 |
.225 |
50 |
14 |
| Wilber Sanchez |
272 |
.173 |
.240 |
.246 |
37 |
.073 |
.250 |
2 |
-0.7 |
.221 |
38 |
18 |
| T.J. McCants |
273 |
.204 |
.262 |
.308 |
60 |
.104 |
.326 |
1 |
-0.8 |
.251 |
63 |
25 |
| Samuel Zavala |
505 |
.199 |
.281 |
.291 |
62 |
.092 |
.262 |
-4 |
-0.8 |
.260 |
68 |
40 |
| Wilfred Veras |
520 |
.219 |
.263 |
.346 |
69 |
.128 |
.306 |
2 |
-0.8 |
.266 |
76 |
49 |
| Ryan Burrowes |
431 |
.203 |
.266 |
.280 |
54 |
.077 |
.307 |
-3 |
-0.9 |
.246 |
61 |
34 |
| Jordan Sprinkle |
390 |
.194 |
.269 |
.235 |
44 |
.041 |
.265 |
-1 |
-0.9 |
.233 |
48 |
28 |
| Caden Connor |
514 |
.228 |
.291 |
.315 |
70 |
.086 |
.277 |
-1 |
-0.9 |
.270 |
73 |
44 |
| DJ Gladney |
431 |
.212 |
.251 |
.360 |
69 |
.148 |
.303 |
-8 |
-1.0 |
.265 |
73 |
39 |
| Alec Makarewicz |
447 |
.202 |
.251 |
.325 |
60 |
.123 |
.288 |
4 |
-1.1 |
.252 |
64 |
35 |
| Drake Logan |
319 |
.204 |
.263 |
.289 |
55 |
.085 |
.387 |
-1 |
-1.1 |
.248 |
62 |
26 |
| Miguel Santos |
327 |
.201 |
.262 |
.268 |
50 |
.067 |
.257 |
-4 |
-1.1 |
.240 |
51 |
23 |
| Wes Kath |
356 |
.180 |
.242 |
.287 |
48 |
.107 |
.323 |
5 |
-1.1 |
.237 |
53 |
24 |
| Shawn Goosenberg |
374 |
.211 |
.265 |
.318 |
63 |
.107 |
.303 |
-3 |
-1.2 |
.258 |
66 |
33 |
| Bryce Willits |
356 |
.201 |
.265 |
.265 |
50 |
.065 |
.264 |
-2 |
-1.2 |
.240 |
54 |
24 |
| Lyle Miller-Green |
392 |
.186 |
.277 |
.305 |
64 |
.119 |
.298 |
-2 |
-1.3 |
.263 |
68 |
31 |
| Arxy Hernandez |
482 |
.192 |
.247 |
.266 |
44 |
.074 |
.276 |
1 |
-1.5 |
.231 |
50 |
30 |
| Cole McConnell |
376 |
.186 |
.266 |
.254 |
48 |
.068 |
.303 |
-2 |
-1.9 |
.240 |
53 |
25 |
Batters – Top Near-Age Offensive Comps
Batters – 80th/20th Percentiles
| Player |
80th BA |
80th OBP |
80th SLG |
80th OPS+ |
80th WAR |
20th BA |
20th OBP |
20th SLG |
20th OPS+ |
20th WAR |
| Kyle Teel |
.277 |
.361 |
.430 |
120 |
3.7 |
.220 |
.305 |
.330 |
79 |
1.2 |
| Colson Montgomery |
.244 |
.323 |
.467 |
117 |
3.7 |
.191 |
.266 |
.353 |
73 |
0.8 |
| Luis Robert Jr. |
.261 |
.324 |
.460 |
117 |
3.3 |
.210 |
.275 |
.361 |
78 |
1.0 |
| Sam Antonacci |
.274 |
.381 |
.377 |
113 |
3.1 |
.220 |
.328 |
.301 |
80 |
0.8 |
| Chase Meidroth |
.269 |
.366 |
.362 |
104 |
2.8 |
.215 |
.311 |
.293 |
72 |
0.5 |
| Miguel Vargas |
.259 |
.351 |
.453 |
122 |
2.9 |
.211 |
.305 |
.353 |
84 |
0.3 |
| Curtis Mead |
.270 |
.341 |
.415 |
110 |
2.1 |
.221 |
.292 |
.328 |
75 |
0.3 |
| Vinny Capra |
.254 |
.326 |
.366 |
95 |
1.9 |
.203 |
.276 |
.285 |
58 |
0.4 |
| Dominic Fletcher |
.253 |
.311 |
.399 |
96 |
2.0 |
.205 |
.260 |
.310 |
61 |
0.1 |
| Everson Pereira |
.260 |
.332 |
.466 |
119 |
2.1 |
.204 |
.274 |
.352 |
73 |
-0.2 |
| Derek Hill |
.267 |
.319 |
.420 |
105 |
1.9 |
.205 |
.258 |
.314 |
61 |
0.0 |
| Tanner Murray |
.257 |
.302 |
.396 |
92 |
1.9 |
.212 |
.258 |
.308 |
58 |
-0.1 |
| Edgar Quero |
.274 |
.344 |
.383 |
103 |
1.9 |
.216 |
.289 |
.298 |
68 |
-0.2 |
| William Bergolla |
.279 |
.324 |
.341 |
86 |
2.0 |
.221 |
.266 |
.270 |
50 |
-0.5 |
| Mike Tauchman |
.263 |
.358 |
.405 |
112 |
1.6 |
.205 |
.300 |
.315 |
74 |
-0.2 |
| Brooks Baldwin |
.275 |
.330 |
.460 |
117 |
1.9 |
.228 |
.281 |
.358 |
79 |
-0.3 |
| Braden Montgomery |
.256 |
.323 |
.417 |
105 |
1.8 |
.206 |
.269 |
.336 |
71 |
-0.5 |
| Zach DeLoach |
.250 |
.323 |
.384 |
96 |
1.4 |
.196 |
.267 |
.297 |
59 |
-0.6 |
| Michael A. Taylor |
.237 |
.300 |
.403 |
94 |
1.6 |
.176 |
.239 |
.288 |
48 |
-0.4 |
| Jackson Appel |
.236 |
.337 |
.317 |
86 |
1.3 |
.181 |
.283 |
.242 |
52 |
-0.2 |
| Lenyn Sosa |
.277 |
.308 |
.450 |
109 |
1.7 |
.228 |
.262 |
.355 |
73 |
-0.6 |
| Jacob Amaya |
.231 |
.306 |
.360 |
86 |
1.4 |
.178 |
.254 |
.268 |
47 |
-0.5 |
| Josh Rojas |
.253 |
.328 |
.378 |
96 |
1.2 |
.201 |
.276 |
.294 |
61 |
-0.3 |
| Jeral Perez |
.244 |
.303 |
.420 |
100 |
2.0 |
.188 |
.247 |
.317 |
58 |
-0.9 |
| Ben Cowles |
.248 |
.310 |
.377 |
92 |
1.6 |
.195 |
.254 |
.291 |
55 |
-0.6 |
| Corey Julks |
.266 |
.333 |
.411 |
105 |
1.3 |
.212 |
.273 |
.317 |
65 |
-0.9 |
| Tim Elko |
.259 |
.309 |
.444 |
108 |
1.5 |
.202 |
.254 |
.344 |
68 |
-1.0 |
| Nick Maton |
.232 |
.331 |
.406 |
101 |
0.9 |
.180 |
.279 |
.312 |
65 |
-0.7 |
| Andrew Benintendi |
.277 |
.337 |
.448 |
116 |
1.3 |
.224 |
.289 |
.347 |
78 |
-1.1 |
| Andre Lipcius |
.254 |
.321 |
.406 |
102 |
1.2 |
.200 |
.268 |
.314 |
64 |
-1.1 |
| Korey Lee |
.252 |
.300 |
.400 |
91 |
1.0 |
.194 |
.241 |
.303 |
51 |
-0.8 |
| Bryan Ramos |
.229 |
.295 |
.373 |
84 |
1.0 |
.181 |
.249 |
.292 |
53 |
-0.9 |
| Weston Eberly |
.174 |
.263 |
.236 |
41 |
0.3 |
.121 |
.210 |
.162 |
8 |
-0.2 |
| Rikuu Nishida |
.258 |
.351 |
.297 |
84 |
1.1 |
.208 |
.298 |
.232 |
54 |
-1.0 |
| Joshua Palacios |
.260 |
.335 |
.406 |
105 |
0.7 |
.204 |
.276 |
.310 |
65 |
-0.8 |
| Caleb Bonemer |
.220 |
.309 |
.355 |
87 |
1.3 |
.166 |
.255 |
.262 |
47 |
-1.3 |
| Blake Sabol |
.239 |
.319 |
.376 |
92 |
0.7 |
.182 |
.259 |
.286 |
53 |
-1.0 |
| Jason Matthews |
.203 |
.289 |
.278 |
57 |
0.5 |
.155 |
.233 |
.208 |
26 |
-0.9 |
| Nick Podkul |
.212 |
.321 |
.340 |
84 |
0.4 |
.161 |
.260 |
.250 |
46 |
-0.8 |
| Michael Turner |
.238 |
.321 |
.308 |
78 |
0.6 |
.177 |
.256 |
.224 |
38 |
-0.9 |
| Kenedy Corona |
.226 |
.295 |
.312 |
70 |
0.5 |
.167 |
.235 |
.237 |
34 |
-0.9 |
| Ryan Galanie |
.255 |
.311 |
.418 |
100 |
0.7 |
.208 |
.264 |
.330 |
66 |
-1.3 |
| Matt Hogan |
.210 |
.306 |
.330 |
77 |
0.3 |
.151 |
.248 |
.235 |
37 |
-1.0 |
| Terrell Tatum |
.224 |
.310 |
.316 |
76 |
0.7 |
.169 |
.254 |
.238 |
42 |
-1.3 |
| Mario Camilletti |
.229 |
.321 |
.296 |
75 |
0.4 |
.174 |
.266 |
.227 |
42 |
-1.2 |
| Dru Baker |
.265 |
.322 |
.340 |
86 |
0.6 |
.207 |
.264 |
.266 |
50 |
-1.3 |
| Jacob Gonzalez |
.246 |
.300 |
.359 |
81 |
0.7 |
.191 |
.246 |
.274 |
46 |
-1.7 |
| Calvin Harris |
.235 |
.289 |
.308 |
67 |
0.3 |
.174 |
.230 |
.225 |
30 |
-1.3 |
| Colby Smelley |
.242 |
.312 |
.316 |
77 |
0.1 |
.176 |
.249 |
.226 |
35 |
-1.1 |
| Jacob Burke |
.234 |
.302 |
.318 |
74 |
0.2 |
.178 |
.249 |
.246 |
41 |
-1.2 |
| Luis Pineda |
.220 |
.258 |
.321 |
60 |
-0.2 |
.163 |
.200 |
.234 |
21 |
-1.3 |
| Wilber Sanchez |
.199 |
.265 |
.285 |
54 |
-0.2 |
.148 |
.213 |
.212 |
22 |
-1.3 |
| T.J. McCants |
.232 |
.289 |
.356 |
80 |
-0.1 |
.178 |
.232 |
.268 |
42 |
-1.5 |
| Samuel Zavala |
.226 |
.305 |
.333 |
77 |
0.2 |
.173 |
.253 |
.250 |
43 |
-1.9 |
| Wilfred Veras |
.244 |
.288 |
.393 |
88 |
0.4 |
.194 |
.239 |
.306 |
52 |
-2.0 |
| Ryan Burrowes |
.229 |
.293 |
.316 |
70 |
0.0 |
.176 |
.240 |
.241 |
36 |
-1.8 |
| Jordan Sprinkle |
.217 |
.295 |
.264 |
59 |
-0.1 |
.169 |
.246 |
.208 |
31 |
-1.6 |
| Caden Connor |
.255 |
.319 |
.357 |
89 |
0.2 |
.206 |
.265 |
.280 |
56 |
-2.0 |
| DJ Gladney |
.239 |
.282 |
.412 |
89 |
0.1 |
.185 |
.226 |
.318 |
51 |
-2.0 |
| Alec Makarewicz |
.231 |
.279 |
.368 |
80 |
0.0 |
.181 |
.228 |
.280 |
43 |
-2.0 |
| Drake Logan |
.236 |
.289 |
.341 |
75 |
-0.3 |
.170 |
.228 |
.239 |
33 |
-2.0 |
| Miguel Santos |
.225 |
.288 |
.301 |
64 |
-0.5 |
.173 |
.235 |
.234 |
33 |
-1.8 |
| Wes Kath |
.209 |
.270 |
.336 |
68 |
-0.2 |
.151 |
.213 |
.239 |
29 |
-2.1 |
| Shawn Goosenberg |
.238 |
.293 |
.363 |
82 |
-0.2 |
.186 |
.239 |
.283 |
47 |
-1.9 |
| Bryce Willits |
.227 |
.294 |
.303 |
65 |
-0.5 |
.171 |
.240 |
.229 |
33 |
-1.9 |
| Lyle Miller-Green |
.214 |
.303 |
.351 |
81 |
-0.4 |
.162 |
.251 |
.265 |
45 |
-2.1 |
| Arxy Hernandez |
.219 |
.271 |
.303 |
60 |
-0.5 |
.164 |
.219 |
.232 |
28 |
-2.5 |
| Cole McConnell |
.215 |
.294 |
.293 |
65 |
-1.0 |
.160 |
.240 |
.219 |
31 |
-2.6 |
Batters – Platoon Splits
| Player |
BA vs. L |
OBP vs. L |
SLG vs. L |
BA vs. R |
OBP vs. R |
SLG vs. R |
| Kyle Teel |
.243 |
.318 |
.357 |
.248 |
.338 |
.379 |
| Colson Montgomery |
.217 |
.289 |
.385 |
.215 |
.293 |
.421 |
| Luis Robert Jr. |
.246 |
.315 |
.421 |
.232 |
.294 |
.401 |
| Sam Antonacci |
.235 |
.348 |
.311 |
.250 |
.356 |
.349 |
| Chase Meidroth |
.246 |
.344 |
.326 |
.242 |
.338 |
.325 |
| Miguel Vargas |
.244 |
.338 |
.420 |
.230 |
.317 |
.388 |
| Curtis Mead |
.252 |
.321 |
.385 |
.242 |
.311 |
.358 |
| Vinny Capra |
.243 |
.317 |
.346 |
.224 |
.293 |
.318 |
| Dominic Fletcher |
.222 |
.276 |
.319 |
.237 |
.293 |
.374 |
| Everson Pereira |
.240 |
.321 |
.421 |
.231 |
.300 |
.396 |
| Derek Hill |
.238 |
.296 |
.381 |
.230 |
.286 |
.352 |
| Tanner Murray |
.241 |
.285 |
.362 |
.232 |
.275 |
.348 |
| Edgar Quero |
.259 |
.329 |
.367 |
.238 |
.313 |
.330 |
| William Bergolla |
.248 |
.294 |
.291 |
.256 |
.297 |
.311 |
| Mike Tauchman |
.230 |
.320 |
.345 |
.234 |
.334 |
.367 |
| Brooks Baldwin |
.252 |
.304 |
.400 |
.250 |
.303 |
.412 |
| Braden Montgomery |
.233 |
.294 |
.390 |
.233 |
.299 |
.367 |
| Zach DeLoach |
.218 |
.287 |
.338 |
.230 |
.307 |
.340 |
| Michael A. Taylor |
.217 |
.277 |
.359 |
.201 |
.268 |
.333 |
| Jackson Appel |
.217 |
.305 |
.289 |
.208 |
.310 |
.274 |
| Lenyn Sosa |
.256 |
.294 |
.420 |
.244 |
.276 |
.391 |
| Jacob Amaya |
.210 |
.295 |
.312 |
.205 |
.273 |
.308 |
| Josh Rojas |
.213 |
.281 |
.288 |
.231 |
.307 |
.353 |
| Jeral Perez |
.213 |
.274 |
.367 |
.214 |
.270 |
.363 |
| Ben Cowles |
.228 |
.289 |
.360 |
.219 |
.279 |
.315 |
| Corey Julks |
.245 |
.313 |
.381 |
.234 |
.297 |
.355 |
| Tim Elko |
.226 |
.281 |
.387 |
.236 |
.283 |
.390 |
| Nick Maton |
.200 |
.296 |
.306 |
.209 |
.310 |
.372 |
| Andrew Benintendi |
.243 |
.307 |
.357 |
.249 |
.315 |
.407 |
| Andre Lipcius |
.236 |
.306 |
.361 |
.223 |
.290 |
.360 |
| Korey Lee |
.228 |
.286 |
.366 |
.219 |
.258 |
.343 |
| Bryan Ramos |
.213 |
.282 |
.333 |
.201 |
.267 |
.330 |
| Weston Eberly |
.138 |
.242 |
.172 |
.148 |
.232 |
.213 |
| Rikuu Nishida |
.226 |
.317 |
.264 |
.236 |
.327 |
.263 |
| Joshua Palacios |
.226 |
.301 |
.333 |
.233 |
.304 |
.371 |
| Caleb Bonemer |
.197 |
.291 |
.321 |
.192 |
.278 |
.295 |
| Blake Sabol |
.198 |
.275 |
.297 |
.213 |
.293 |
.344 |
| Jason Matthews |
.180 |
.267 |
.236 |
.179 |
.257 |
.242 |
| Nick Podkul |
.194 |
.301 |
.306 |
.183 |
.287 |
.290 |
| Michael Turner |
.203 |
.282 |
.250 |
.211 |
.289 |
.273 |
| Kenedy Corona |
.209 |
.273 |
.275 |
.194 |
.258 |
.277 |
| Ryan Galanie |
.231 |
.286 |
.364 |
.234 |
.287 |
.372 |
| Matt Hogan |
.164 |
.257 |
.279 |
.188 |
.284 |
.282 |
| Terrell Tatum |
.186 |
.269 |
.247 |
.198 |
.288 |
.286 |
| Mario Camilletti |
.180 |
.270 |
.236 |
.211 |
.304 |
.272 |
| Dru Baker |
.241 |
.298 |
.313 |
.235 |
.290 |
.300 |
| Jacob Gonzalez |
.208 |
.265 |
.288 |
.221 |
.274 |
.327 |
| Calvin Harris |
.195 |
.250 |
.221 |
.211 |
.266 |
.283 |
| Colby Smelley |
.212 |
.278 |
.242 |
.211 |
.280 |
.282 |
| Jacob Burke |
.203 |
.273 |
.278 |
.204 |
.273 |
.277 |
| Luis Pineda |
.206 |
.242 |
.286 |
.188 |
.224 |
.278 |
| Wilber Sanchez |
.182 |
.259 |
.247 |
.170 |
.231 |
.246 |
| T.J. McCants |
.191 |
.247 |
.294 |
.209 |
.268 |
.313 |
| Samuel Zavala |
.194 |
.273 |
.274 |
.201 |
.285 |
.297 |
| Wilfred Veras |
.222 |
.274 |
.363 |
.217 |
.259 |
.340 |
| Ryan Burrowes |
.207 |
.270 |
.306 |
.201 |
.265 |
.270 |
| Jordan Sprinkle |
.194 |
.273 |
.224 |
.193 |
.268 |
.239 |
| Caden Connor |
.216 |
.276 |
.276 |
.233 |
.296 |
.328 |
| DJ Gladney |
.213 |
.254 |
.369 |
.211 |
.250 |
.356 |
| Alec Makarewicz |
.198 |
.246 |
.322 |
.203 |
.252 |
.325 |
| Drake Logan |
.207 |
.270 |
.305 |
.203 |
.261 |
.283 |
| Miguel Santos |
.200 |
.267 |
.274 |
.202 |
.259 |
.266 |
| Wes Kath |
.172 |
.234 |
.276 |
.183 |
.245 |
.292 |
| Shawn Goosenberg |
.219 |
.276 |
.344 |
.208 |
.260 |
.308 |
| Bryce Willits |
.195 |
.258 |
.256 |
.202 |
.267 |
.269 |
| Lyle Miller-Green |
.194 |
.285 |
.333 |
.182 |
.273 |
.292 |
| Arxy Hernandez |
.192 |
.248 |
.285 |
.192 |
.246 |
.259 |
| Cole McConnell |
.172 |
.260 |
.237 |
.192 |
.268 |
.261 |
Pitchers – Standard
| Player |
T |
Age |
W |
L |
ERA |
G |
GS |
IP |
H |
ER |
HR |
BB |
SO |
| Shane Smith |
R |
26 |
7 |
8 |
3.98 |
28 |
28 |
144.7 |
122 |
64 |
17 |
53 |
140 |
| Davis Martin |
R |
29 |
6 |
8 |
4.44 |
25 |
24 |
123.7 |
123 |
61 |
16 |
41 |
97 |
| Martín Pérez |
L |
35 |
5 |
6 |
4.46 |
22 |
19 |
107.0 |
111 |
53 |
13 |
41 |
80 |
| Mike Vasil |
R |
26 |
5 |
5 |
4.23 |
37 |
12 |
106.3 |
102 |
50 |
12 |
43 |
86 |
| Grant Taylor |
R |
24 |
3 |
3 |
3.58 |
45 |
8 |
55.3 |
48 |
22 |
5 |
18 |
60 |
| Sean Burke |
R |
26 |
6 |
9 |
4.66 |
27 |
22 |
123.7 |
117 |
64 |
19 |
55 |
121 |
| Duncan Davitt |
R |
26 |
5 |
9 |
4.82 |
25 |
23 |
125.0 |
130 |
67 |
18 |
38 |
95 |
| Jonathan Cannon |
R |
25 |
6 |
11 |
4.85 |
27 |
23 |
130.0 |
136 |
70 |
19 |
45 |
97 |
| Riley Gowens |
R |
26 |
4 |
8 |
4.89 |
23 |
23 |
110.3 |
111 |
60 |
18 |
41 |
98 |
| Shane Murphy |
L |
25 |
4 |
8 |
4.85 |
23 |
19 |
104.0 |
115 |
56 |
18 |
23 |
68 |
| Noah Schultz |
L |
22 |
4 |
5 |
4.79 |
21 |
21 |
88.3 |
86 |
47 |
11 |
40 |
77 |
| Hagen Smith |
L |
22 |
3 |
5 |
4.88 |
25 |
25 |
90.3 |
81 |
49 |
12 |
44 |
86 |
| Tanner McDougal |
R |
23 |
3 |
5 |
4.93 |
26 |
26 |
100.3 |
100 |
55 |
14 |
47 |
88 |
| Drew Thorpe |
R |
25 |
4 |
6 |
4.86 |
15 |
15 |
76.0 |
79 |
41 |
12 |
27 |
57 |
| Bryse Wilson |
R |
28 |
4 |
5 |
4.75 |
35 |
12 |
94.7 |
101 |
50 |
14 |
28 |
65 |
| Tyler Schweitzer |
L |
25 |
4 |
7 |
4.95 |
24 |
14 |
96.3 |
103 |
53 |
14 |
36 |
68 |
| Mike Clevinger |
R |
35 |
4 |
7 |
4.96 |
25 |
20 |
94.3 |
99 |
52 |
15 |
37 |
72 |
| Chris Murphy |
L |
28 |
3 |
4 |
4.60 |
32 |
9 |
76.3 |
72 |
39 |
9 |
38 |
66 |
| Brandon Eisert |
L |
28 |
4 |
5 |
4.18 |
62 |
3 |
64.7 |
62 |
30 |
8 |
23 |
65 |
| Kyle Tyler |
R |
29 |
4 |
6 |
4.94 |
24 |
15 |
93.0 |
103 |
51 |
12 |
36 |
63 |
| Fraser Ellard |
L |
28 |
3 |
4 |
4.15 |
45 |
2 |
47.7 |
41 |
22 |
5 |
26 |
51 |
| Lucas Gordon |
L |
24 |
5 |
8 |
5.15 |
23 |
22 |
92.7 |
96 |
53 |
14 |
44 |
73 |
| Prelander Berroa |
R |
26 |
2 |
4 |
4.67 |
34 |
7 |
54.0 |
50 |
28 |
7 |
32 |
57 |
| Jake Palisch |
L |
27 |
4 |
5 |
4.89 |
29 |
10 |
81.0 |
92 |
44 |
12 |
23 |
46 |
| Ky Bush |
L |
26 |
3 |
6 |
5.10 |
15 |
15 |
72.3 |
78 |
41 |
10 |
33 |
50 |
| Jordan Leasure |
R |
27 |
4 |
5 |
4.34 |
58 |
1 |
56.0 |
47 |
27 |
8 |
25 |
65 |
| Connor McCullough |
R |
26 |
3 |
5 |
5.05 |
15 |
15 |
57.0 |
61 |
32 |
10 |
15 |
43 |
| Tyler Alexander |
L |
31 |
6 |
9 |
4.92 |
37 |
7 |
93.3 |
100 |
51 |
15 |
24 |
75 |
| Evan McKendry |
R |
28 |
4 |
8 |
5.19 |
22 |
13 |
85.0 |
93 |
49 |
13 |
21 |
52 |
| Owen White |
R |
26 |
3 |
5 |
5.22 |
22 |
15 |
81.0 |
87 |
47 |
11 |
36 |
57 |
| Ben Peoples |
R |
25 |
3 |
4 |
5.02 |
33 |
9 |
57.3 |
58 |
32 |
8 |
28 |
48 |
| Bryan Hudson |
L |
29 |
2 |
3 |
4.35 |
44 |
1 |
51.7 |
47 |
25 |
6 |
23 |
48 |
| Peyton Pallette |
R |
25 |
2 |
4 |
4.88 |
41 |
6 |
62.7 |
60 |
34 |
10 |
28 |
61 |
| Jairo Iriarte |
R |
24 |
3 |
6 |
5.17 |
29 |
13 |
76.7 |
75 |
44 |
10 |
41 |
66 |
| Elvis Peguero |
R |
29 |
3 |
4 |
4.50 |
44 |
1 |
46.0 |
45 |
23 |
4 |
22 |
38 |
| Tommy Vail |
L |
27 |
3 |
5 |
5.05 |
28 |
8 |
73.0 |
72 |
41 |
10 |
40 |
62 |
| Adisyn Coffey |
R |
27 |
3 |
5 |
4.59 |
42 |
1 |
51.0 |
49 |
26 |
7 |
22 |
49 |
| Tyler Gilbert |
L |
32 |
2 |
4 |
4.89 |
39 |
5 |
57.0 |
57 |
31 |
8 |
23 |
50 |
| Cam Booser |
L |
34 |
3 |
4 |
4.53 |
46 |
0 |
43.7 |
42 |
22 |
7 |
20 |
46 |
| Lane Ramsey |
R |
29 |
2 |
2 |
4.40 |
26 |
0 |
28.7 |
28 |
14 |
4 |
14 |
28 |
| James Karinchak |
R |
30 |
2 |
3 |
4.57 |
43 |
0 |
41.3 |
35 |
21 |
6 |
24 |
47 |
| Wikelman González |
R |
24 |
2 |
5 |
5.35 |
18 |
16 |
67.3 |
66 |
40 |
11 |
41 |
64 |
| Keone Kela |
R |
33 |
1 |
2 |
4.71 |
20 |
0 |
21.0 |
20 |
11 |
3 |
12 |
22 |
| Zach Franklin |
R |
27 |
2 |
4 |
4.60 |
43 |
0 |
47.0 |
43 |
24 |
6 |
20 |
47 |
| Garrett Schoenle |
L |
28 |
3 |
6 |
4.95 |
37 |
5 |
63.7 |
65 |
35 |
10 |
27 |
51 |
| Dylan Cumming |
R |
27 |
4 |
7 |
5.45 |
26 |
13 |
76.0 |
83 |
46 |
12 |
29 |
55 |
| Miguel Castro |
R |
31 |
2 |
3 |
4.88 |
34 |
0 |
31.3 |
31 |
17 |
4 |
14 |
27 |
| Dalton Roach |
R |
30 |
2 |
4 |
5.01 |
33 |
3 |
55.7 |
59 |
31 |
9 |
19 |
41 |
| Penn Murfee |
R |
32 |
1 |
3 |
5.11 |
35 |
1 |
37.0 |
36 |
21 |
5 |
17 |
31 |
| Tyler Davis |
R |
27 |
3 |
5 |
4.86 |
36 |
0 |
46.3 |
45 |
25 |
6 |
24 |
43 |
| Chris Rodriguez |
R |
27 |
1 |
3 |
5.54 |
21 |
6 |
39.0 |
41 |
24 |
5 |
21 |
28 |
| Jordan Mikel |
R |
27 |
2 |
3 |
5.10 |
23 |
2 |
42.3 |
44 |
24 |
6 |
15 |
30 |
| Trey McGough |
L |
28 |
2 |
3 |
5.06 |
24 |
1 |
42.7 |
44 |
24 |
6 |
22 |
34 |
| Justin Anderson |
R |
33 |
2 |
4 |
4.99 |
38 |
0 |
39.7 |
39 |
22 |
5 |
20 |
38 |
| Eric Adler |
R |
25 |
3 |
4 |
5.11 |
35 |
1 |
37.0 |
37 |
21 |
5 |
22 |
29 |
| Jared Kelley |
R |
24 |
2 |
3 |
5.22 |
32 |
3 |
50.0 |
52 |
29 |
7 |
30 |
40 |
| Carter Rustad |
R |
25 |
1 |
3 |
5.06 |
31 |
1 |
48.0 |
49 |
27 |
7 |
20 |
36 |
| Dan Altavilla |
R |
33 |
1 |
2 |
5.15 |
43 |
0 |
43.7 |
43 |
25 |
6 |
22 |
35 |
| Andrew Dalquist |
R |
25 |
3 |
6 |
5.56 |
35 |
6 |
55.0 |
58 |
34 |
8 |
34 |
40 |
| Caleb Freeman |
R |
28 |
2 |
4 |
5.24 |
41 |
0 |
44.7 |
46 |
26 |
6 |
27 |
37 |
| Jarold Rosado |
R |
23 |
1 |
2 |
5.35 |
32 |
0 |
38.7 |
40 |
23 |
5 |
23 |
30 |
| Mark McLaughlin |
R |
25 |
2 |
4 |
5.37 |
36 |
1 |
52.0 |
56 |
31 |
8 |
25 |
39 |
| Chase Plymell |
R |
28 |
1 |
3 |
5.30 |
32 |
1 |
54.3 |
61 |
32 |
9 |
21 |
33 |
| Gil Luna Jr. |
L |
26 |
2 |
3 |
5.94 |
32 |
0 |
33.3 |
31 |
22 |
4 |
27 |
30 |
Pitchers – Advanced
| Player |
IP |
K/9 |
BB/9 |
HR/9 |
BB% |
K% |
BABIP |
ERA+ |
3ERA+ |
FIP |
ERA- |
WAR |
| Shane Smith |
144.7 |
8.7 |
3.3 |
1.1 |
8.7% |
23.1% |
.270 |
103 |
103 |
4.10 |
97 |
2.2 |
| Davis Martin |
123.7 |
7.1 |
3.0 |
1.2 |
7.7% |
18.3% |
.288 |
92 |
92 |
4.42 |
108 |
1.3 |
| Martín Pérez |
107.0 |
6.7 |
3.4 |
1.1 |
8.8% |
17.1% |
.296 |
92 |
86 |
4.48 |
109 |
1.1 |
| Mike Vasil |
106.3 |
7.3 |
3.6 |
1.0 |
9.3% |
18.7% |
.286 |
97 |
99 |
4.42 |
103 |
1.1 |
| Grant Taylor |
55.3 |
9.8 |
2.9 |
0.8 |
7.7% |
25.6% |
.297 |
114 |
117 |
3.15 |
87 |
1.0 |
| Sean Burke |
123.7 |
8.8 |
4.0 |
1.4 |
10.2% |
22.4% |
.288 |
88 |
91 |
4.66 |
114 |
1.0 |
| Duncan Davitt |
125.0 |
6.8 |
2.7 |
1.3 |
7.1% |
17.7% |
.293 |
85 |
88 |
4.62 |
118 |
0.9 |
| Jonathan Cannon |
130.0 |
6.7 |
3.1 |
1.3 |
8.0% |
17.2% |
.293 |
85 |
89 |
4.75 |
118 |
0.8 |
| Riley Gowens |
110.3 |
8.0 |
3.3 |
1.5 |
8.6% |
20.5% |
.292 |
84 |
87 |
4.76 |
119 |
0.7 |
| Shane Murphy |
104.0 |
5.9 |
2.0 |
1.6 |
5.2% |
15.3% |
.291 |
85 |
88 |
4.80 |
118 |
0.6 |
| Noah Schultz |
88.3 |
7.8 |
4.1 |
1.1 |
10.3% |
19.8% |
.292 |
86 |
91 |
4.70 |
117 |
0.6 |
| Hagen Smith |
90.3 |
8.6 |
4.4 |
1.2 |
11.1% |
21.7% |
.278 |
84 |
90 |
4.81 |
119 |
0.6 |
| Tanner McDougal |
100.3 |
7.9 |
4.2 |
1.3 |
10.5% |
19.6% |
.295 |
83 |
88 |
4.84 |
120 |
0.5 |
| Drew Thorpe |
76.0 |
6.8 |
3.2 |
1.4 |
8.2% |
17.3% |
.289 |
84 |
89 |
4.78 |
119 |
0.5 |
| Bryse Wilson |
94.7 |
6.2 |
2.7 |
1.3 |
6.8% |
15.9% |
.291 |
86 |
88 |
4.73 |
116 |
0.4 |
| Tyler Schweitzer |
96.3 |
6.4 |
3.4 |
1.3 |
8.5% |
16.0% |
.295 |
83 |
87 |
4.82 |
121 |
0.4 |
| Mike Clevinger |
94.3 |
6.9 |
3.5 |
1.4 |
8.9% |
17.3% |
.292 |
83 |
76 |
5.04 |
121 |
0.4 |
| Chris Murphy |
76.3 |
7.8 |
4.5 |
1.1 |
11.3% |
19.6% |
.286 |
89 |
90 |
4.70 |
112 |
0.4 |
| Brandon Eisert |
64.7 |
9.0 |
3.2 |
1.1 |
8.3% |
23.5% |
.302 |
98 |
99 |
3.97 |
102 |
0.4 |
| Kyle Tyler |
93.0 |
6.1 |
3.5 |
1.2 |
8.6% |
15.1% |
.303 |
83 |
83 |
4.78 |
120 |
0.4 |
| Fraser Ellard |
47.7 |
9.6 |
4.9 |
0.9 |
12.2% |
23.9% |
.288 |
99 |
99 |
4.28 |
101 |
0.3 |
| Lucas Gordon |
92.7 |
7.1 |
4.3 |
1.4 |
10.6% |
17.6% |
.293 |
80 |
84 |
5.07 |
126 |
0.3 |
| Prelander Berroa |
54.0 |
9.5 |
5.3 |
1.2 |
13.1% |
23.4% |
.299 |
88 |
93 |
4.63 |
114 |
0.3 |
| Jake Palisch |
81.0 |
5.1 |
2.6 |
1.3 |
6.5% |
13.0% |
.296 |
84 |
85 |
4.88 |
119 |
0.3 |
| Ky Bush |
72.3 |
6.2 |
4.1 |
1.2 |
10.1% |
15.2% |
.297 |
80 |
83 |
5.03 |
125 |
0.2 |
| Jordan Leasure |
56.0 |
10.4 |
4.0 |
1.3 |
10.4% |
27.1% |
.283 |
94 |
98 |
4.15 |
106 |
0.2 |
| Connor McCullough |
57.0 |
6.8 |
2.4 |
1.6 |
6.1% |
17.5% |
.291 |
81 |
85 |
4.88 |
123 |
0.2 |
| Tyler Alexander |
93.3 |
7.2 |
2.3 |
1.4 |
6.0% |
18.9% |
.300 |
83 |
83 |
4.51 |
120 |
0.2 |
| Evan McKendry |
85.0 |
5.5 |
2.2 |
1.4 |
5.8% |
14.2% |
.290 |
79 |
81 |
4.88 |
127 |
0.2 |
| Owen White |
81.0 |
6.3 |
4.0 |
1.2 |
10.0% |
15.8% |
.297 |
78 |
82 |
5.08 |
127 |
0.2 |
| Ben Peoples |
57.3 |
7.5 |
4.4 |
1.3 |
10.9% |
18.7% |
.294 |
82 |
87 |
4.93 |
123 |
0.1 |
| Bryan Hudson |
51.7 |
8.4 |
4.0 |
1.0 |
10.4% |
21.6% |
.285 |
94 |
93 |
4.27 |
106 |
0.1 |
| Peyton Pallette |
62.7 |
8.8 |
4.0 |
1.4 |
10.2% |
22.3% |
.289 |
84 |
89 |
4.87 |
119 |
0.1 |
| Jairo Iriarte |
76.7 |
7.7 |
4.8 |
1.2 |
11.8% |
19.1% |
.291 |
79 |
84 |
5.09 |
126 |
0.1 |
| Elvis Peguero |
46.0 |
7.4 |
4.3 |
0.8 |
10.6% |
18.4% |
.297 |
91 |
91 |
4.27 |
110 |
0.1 |
| Tommy Vail |
73.0 |
7.6 |
4.9 |
1.2 |
12.1% |
18.7% |
.290 |
81 |
84 |
4.97 |
123 |
0.1 |
| Adisyn Coffey |
51.0 |
8.6 |
3.9 |
1.2 |
9.8% |
21.9% |
.296 |
89 |
93 |
4.38 |
112 |
0.1 |
| Tyler Gilbert |
57.0 |
7.9 |
3.6 |
1.3 |
9.2% |
20.1% |
.295 |
84 |
82 |
4.55 |
119 |
0.0 |
| Cam Booser |
43.7 |
9.5 |
4.1 |
1.4 |
10.4% |
23.8% |
.299 |
90 |
86 |
4.65 |
111 |
0.0 |
| Lane Ramsey |
28.7 |
8.8 |
4.4 |
1.3 |
10.9% |
21.7% |
.300 |
93 |
92 |
4.59 |
107 |
0.0 |
| James Karinchak |
41.3 |
10.2 |
5.2 |
1.3 |
13.0% |
25.5% |
.282 |
90 |
89 |
4.59 |
112 |
0.0 |
| Wikelman González |
67.3 |
8.6 |
5.5 |
1.5 |
13.2% |
20.6% |
.293 |
77 |
82 |
5.44 |
131 |
0.0 |
| Keone Kela |
21.0 |
9.4 |
5.1 |
1.3 |
12.6% |
23.2% |
.298 |
87 |
83 |
4.64 |
115 |
0.0 |
| Zach Franklin |
47.0 |
9.0 |
3.8 |
1.1 |
9.8% |
22.9% |
.289 |
89 |
93 |
4.29 |
112 |
0.0 |
| Garrett Schoenle |
63.7 |
7.2 |
3.8 |
1.4 |
9.6% |
18.1% |
.289 |
83 |
84 |
5.02 |
121 |
0.0 |
| Dylan Cumming |
76.0 |
6.5 |
3.4 |
1.4 |
8.6% |
16.4% |
.298 |
75 |
78 |
5.31 |
133 |
-0.1 |
| Miguel Castro |
31.3 |
7.8 |
4.0 |
1.1 |
10.1% |
19.6% |
.293 |
84 |
82 |
4.63 |
119 |
-0.1 |
| Dalton Roach |
55.7 |
6.6 |
3.1 |
1.5 |
7.9% |
16.9% |
.291 |
82 |
81 |
4.98 |
122 |
-0.1 |
| Penn Murfee |
37.0 |
7.5 |
4.1 |
1.2 |
10.4% |
19.0% |
.287 |
80 |
79 |
4.79 |
125 |
-0.1 |
| Tyler Davis |
46.3 |
8.4 |
4.7 |
1.2 |
11.5% |
20.6% |
.295 |
84 |
88 |
4.61 |
119 |
-0.2 |
| Chris Rodriguez |
39.0 |
6.5 |
4.8 |
1.2 |
11.7% |
15.6% |
.295 |
74 |
77 |
5.32 |
135 |
-0.2 |
| Jordan Mikel |
42.3 |
6.4 |
3.2 |
1.3 |
8.0% |
16.0% |
.288 |
80 |
82 |
5.01 |
125 |
-0.2 |
| Trey McGough |
42.7 |
7.2 |
4.6 |
1.3 |
11.4% |
17.6% |
.295 |
81 |
82 |
4.94 |
124 |
-0.2 |
| Justin Anderson |
39.7 |
8.6 |
4.5 |
1.1 |
11.1% |
21.1% |
.304 |
82 |
79 |
4.70 |
122 |
-0.2 |
| Eric Adler |
37.0 |
7.1 |
5.4 |
1.2 |
12.9% |
17.1% |
.288 |
80 |
82 |
5.30 |
125 |
-0.2 |
| Jared Kelley |
50.0 |
7.2 |
5.4 |
1.3 |
13.0% |
17.3% |
.298 |
78 |
83 |
5.30 |
127 |
-0.2 |
| Carter Rustad |
48.0 |
6.8 |
3.8 |
1.3 |
9.3% |
16.8% |
.288 |
81 |
84 |
5.00 |
124 |
-0.3 |
| Dan Altavilla |
43.7 |
7.2 |
4.5 |
1.2 |
11.3% |
18.0% |
.285 |
79 |
78 |
5.13 |
126 |
-0.3 |
| Andrew Dalquist |
55.0 |
6.5 |
5.6 |
1.3 |
13.1% |
15.4% |
.292 |
74 |
78 |
5.56 |
136 |
-0.3 |
| Caleb Freeman |
44.7 |
7.5 |
5.4 |
1.2 |
13.0% |
17.8% |
.299 |
78 |
80 |
5.20 |
128 |
-0.3 |
| Jarold Rosado |
38.7 |
7.0 |
5.4 |
1.2 |
12.6% |
16.5% |
.297 |
77 |
83 |
5.23 |
131 |
-0.3 |
| Mark McLaughlin |
52.0 |
6.8 |
4.3 |
1.4 |
10.5% |
16.4% |
.298 |
76 |
81 |
5.22 |
131 |
-0.4 |
| Chase Plymell |
54.3 |
5.5 |
3.5 |
1.5 |
8.6% |
13.6% |
.292 |
77 |
78 |
5.37 |
129 |
-0.4 |
| Gil Luna |
33.3 |
8.1 |
7.3 |
1.1 |
16.5% |
18.3% |
.284 |
69 |
72 |
5.80 |
145 |
-0.5 |
Pitchers – Top Near-Age Comps
Pitchers – Splits and Percentiles
| Player |
BA vs. L |
OBP vs. L |
SLG vs. L |
BA vs. R |
OBP vs. R |
SLG vs. R |
80th WAR |
20th WAR |
80th ERA |
20th ERA |
| Shane Smith |
.221 |
.303 |
.384 |
.234 |
.314 |
.365 |
3.3 |
1.2 |
3.46 |
4.63 |
| Davis Martin |
.254 |
.323 |
.415 |
.255 |
.314 |
.421 |
1.9 |
0.4 |
4.01 |
5.08 |
| Martín Pérez |
.233 |
.286 |
.344 |
.271 |
.342 |
.440 |
1.7 |
0.4 |
3.94 |
5.22 |
| Mike Vasil |
.249 |
.329 |
.406 |
.247 |
.325 |
.386 |
1.8 |
0.4 |
3.75 |
4.79 |
| Grant Taylor |
.221 |
.287 |
.346 |
.227 |
.277 |
.345 |
1.6 |
0.5 |
2.87 |
4.43 |
| Sean Burke |
.249 |
.340 |
.425 |
.240 |
.313 |
.419 |
1.9 |
-0.1 |
4.12 |
5.36 |
| Duncan Davitt |
.277 |
.338 |
.471 |
.249 |
.309 |
.409 |
1.8 |
0.0 |
4.21 |
5.44 |
| Jonathan Cannon |
.262 |
.331 |
.437 |
.264 |
.323 |
.442 |
1.6 |
0.0 |
4.29 |
5.36 |
| Riley Gowens |
.258 |
.347 |
.440 |
.253 |
.303 |
.444 |
1.6 |
0.0 |
4.21 |
5.48 |
| Shane Murphy |
.260 |
.295 |
.427 |
.280 |
.317 |
.488 |
1.2 |
0.0 |
4.39 |
5.43 |
| Noah Schultz |
.210 |
.311 |
.333 |
.266 |
.351 |
.440 |
1.2 |
-0.1 |
4.25 |
5.46 |
| Hagen Smith |
.235 |
.331 |
.373 |
.239 |
.346 |
.420 |
1.2 |
-0.2 |
4.29 |
5.56 |
| Tanner McDougal |
.265 |
.356 |
.429 |
.241 |
.326 |
.417 |
1.2 |
-0.2 |
4.42 |
5.49 |
| Drew Thorpe |
.267 |
.329 |
.438 |
.260 |
.315 |
.461 |
1.0 |
0.0 |
4.30 |
5.43 |
| Bryse Wilson |
.280 |
.344 |
.470 |
.257 |
.304 |
.424 |
1.0 |
-0.2 |
4.22 |
5.39 |
| Tyler Schweitzer |
.250 |
.307 |
.383 |
.275 |
.341 |
.469 |
1.0 |
-0.3 |
4.45 |
5.63 |
| Mike Clevinger |
.269 |
.346 |
.462 |
.263 |
.330 |
.442 |
1.0 |
-0.3 |
4.42 |
5.73 |
| Chris Murphy |
.220 |
.330 |
.305 |
.256 |
.347 |
.441 |
1.0 |
-0.2 |
4.02 |
5.36 |
| Brandon Eisert |
.240 |
.308 |
.365 |
.248 |
.316 |
.414 |
1.0 |
-0.2 |
3.39 |
5.01 |
| Kyle Tyler |
.278 |
.345 |
.433 |
.268 |
.335 |
.434 |
1.0 |
-0.2 |
4.45 |
5.48 |
| Fraser Ellard |
.212 |
.325 |
.288 |
.237 |
.343 |
.412 |
0.7 |
-0.3 |
3.44 |
5.08 |
| Lucas Gordon |
.274 |
.358 |
.470 |
.256 |
.336 |
.428 |
1.0 |
-0.3 |
4.59 |
5.68 |
| Prelander Berroa |
.247 |
.362 |
.412 |
.232 |
.326 |
.384 |
0.8 |
-0.3 |
3.95 |
5.61 |
| Jake Palisch |
.254 |
.301 |
.377 |
.292 |
.340 |
.500 |
0.7 |
-0.2 |
4.46 |
5.47 |
| Ky Bush |
.283 |
.350 |
.467 |
.261 |
.342 |
.427 |
0.7 |
-0.2 |
4.60 |
5.68 |
| Jordan Leasure |
.226 |
.321 |
.398 |
.222 |
.303 |
.385 |
0.8 |
-0.4 |
3.62 |
5.15 |
| Connor McCullough |
.271 |
.331 |
.439 |
.267 |
.310 |
.492 |
0.6 |
-0.2 |
4.51 |
5.67 |
| Tyler Alexander |
.252 |
.289 |
.383 |
.273 |
.324 |
.483 |
0.9 |
-0.6 |
4.24 |
5.72 |
| Evan McKendry |
.284 |
.343 |
.463 |
.264 |
.307 |
.449 |
0.7 |
-0.4 |
4.65 |
5.77 |
| Owen White |
.277 |
.361 |
.473 |
.258 |
.337 |
.404 |
0.6 |
-0.4 |
4.78 |
5.87 |
| Ben Peoples |
.257 |
.344 |
.440 |
.256 |
.343 |
.410 |
0.6 |
-0.2 |
4.46 |
5.58 |
| Bryan Hudson |
.246 |
.342 |
.377 |
.234 |
.313 |
.398 |
0.6 |
-0.4 |
3.65 |
5.26 |
| Peyton Pallette |
.234 |
.328 |
.441 |
.258 |
.340 |
.417 |
0.6 |
-0.4 |
4.23 |
5.60 |
| Jairo Iriarte |
.248 |
.366 |
.401 |
.252 |
.346 |
.429 |
0.6 |
-0.5 |
4.66 |
5.86 |
| Elvis Peguero |
.256 |
.356 |
.410 |
.245 |
.328 |
.353 |
0.5 |
-0.3 |
3.91 |
5.23 |
| Tommy Vail |
.278 |
.371 |
.456 |
.241 |
.335 |
.410 |
0.7 |
-0.6 |
4.33 |
5.91 |
| Adisyn Coffey |
.234 |
.321 |
.394 |
.257 |
.325 |
.429 |
0.5 |
-0.4 |
3.85 |
5.39 |
| Tyler Gilbert |
.235 |
.300 |
.358 |
.264 |
.340 |
.458 |
0.5 |
-0.5 |
4.11 |
5.81 |
| Cam Booser |
.236 |
.323 |
.418 |
.252 |
.336 |
.435 |
0.5 |
-0.5 |
3.59 |
5.78 |
| Lane Ramsey |
.269 |
.356 |
.442 |
.230 |
.314 |
.410 |
0.2 |
-0.3 |
3.75 |
5.21 |
| James Karinchak |
.227 |
.333 |
.387 |
.231 |
.337 |
.423 |
0.5 |
-0.6 |
3.57 |
5.91 |
| Wikelman González |
.262 |
.368 |
.443 |
.241 |
.353 |
.433 |
0.5 |
-0.6 |
4.80 |
6.17 |
| Keone Kela |
.250 |
.357 |
.389 |
.239 |
.321 |
.413 |
0.2 |
-0.3 |
3.76 |
5.80 |
| Zach Franklin |
.253 |
.347 |
.434 |
.224 |
.300 |
.367 |
0.4 |
-0.4 |
3.91 |
5.43 |
| Garrett Schoenle |
.250 |
.326 |
.369 |
.263 |
.340 |
.473 |
0.5 |
-0.6 |
4.31 |
5.72 |
| Dylan Cumming |
.300 |
.381 |
.493 |
.247 |
.324 |
.428 |
0.4 |
-0.6 |
4.90 |
6.08 |
| Miguel Castro |
.269 |
.367 |
.423 |
.243 |
.316 |
.414 |
0.1 |
-0.4 |
4.18 |
5.81 |
| Dalton Roach |
.284 |
.351 |
.490 |
.252 |
.313 |
.420 |
0.3 |
-0.6 |
4.44 |
5.85 |
| Penn Murfee |
.246 |
.347 |
.415 |
.256 |
.330 |
.423 |
0.2 |
-0.5 |
4.36 |
6.24 |
| Tyler Davis |
.236 |
.333 |
.404 |
.258 |
.340 |
.409 |
0.2 |
-0.6 |
4.26 |
5.76 |
| Chris Rodriguez |
.282 |
.393 |
.423 |
.244 |
.333 |
.430 |
0.1 |
-0.5 |
4.94 |
6.24 |
| Jordan Mikel |
.253 |
.333 |
.400 |
.272 |
.346 |
.467 |
0.1 |
-0.4 |
4.53 |
5.79 |
| Trey McGough |
.259 |
.338 |
.345 |
.261 |
.346 |
.477 |
0.1 |
-0.5 |
4.49 |
5.77 |
| Justin Anderson |
.250 |
.349 |
.431 |
.244 |
.340 |
.384 |
0.1 |
-0.6 |
4.29 |
6.00 |
| Eric Adler |
.265 |
.375 |
.412 |
.247 |
.344 |
.442 |
0.0 |
-0.5 |
4.54 |
5.83 |
| Jared Kelley |
.253 |
.359 |
.437 |
.268 |
.362 |
.429 |
0.1 |
-0.6 |
4.74 |
5.91 |
| Carter Rustad |
.269 |
.349 |
.430 |
.253 |
.327 |
.442 |
0.1 |
-0.6 |
4.49 |
5.62 |
| Dan Altavilla |
.260 |
.349 |
.466 |
.255 |
.360 |
.404 |
0.1 |
-0.7 |
4.41 |
6.24 |
| Andrew Dalquist |
.245 |
.364 |
.388 |
.281 |
.367 |
.479 |
0.1 |
-0.7 |
4.98 |
6.31 |
| Caleb Freeman |
.268 |
.381 |
.463 |
.253 |
.345 |
.400 |
0.0 |
-0.8 |
4.54 |
6.02 |
| Jarold Rosado |
.282 |
.393 |
.451 |
.241 |
.333 |
.398 |
-0.1 |
-0.7 |
4.85 |
6.06 |
| Mark McLaughlin |
.265 |
.360 |
.469 |
.270 |
.339 |
.432 |
0.0 |
-0.8 |
4.76 |
6.05 |
| Chase Plymell |
.293 |
.366 |
.455 |
.264 |
.323 |
.479 |
-0.2 |
-0.9 |
4.80 |
5.90 |
| Gil Luna |
.233 |
.365 |
.349 |
.247 |
.404 |
.435 |
-0.2 |
-0.8 |
5.14 |
6.92 |
Players are listed with their most recent teams wherever possible. This includes players who are unsigned or have retired, players who will miss 2026 due to injury, and players who were released in 2025. So yes, if you see Joe Schmoe, who quit baseball back in August to form a Ambient Math-Rock Trip-Hop Yacht Metal band that only performs in abandoned malls, he’s still listed here intentionally. ZiPS is assuming a league with an ERA of 4.16.
Hitters are ranked by zWAR, which is to say, WAR values as calculated by me, Dan Szymborski, whose surname is spelled with a z. WAR values might differ slightly from those that appear in the full release of ZiPS. Finally, I will advise anyone against — and might karate chop anyone guilty of — merely adding up WAR totals on a depth chart to produce projected team WAR. It is important to remember that ZiPS is agnostic about playing time, and has no information about, for example, how quickly a team will call up a prospect or what veteran has fallen into disfavor.
As always, incorrect projections are either caused by misinformation, a non-pragmatic reality, or by the skillful sabotage of our friend and former editor. You can, however, still get mad at me on Twitter or on BlueSky. This last is, however, not an actual requirement.