
Harper, Machado, Betts, and History
For Bryce Harper, the comparisons to Mike Trout have faded with time. While the Angels’ center fielder has played at an MVP-caliber level in each of his seven full seasons — taking home two awards and finishing as runner-up in the voting four times — his ex(?)-Nationals counterpart has ridden a performance rollercoaster since winning his lone MVP award in 2015, with injuries, struggles against the shift, and shaky defense dimming his star at least somewhat. There’s little doubt that inconsistency is one factor in slowing down Harper’s market now that he’s a free agent, and may prevent him from reaching a record-setting payday, though it is hard to sort out how much of him remaining unsigned is the result of Harper-specific concerns, and how much is the market’s generally tepid temperature. Still, Harper is just 26 years old, as is Manny Machado, his top-tiered counterpart on the free agent market. Both players remain unsigned, even as camp has opened for pitchers and catchers.
Measured against what the 27-year-old Trout has accomplished — last May, Trout surpassed the JAWS standard for center fielders, the average of each Hall of Fame center fielder’s career WAR and his seven-year peak WAR (Baseball-Reference flavors), and he now ranks seventh in the metric — the two free agents’ resumés pale by comparison. Even so, at a time when so many teams are finding excuses not to invest in them, or at least not on the terms they’re seeking, it’s worth considering how the pair stack up historically. This isn’t about haggling over dollars, and it’s less about finding recent comparisons for the past few seasons put up by Harper and Machado, as Craig Edwards did earlier this winter, and more about situating the pair within a broader context, appreciating their accomplishments to date and where their careers might take them.
First, let’s consider the limitations of the inevitable comparisons of Harper and Machado to Trout. Here’s a graph showing each of the three players’ cumulative WAR by age, from our WAR Graphs tool:
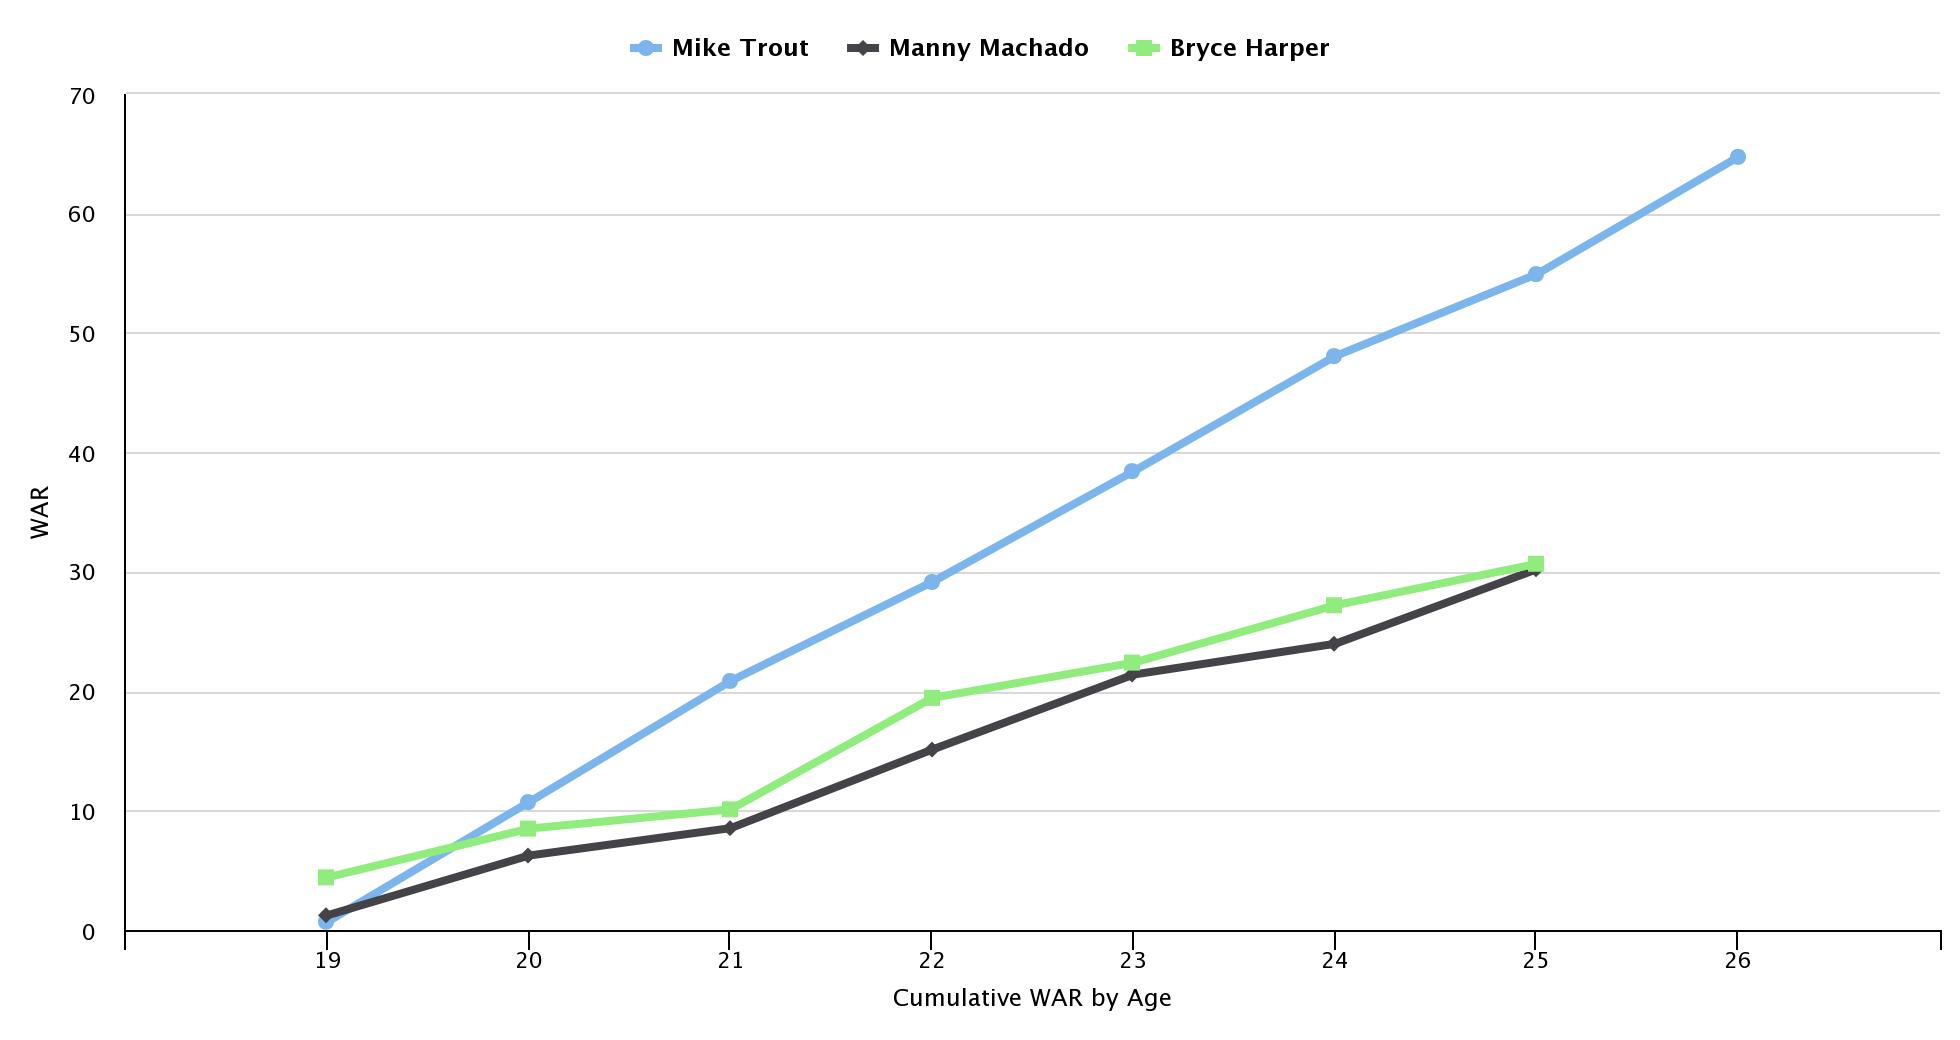
Obviously, Trout is miles ahead of the pair by now, but this isn’t really a fair fight, because the Millville Meteor’s 54.9 WAR through his age 25 season (2017) is the second-highest total of all time, behind only Ty Cobb (56.3). Harper’s 30.7 WAR to this point ranks a very respectable 31st, just behind a pair of players you’ve probably heard of: Barry Bonds and Willie Mays (both 31.1). Next above them is Babe Ruth (31.6); that’s merely through 1920, the Bambino’s inaugural season in Yankee pinstripes, when his 54 home runs obliterated his previous record of 29, set in his final season in Boston. However, that total does not include his 12.3 WAR to that point on the mound; his combined total of 43.9 WAR through age 25 would rank seventh, between Mel Ott (45.9) and Alex Rodriguez (42.8).
Meanwhile, Machado, at 30.2 WAR through age 25, is tied for 34th all time; Mookie Betts — yet another contemporary, lest this winter of discontent obscure the bounty of talent we’re currently enjoying — and Vada Pinson (both 30.5) occupy the two rungs between him and Harper. Here’s another version of the above graph, this time with as many of the aforementioned names as I could fit:
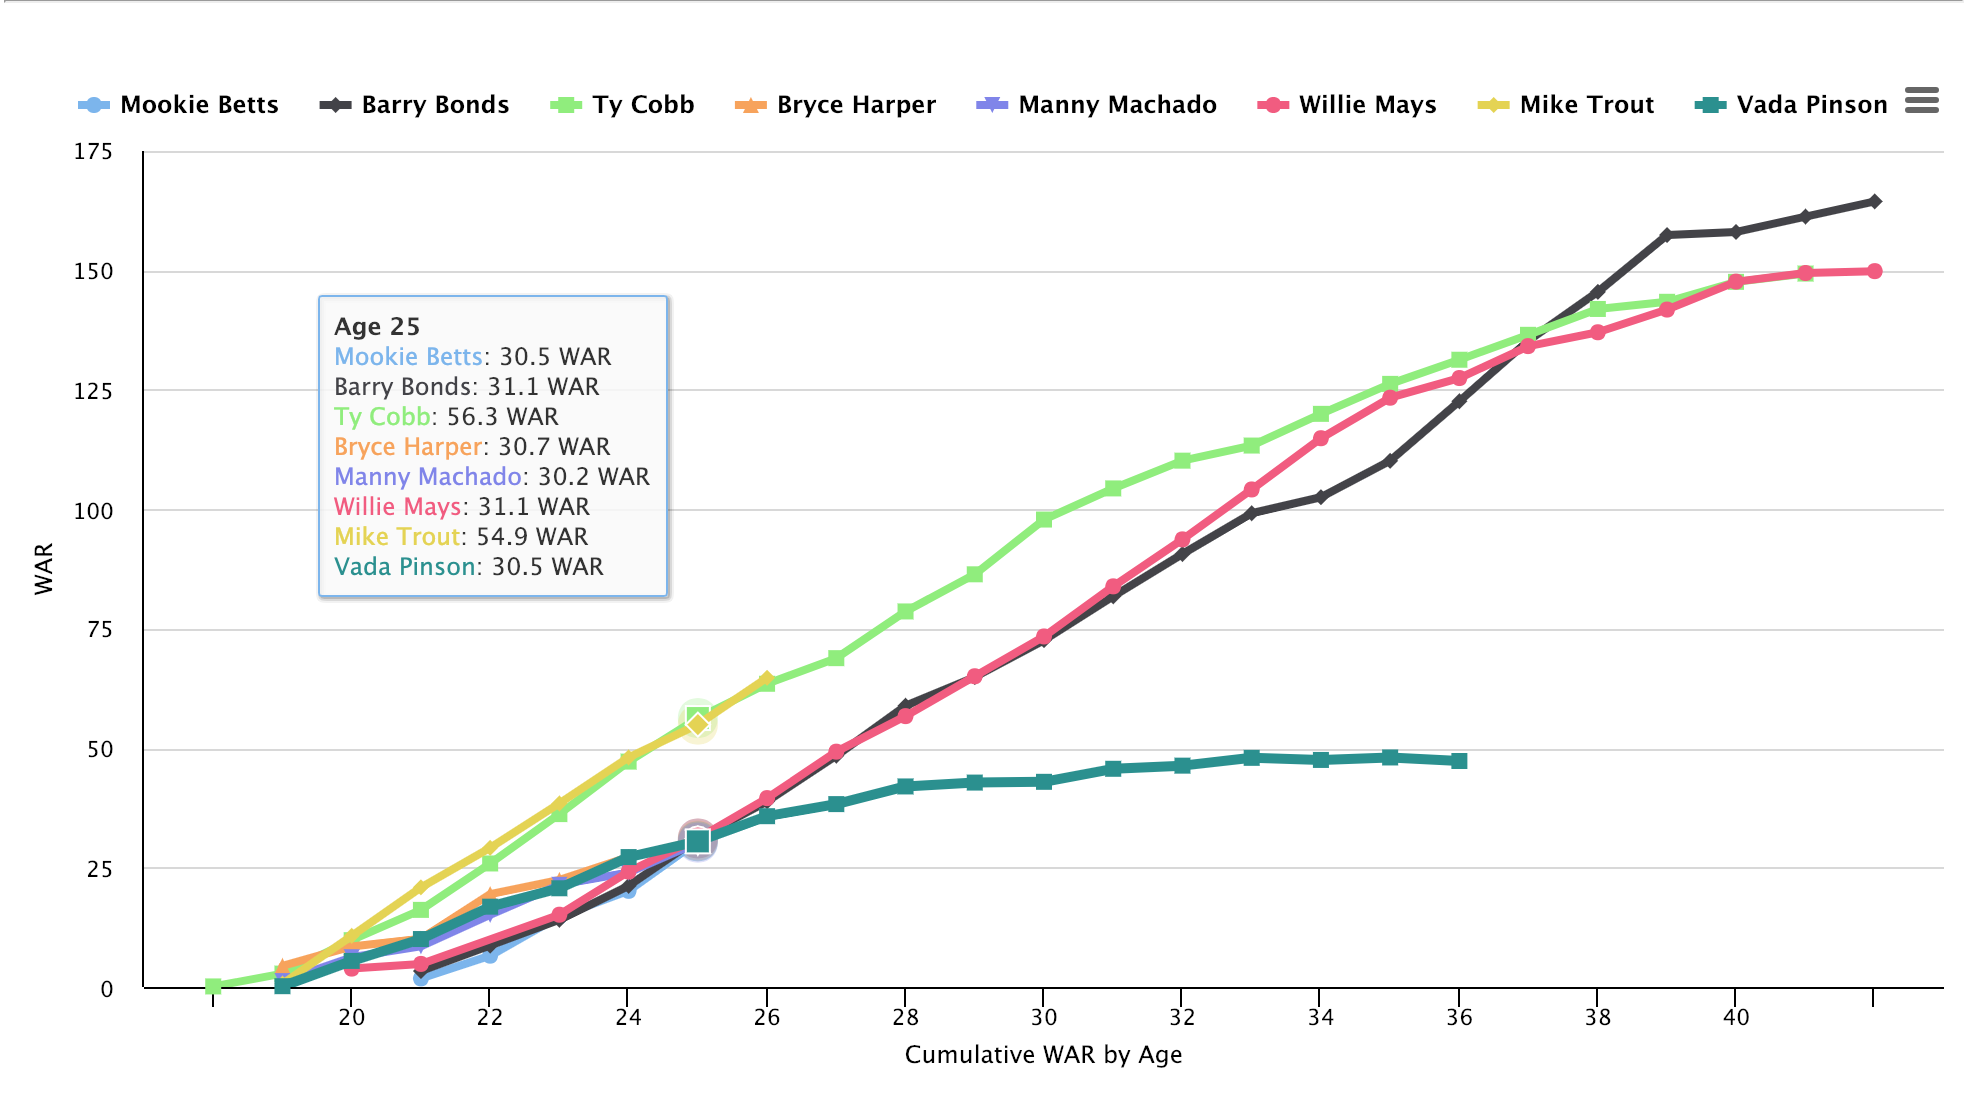
To some extent, the troubling thing at this juncture is that the slope of Harper’s line (in orange) suggests a trajectory akin to Pinson’s. In the context of viewing so many Statcast plots, those two look more like outfield fly balls in progress (thankfully, we’re not going to see the full parabola with a descent to 0.0 cumulative WAR) than towering home runs. Pinson, who was three years behind Frank Robinson at Oakland’s McClymonds High School, debuted with Robinson’s Reds as a 19-year-old on April 15, 1958, but didn’t claim Cincinnati’s center field job until the following year, when he rapped out 205 hits, including a league-high 47 doubles (and 20 homers) while batting .316/.371/.509 (130 wRC+) with 5.3 WAR. He made the NL All-Star team but was ineligible for Rookie of the Year consideration by the standards of the day (he had 96 at-bats in 1958, six over the limit, which has since risen to 130). He had three more 200-hit seasons through age 26 (1965), and hit .299/.343/.477 (122 wRC+) while producing 42.0 WAR through age 28 before leg injuries slowed him down. From 1968-1975, he netted just 5.3 WAR, making him something of an Andruw Jones analogue, albeit with less of his value coming from defense.
But I digress. Back to Harper and Machado, of the top 50 position players in WAR through age 25 — those with 26.0 WAR or more — nine aren’t yet eligible for the Hall of Fame (in descending order of WAR: the still-active Trout, Albert Pujols, Harper, Betts, Machado, and Evan Longoria, plus the retired Alex Rodriguez, Grady Sizemore, and David Wright), and two (John McGraw and Joe Torre) are enshrined as managers. Of the other 39 players from among that group, only eight (Jones, Sherry Magee, Shoeless Joe Jackson, Cesar Cedeno, Bonds, Jimmy Sheckard, Dick Allen, and Jim Fregosi) are outside the Hall.
So 79% of the eligible players from among the top 50 bunch are in, and if we narrow down to a 30.0 WAR cutoff, it’s 83% (25 out of 30). For outfielders, 15 out of 21 (71%) with at least 30.0 WAR are in the Hall, and 17 out of 24 (also 71%) from among the top 50. Here it’s worth remembering that it’s not talent keeping Bonds and Jackson on the outside, it’s the perceived severity of their misdeeds, and that would go for Rodriguez as well, if he were eligible. The sample sizes are smaller for the positions Machado has played; among shortstops and third basemen, it’s three out of three at the 30.0 WAR cutoff, and six out of eight from the top 50 (I’m counting Allen as a third baseman, as I do in JAWS because he created more value there than as a first baseman).
Of course, it’s fair to suggest that the career paths of Ott, Ruth, Magee, and other players from nearly a century ago — or in some cases, even further back — don’t tell us a whole lot about those of 21st century ballplayers. Paring that top 50 list down to exclude all of the pre-integration players, including two (Ted Williams and Stan Musial) whose early years took place prior to 1947 but who spent the bulk of their careers in the integrated majors (and who both lost seasons due to World War II), leaves a pool of 29 players. Trimming Torre (the manager) and the aforementioned nine who aren’t yet eligible for the Hall, further narrows the pool to 19 players, of whom 13 (68%) are in the Hall.
As for the staying power of these wunderkinds, I went back to the top 50 in WAR through age 25 and examined what they did over their next 10 years, from their age-26 to age-35 seasons. I did this for both the full set and the post-integration one, in both cases excluding only the players who have not yet completed their 26-to-35 years (Trout, Harper, Betts, Machado, and Longoria); Pujols, who’s beyond the 26-35 window, is still included. I split each group into upper and lower halves based upon their WAR through age 25, which avoided the problem of using arbitrary bins that placed Harper and Machado too close to one edge or the other (not that I’m claiming this to be any kind of hard science).
| Group | WAR Range | # | Avg WAR Through 25 | Avg WAR 26-35 |
|---|---|---|---|---|
| All | 34.0-56.3 | 23 | 39.7 | 54.0 |
| All | 26.0-33.9 | 22 | 29.3 | 40.7 |
| Post-Integration | 32.0-52.5 | 12 | 38.1 | 49.3 |
| Post-Integration | 26.0-31.9 | 12 | 28.6 | 35.0 |
Unsurprisingly, with or without the pre-integration players, the ones in the upper half of each group outproduced those in the lower half over the next 10 years of their careers. Of greater relevance, I think, are the averages of the lower halves of the two groups, where Harper and Machado are roughly in the middle; the lower half of the full group averaged 40.7 WAR over the next decade (around 4.1 WAR per year), that of the post-integration group — which contains Mays, Bonds, and Rickey Henderson, by the way — 35 WAR (3.5 per year). The players who actually fall within that 35-to-41 WAR range hail exclusively from the post-integration group: Johnny Bench (39.2 WAR despite retiring early), Roberto Alomar (37.3), Tim Raines (36.8), and Joe Torre (35.6), guys who faded somewhat from the hot starts to their careers but still yielded considerable value. Assuming, for a moment, that a player signed to a 10-year, $300 million contract starting at age 26 equaled Torre’s 35.6 WAR over the next decade, that’s $8.4 million per win, right around where we’ve been estimating the cost to be over the past two winters — and that’s before considering what 10 years of even modest inflation would do to that number.
As I said above, however, I’m not really writing this to dwell on the dollars but instead to provide some historical perspective about the early starters, and the take-home should be that the accomplishments to date of Harper and Machado (and Betts) suggest that they’re reasonable bets to be pretty valuable, if not necessarily elite, over the next decade and more likely than not to wind up in Cooperstown. Of course, there’s risk of an extremely negative outcome (Sizemore’s 1.4 WAR from 26-35, for example), but there’s risk in every long term deal.
I’ll close this by turning away from WAR and towards more traditional milestones that suggest Hallworthiness. Towards that end, I asked our in-house projectionist, Dan Szymborski, to provide ZiPS-based probabilities for the young guns in question — including Trout, because inquiring minds want to know — to reach various plateaus, not unlike what I did for pitcher win totals in this Justin Verlander-related piece:
| Player | 2000 H | 2500 H | 3000 H | 500 HR | 600 HR | 700 HR | 715 HR | 763 HR |
|---|---|---|---|---|---|---|---|---|
| Trout | 96% | 74% | 48% | 61% | 43% | 10% | 9% | 2% |
| Machado | 95% | 71% | 40% | 46% | 9% | <1% | <1% | <1% |
| Harper | 90% | 43% | 18% | 47% | 13% | 1% | 1% | <1% |
| Betts | 92% | 64% | 33% | 12% | 2% | <1% | <1% | <1% |
Thanks to their early starts, all four players have substantial shots at 3,000 hits, with the gap between Harper and the others owing something to the combination of his high walk rate (14.8%, the same as Trout), lack of durability, and fewer hits banked (922 to Machado’s 1,050). Betts’ relatively late start — he didn’t play his first full season until age 22 — and modest power early in his career (23 homers in his 197 games in 2014-15) cuts into his chances for a big home run total. All four players’ odds are based upon neutral parks.
For all of the reservations and handwringing about Harper and Machado, the history of prodigies like them suggests that they’ll have long, productive careers with reasonable shots at Cooperstown. We can’t predict the future with any perfection, and viewed through this lens, the range of outcomes is admittedly wide, but if the fast starters who came before them are any kind of guide, the pair’s next 10 years may be very good indeed.
Brooklyn-based Jay Jaffe is a senior writer for FanGraphs, the author of The Cooperstown Casebook (Thomas Dunne Books, 2017) and the creator of the JAWS (Jaffe WAR Score) metric for Hall of Fame analysis. He founded the Futility Infielder website (2001), was a columnist for Baseball Prospectus (2005-2012) and a contributing writer for Sports Illustrated (2012-2018). He has been a recurring guest on MLB Network and a member of the BBWAA since 2011, and a Hall of Fame voter since 2021. Follow him on BlueSky @jayjaffe.bsky.social.
The Trout line is so straight I thought it was a reference line.
The only other prodigy with that straight of a line is Hank Aaron. Equally straight as Trout’s, but a slope that’s 1 WAR/season less steep.
Pujols is that straight, well a portion of it is.
Mike Pizza’s, on the other hand, isn’t.
Based on the average increase in 26-35 WAR vs. WAR to age 25, as shown in the first table, Trout would be expected to have 130 WAR at age 35. That would be second all-time at that age.
I’m sorry, there’s a bit of a buried lede here. Babe Ruth is 28th all time in offensive WAR through his age 25 season — by which point he had only had two qualifying season (1919 and 1920), and a total of 1942 plate appearances — less than half that of Harper (3957) and Machado (4074). On a per-PA appearance, Ruth’s offensive WAR through age 25 if he had the same number of plate appearances as Trout would be 66.1 — and that’s for a Babe Ruth who’d only had one (1920) of his NINE best seasons.
Ruth’s 1920 season, when he hit .376/.533/.849, represented his third best season by fWAR (13.3), behind 1921 (13.9) and 1925 (15.0, on the back of good defensive metrics and a career high in plate appearances, to go along with a .393/.545/.764 line). Babe Ruth was ridiculous.
Mike Trout vs Adam Ottavino: 2 PA, 2 BB
Bryce Harper vs Adam Ottavino: 5 PA, .200/.200/.200, 1 SO
Manny Machado vs Adam Ottavino: 5 PA, .000/.000/.000, 2 SO
It’s probably more likely that Ruth would strike Ottavino out every time than it is that Ottavino would strike Ruth out every time.
Yeah but it was against 1920s competition
I wonder what Willie Mays would have done late in his career if he had the good stuff?
Top 30-ish in total WAR through age 25 is impressive indeed, but what if we control for the fact that both of these guys–Harper and Machado–got very early starts to their respective careers? Harper started at 19, and Machado at 20, which means they got early starts on accumulating WAR compared to guys who had to wait into their early/mid 20s.
Let’s sort the table by WAR/Plate Appearance, to see how things shake out…
Yeah…
Among the top 50 players in WAR through age 25, Harper is 44th in WAR/PA and Machado is 47th.
Among the top 100 players in WAR through age 25, Harper is 68th in WAR/PA and Machado is 76th.
Among the top 150 players in WAR through age 25, Harper is 82nd in WAR/PA and Machado is 91st.
Not bad by any means, but both are below the median in these groups of players, especially in the top 50 group, where they’re both right around the 10th percentile. Contemporaries in these groups include names like Cesar Cedeno, Jim Fregosi, and Jason Heyward.
So, what does this suggest to us? At the rate that these guys have *actually* accumulated WAR, they are both much more on the borderline/stat accumulator track for HOF consideration, as opposed to first ballot, if their careers even go that long at all. Keep in mind that both have concerning injury histories and more than an average amount of miles on the odometer–considerations which might cause a team to question how long they might remain even this effective as they get into their 30s and beyond.
So are these guys entitled to 10-year guaranteed contracts for $300 million, or otherwise the entire system must be broken? I don’t think so.
Just another perspective.
How do Ruth and Trout rank this way?
“How do Ruth and Trout rank this way?”
Good question. I didn’t save my spreadsheet, so I had to run it again quick.
Below is the entire top 50. It’s crazy to see just how far out front Ruth is.
Looks like I miscounted slightly on Bryce and Manny–they’re 43rd and 46th, respectively, not 44th and 47th. Still, you can see a pretty clear difference between the guys at the top versus the guys at the bottom of the list.
Babe Ruth 0.016271885
Ted Williams 0.013919694
Mike Trout 0.013505535
Rogers Hornsby 0.013111546
Ty Cobb 0.012963389
Stan Musial 0.012843691
Mickey Mantle 0.012755102
Lou Gehrig 0.012514264
Eddie Collins 0.012194305
Jimmie Foxx 0.012011173
Tris Speaker 0.011977716
Willie Mays 0.011834094
Joe DiMaggio 0.011617458
Joe Jackson 0.011147116
Albert Pujols 0.010997666
Evan Longoria 0.01097763
Dick Allen 0.010895696
Arky Vaughan 0.010614224
Mookie Betts 0.010434485
Eddie Mathews 0.010346639
Barry Bonds 0.01033566
Alex Rodriguez 0.010077702
Mel Ott 0.009881593
Ken Griffey Jr. 0.009770408
Cal Ripken 0.009741718
Hank Aaron 0.009441283
Frank Robinson 0.009256329
Rickey Henderson 0.009231651
David Wright 0.00921916
Andruw Jones 0.009216822
Johnny Bench 0.009177623
Frankie Frisch 0.009107358
Grady Sizemore 0.009070441
Joe Kelley 0.0090311
Sherry Magee 0.008824248
Joe Torre 0.008803612
Joe Medwick 0.008604993
John McGraw 0.008560427
Tim Raines 0.008219603
Al Kaline 0.007966409
Travis Jackson 0.007954858
Cesar Cedeno 0.007852642
Bryce Harper 0.007758403
Jim Fregosi 0.007740826
Jimmy Sheckard 0.007473958
Manny Machado 0.007412862
Vada Pinson 0.007215519
Ron Santo 0.006881097
George Davis 0.006873614
Roberto Alomar 0.006696429
Not sure if here is really the place, but I see the point about Machado’s injury history often but don’t see it challenged often enough. He had knee surgeries in 2013 and 2014 – one on each knee – to correct a genetic flaw with his medial patellofemoral ligaments that made him predisposed to have trouble with his knees. Most of us wouldn’t ever even know, but of course he needed it fixed.
His surgeon is on record saying that the surgeries worked, shouldn’t be needed again, and aren’t indicative of likely future problems. Manny has played between 156 – 162 games in each of the past four seasons (between 630 – 640 PAs). There’s no “zero injury risk player” but a 26-year-old with a track record of playing everyday and a history of successful, corrective surgery is about as low-risk as it’s possible to be.
I don’t think I can agree that a guy who has had surgery on both of his knees to correct “genetic flaw[s]” that predispose him to injury, and then has had high usage on those repaired knees, could possibly be described as being “about as low risk as it’s possible to be.” How about a guy who hasn’t required surgery on both of his knees to begin with?
Pitchers that have had Tommy John surgery usually come back good as new, or even better than before, nowadays. We don’t call these players all fixed and low-risk.
Machado literally leads the entire league in games played over the past four years (637) and PAs (2,808). Absolutely no one has been more durable, including the hypothetical guys you mentioned without surgery history. There could not be more proof that his surgeries worked and he’s going to give you ~160 games per year than what he’s actually done after those surgeries.
What you’ve just described is mileage. High mileage on repaired knees is nothing close to “proof” that he will in fact be durable in the future.
It seems that there’s nothing he can do to show you that he’s healthy. You seem convinced that no matter what, the surgeries in his distant past will prevent him from being durable. You may be right, but it’s more than a bit duplicitous to claim that him playing a lot is evidence that he might not be able to play a lot…
But Bryce Harper wants $350 Million and was only offered $300 Million! Thus nobody wants to sign him and all the owners are colluding and baseball is irreparably broken!
A wise man once said that winning the presidency required on 50.1% of the vote, and that anything beyond that number was just for ego. Perhaps teams have determined that they can stay both profitable and competitive by trying to achieve the baseball version of this. In other words, GMs are tasked with putting together the least expensive team that can conceivably win X number of games and they just don’t need to go so high or so long for any one player.
Trump is so completely devoid of ego that he won the presidency with only 46% of the vote.
Nice ultra-late-career spikes there for Bonds. He must have been the greatest athlete of all time … not just greatest baseball player.
Umm, there’s another explanation for that spike…
Harper is a great baseball player but he never lived up to the hype after coming to MLB and has been overrated every year. He doesn’t belong in the same sentence as Trout when it comes to comparison.