Welcome to another edition of Five Things I Liked (Or Didn’t Like) This Week. For once, I don’t have a fistful of double plays to show you. I don’t even have that many great catches. The baseball I watched this week was disjointed and messy, the regular season at its finest. Making the easy plays tough? We’ve got that. Bringing in your lefty to face their righty slugger? Got that too. Doubles that weren’t? Collisions between out-of-position players? Yes and yes. So thanks Zach Lowe for the wonderful article format, and let’s get started.
1. Tell ‘Em, Wash
I mean, how hard could first base be? Incredibly hard, of course. The Red Sox and Rangers are both on to their respective Plan Bs at first base after Triston Casas ruptured his patellar tendon and Jake Burger got sent down to Triple-A. No big deal defensively, right? Each team plugged in a utility player — Romy Gonzalez for Boston and Josh Smith for Texas — and moved on with life. Look how easy first is:
It’s a baseball-book bonanza! Ben Lindbergh rounds up the authors of three new baseball books for conversations about their work and our relationships with the past. First he talks to John W. Miller about his biography of Earl Weaver, The Last Manager, Weaver’s wiring and sabermetric intuition, and the diminished role and reputation of managers. Then (48:16) he brings on Will Bardenwerper to discuss his book, Homestand, the contraction of the minor leagues, and baseball as a social bond. Finally (1:29:52), Jacob McArthur Mooney joins to explore his new novel, the Northern, the baseball card wars, and road/coming-of-age stories.
Spending your own money is fun, but spending someone else’s money is even better! When it comes to extending major league contracts, unless you’re a billionaire, or a millionaire with a lot of millionaire business partners, you pretty much have to live vicariously through those other parties. Keeping talent wearing your uniform, of course, has more utility than a simple splendiferous shopping spree, since the players you want to retain are unlikely to get less expensive when they hit free agency. The Toronto Blue Jays did their own impressive feat of cash-splashing last month, when they gave Vladimir Guerrero Jr. half a billion bucks or about $700 million puckaroos, maplebacks, or whatever it is that Canadians call their money. Yes, comments section, I’m aware they’re dollars.
For this year’s edition, I’ve chosen seven players to sign to long-term deals with their current clubs, and in all seven cases, I believe an extension would be mutually beneficial for both the player and his respective team. I’ve included the up-to-date ZiPS projections for each player, as well as the contract that ZiPS thinks each player should get, though that doesn’t necessarily mean that I think the player will end up with that figure or even sign an extension.
Tarik Skubal, Detroit Tigers – Seven years, $240 million
ZiPS Projection – Tarik Skubal
Year
W
L
ERA
G
GS
IP
H
ER
HR
BB
SO
ERA+
WAR
2026
13
7
2.79
29
29
174.0
141
54
14
33
193
149
4.7
2027
13
7
2.88
29
29
172.0
144
55
15
33
186
144
4.5
2028
12
7
2.99
28
28
165.3
143
55
15
31
174
139
4.1
2029
11
7
3.12
28
28
158.7
140
55
15
30
161
133
3.7
2030
10
8
3.26
28
28
154.7
141
56
16
29
153
127
3.4
2031
10
7
3.50
27
27
149.3
142
58
16
29
143
119
2.9
2032
9
8
3.56
26
26
144.0
139
57
16
29
135
117
2.7
After his unanimous selection as the AL Cy Young winner last season, Tarik Skubal isn’t doing anything in 2025 that would make him less expensive on a long-term deal. When I ran ZiPS late last summer, Skubal just barely beat out Logan Webb for the most rest-of-career projected WAR among active starting pitchers, and he has maintained a very slight edge since. The AL Central is just ripe for some team to dominate the rest, and even if the Tigers don’t spend like they did during the Mike Ilitch years, they don’t need to dish out $300 million a year to be the big dog in this division. Skubal gives Detroit a weapon that no other AL Central team can match, and at this point, he’s probably no more of an injury risk than is any other pitcher. Outside of Javier Báez, the Tigers have very little guaranteed money on the books (Colt Keith’s deal wouldn’t even hamstring the Pirates or A’s), and if they’re looking going to spend to keep one player on the team long term, who else could it be?
Wyatt Langford, Texas Rangers – Nine years, $239 million
ZiPS Projection – Wyatt Langford
Year
BA
OBP
SLG
AB
R
H
2B
3B
HR
RBI
BB
SO
SB
OPS+
WAR
2026
.272
.349
.488
522
84
142
28
5
25
89
57
112
19
134
4.1
2027
.270
.348
.488
541
89
146
29
4
27
93
60
113
19
133
4.2
2028
.269
.349
.489
555
92
149
30
4
28
96
64
112
18
134
4.3
2029
.270
.352
.490
560
93
151
31
4
28
97
66
111
17
135
4.4
2030
.268
.351
.485
557
92
149
31
3
28
96
67
109
15
134
4.3
2031
.266
.351
.479
549
91
146
30
3
27
93
67
107
14
132
4.1
2032
.265
.350
.477
535
87
142
29
3
26
90
65
105
13
131
3.9
2033
.265
.350
.477
516
84
137
28
3
25
86
62
102
11
131
3.7
2034
.265
.350
.471
516
82
137
28
3
24
85
62
103
10
130
3.5
ZiPS was famously in love with Wyatt Langford coming into 2024, projecting him for 2.6 WAR just a few months after he was drafted out of Florida. The projection looked cringe early on as Langford struggled, but after returning from the hamstring injury that cost him most of May, he went on a tear, hitting .261/.334/.452 for a 122 wRC+ and 3.0 WAR the rest of the way. He finished the year off with a flourish, hitting eight homers and putting up nearly a 1.000 OPS in September. Langford has a 145 wRC+ this season and is already at the 1.0-WAR mark, and with nearly two years until he hits even salary arbitration, this is the best time for he and the Rangers to come to a deal that buys out some of his free agent years. He is projected to be the Rangers’ most valuable player in the long term, and they have demonstrated a willingness to spend top dollar on their best guys.
Kyle Tucker, Chicago Cubs – Eight years, $203 million
ZiPS Projection – Kyle Tucker
Year
BA
OBP
SLG
AB
R
H
2B
3B
HR
RBI
BB
SO
SB
OPS+
WAR
2026
.260
.354
.474
546
89
142
27
3
28
92
79
92
22
128
4.4
2027
.260
.353
.471
535
86
139
26
3
27
88
77
90
20
127
4.2
2028
.252
.346
.447
519
80
131
25
2
24
82
74
88
17
119
3.4
2029
.249
.343
.436
497
76
124
23
2
22
75
71
85
15
116
3.0
2030
.245
.339
.423
468
68
115
22
2
19
67
66
82
12
111
2.4
2031
.240
.333
.401
434
61
104
20
1
16
59
60
78
10
104
1.7
2032
.238
.331
.397
391
54
93
18
1
14
52
54
71
8
102
1.4
2033
.235
.327
.389
345
46
81
15
1
12
44
47
63
6
99
1.0
ZiPS was notoriously grumpy about Kyle Tucker back in March, but it’s coming around on him fast, and the gap between ZiPS and Steamer from the preseason has narrowed by two-thirds. No, the Cubs aren’t going to be able to sign him for $203 million; if he were willing to sign for that amount of money, I suspect the congratulatory press conference announcing his signing would have been months ago. But there is a dollar amount that will do the trick, and while that figure almost certainly won’t be as high as what Guerrero Jr. signed for, the fact that so few impact bats will hit free agency over the next few years gives Tucker a great deal of leverage. Now that Guerrero’s off the market, ZiPS projects Tucker to have the best 2026-2028 wRC+ of any player who is set to enter free agency after either this season or next. The second-best outfielder is Cubs teammate Seiya Suzuki, who has a 10-point shortfall compared to Tucker, not to mention that Suzuki is a much worse defender.
MacKenzie Gore, Washington Nationals – Six years, $123 million
ZiPS Projection – MacKenzie Gore
Year
W
L
ERA
G
GS
IP
H
ER
HR
BB
SO
ERA+
WAR
2026
11
9
3.70
30
30
165.3
147
68
19
56
193
110
3.1
2027
10
10
3.77
29
29
160.0
146
67
19
52
184
108
2.9
2028
10
9
3.82
28
28
157.7
146
67
19
50
176
107
2.7
2029
9
10
3.90
28
28
152.3
144
66
19
48
165
104
2.5
2030
9
10
4.01
28
28
150.3
145
67
19
48
158
102
2.2
2031
8
9
4.16
26
26
138.3
137
64
18
44
141
98
1.9
The Nationals aren’t contenders yet, but when you look at their offensive core, you see the fuzzy edges of a lineup that will get Washington back to playing October baseball. While the rotation has actually been surprisingly solid so far this season, pitchers like Jake Irvin and Mitchell Parker are overperforming their peripheral numbers, and we can’t bank on either of them to be a true ace. MacKenzie Gore, on the other hand, has peripherals that are even better than his excellent early-season stats — and he currently leads the league in strikeouts. That’s no fluke, either, as hitters simply aren’t making much contact against the former first-rounder. Gore’s 66.3% contact rate, if maintained, would be the 11th-best number among ERA qualifiers over the last decade, just behind former teammate Patrick Cor… OK, let’s stop that sentence before it gets dark. That Gore has two more years of cost control remaining gives the Nats an opportunity to absorb some risk on the injury front in order to get a better deal for a pitcher who looks like he’ll get rather expensive in a couple of years.
Logan Gilbert, Seattle Mariners – Six years, $121 million
ZiPS Projection – Logan Gilbert
Year
W
L
ERA
G
GS
IP
H
ER
HR
BB
SO
ERA+
WAR
2026
10
7
3.41
31
31
184.7
155
70
24
43
193
114
3.6
2027
9
7
3.49
29
29
173.0
148
67
23
40
176
111
3.2
2028
8
7
3.56
27
27
162.0
143
64
22
38
159
109
2.8
2029
8
6
3.64
26
26
148.3
133
60
20
35
142
107
2.4
2030
7
7
3.80
26
26
144.3
135
61
21
34
134
102
2.1
2031
6
6
3.95
22
22
127.7
123
56
19
31
115
98
1.6
To paraphrase Saint Augustine of Hippo: Jerry Dipoto, give me a Logan Gilbert contract extension, but not yet. You should probably never sign a pitcher who is currently on the IL with a flexor strain to big deal, so unlike the other extensions here, I wouldn’t suggest that the Mariners do this tomorrow. But if Gilbert comes back without problems or red flags, Seattle should sign him long term, especially with pitchers like George Kirby and Bryan Woo farther away for free agency and Luis Castillo not the talent he was as few years ago. ZiPS projects Gilbert to rank 10th among pitchers in five-year WAR, and of the others in the top 10, only Gilbert, Skubal, and Webb are eligible for free agency within the next three years. ZiPS prices Gilbert a bit lower than Gore, simply because the former is older and comes with a little less upside.
Steven Kwan, Cleveland Guardians – Six years, $111 million
ZiPS Projection – Steven Kwan
Year
BA
OBP
SLG
AB
R
H
2B
3B
HR
RBI
BB
SO
SB
OPS+
WAR
2026
.297
.371
.413
560
86
166
24
4
11
65
61
60
15
124
3.8
2027
.292
.367
.404
552
83
161
24
4
10
63
60
58
13
120
3.4
2028
.286
.361
.396
536
79
153
23
3
10
60
58
56
12
116
3.0
2029
.282
.359
.389
514
75
145
22
3
9
56
56
54
10
114
2.7
2030
.276
.353
.379
485
69
134
20
3
8
51
53
51
9
109
2.2
2031
.272
.350
.370
449
62
122
19
2
7
46
49
49
8
106
1.8
Steven Kwan is not a traditional corner outfielder, but even with his lack of power, he’s blossomed into an All-Star left fielder. Kwan is one of the most valuable contact hitters in baseball, and he makes the most of his elite contact ability by not falling into what I call the David Fletcher trap: Being so good at making contact that you hit a lot of pitches that you shouldn’t swing at. On the contrary, Kwan is a rather disciplined hitter for someone with his bat-to-ball skills; his career walk and chase rates are better than the league average. He plays solid defense in left field and gets as much out of his middling speed as is possible. The Guardians don’t like signing big deals, but José Ramírez isn’t impervious to the effects of aging, and the Guardians will have serious issues if they have to replace the production of both J-Ram and Kwan at the same time.
Hunter Brown, Houston Astros – Six years, $105 million
ZiPS Projection – Hunter Brown
Year
W
L
ERA
G
GS
IP
H
ER
HR
BB
SO
ERA+
WAR
2026
11
7
3.35
28
25
153.0
133
57
15
50
153
123
3.2
2027
11
7
3.35
27
24
150.3
132
56
15
48
148
123
3.1
2028
10
7
3.44
26
23
149.3
133
57
16
47
143
120
2.9
2029
10
7
3.55
26
22
144.3
130
57
16
45
135
116
2.7
2030
10
7
3.66
26
22
142.7
131
58
16
45
131
113
2.5
2031
9
7
3.76
23
20
131.7
124
55
16
41
117
110
2.2
Is Hunter Brown an ace now? I get asked that question in my chats three or four times a week now, and for the most part, I’ve avoided answering it because I knew that this piece was coming. So the answer is: Yes, yes he is. We have yet to see him carry a workload of 180-200 innings in a season, but at the moment, he’s on track to get there this year. And besides, volume is becoming less and less a part of an ace’s job description. Over the last calendar year, Brown ranks sixth in baseball with 5.1 WAR. During that span, he’s totaled 185 2/3 innings in 30 starts and posted a 16-6 record with a 2.28 ERA and a 2.89 FIP. Brown makes less than a million this year, and he’s still a long way away from fabulous riches. Buying out a few of his free agency years could be a good idea for both Brown and the Astros.
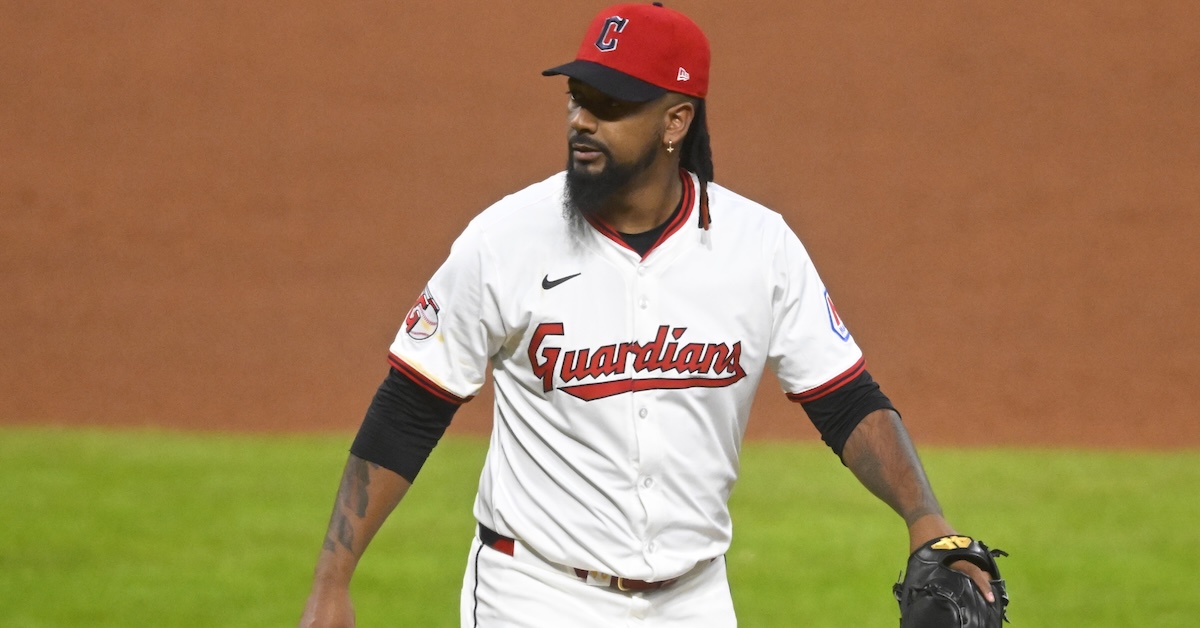
It’s rough being a reliever. Your whole career is a small sample. Emmanuel Clase has been one of the best pitchers in baseball since pretty much the moment he set foot on a major league mound in 2019, but over his entire career, he’s thrown just 338 innings. Our leaderboard says that total has been bested in 534 different player-seasons. That’s 534 times that one single player in one single season threw more innings than Clase has over his whole career. Clase set a personal best by throwing 74 1/3 innings last season, and on the individual season leaderboard, that total put him in a 79-way tie for 20,484th place. A small sample size means high variance. Over his entire career, Clase has never finished a season with an xFIP below 2.18 or above 3.42, which is pretty stable for a reliever. But after running a microscopic 0.61 ERA last season, his ERA is currently a so-big-you-can-see-it-from-space 5.51. Five-run swings are decidedly less stable.
When things go wrong to this degree, it’s usually because a combination of factors have conspired to make it happen. When you’re as good a pitcher as Clase, it takes both luck and skill to get results this bad. Our focus today will be on the extraneous factors. You know what else is subject to wild variations in short samples? Defense. And defense is letting Clase down in a big way. We’re here today because Mike Petriello asked me to look into something. Petriello is Major League Baseball’s Director of Stats and Research, and it’s my understanding that as such, I am legally required to investigate any statistical anomalies he assigns me. Here’s what he sent my way:
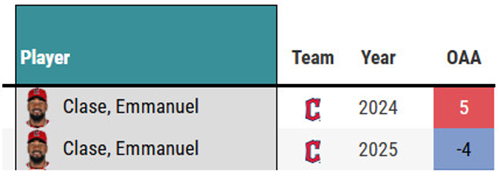
When Clase was on the mound in 2024, the Guardians racked up 5 Outs Above Average. They were great defensively. This season, even though he’s only pitched roughly one-fifth of the innings he did last year, Guardians fielders are already all the way down at -4. That’s an absurdly big swing. How is that even possible? Is it just luck? Read the rest of this entry »
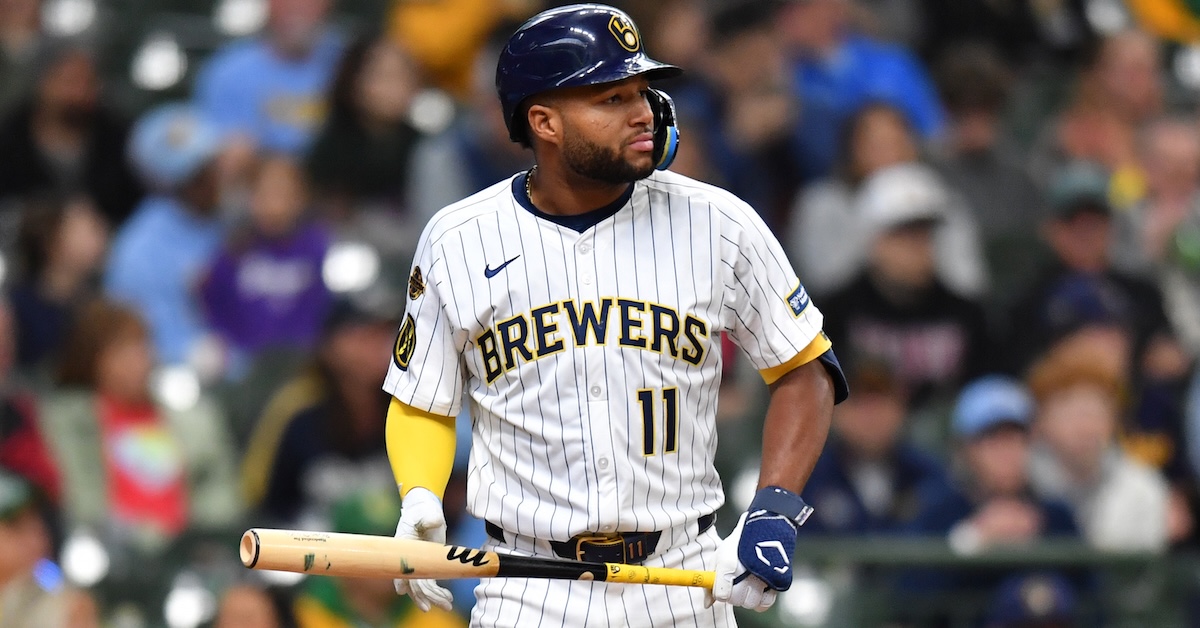
Jackson Chourio is a star. You can see it the second he steps to the plate. He looks like he’s always been in a batter’s box, like hitting comes as easily as breathing. He has easy power and shockingly good contact skills for someone who swings so hard. So, uh, why can’t he take a walk?
Fine, that’s hyperbole. It’s May 8, 38 games into the season, and he’s walked three times in 165 plate appearances. That works out to a 1.8% walk rate, the third lowest among qualified hitters. Jacob Wilson? He’s walked six times already. Michael Harris II? Four walks in fewer games. Name a guy you think can’t walk, with the exception of platoon players Kerry Carpenter and Michael Massey, and you can be sure that Chourio is walking meaningfully less than they are. Chourio didn’t walk a ton in 2024 – his 6.8% walk rate was in the 31st percentile – but this is something different entirely.
Naturally, when I started writing this piece before Tuesday’s game, Chourio had two walks in 161 plate appearances for the lowest walk rate in baseball, but then he walked his second time up in the Brewers’ 9-1 loss to the Astros. (For the rest of this article, I’ll be using stats as of the start of play on Tuesday.) Anyway, the point still stands: Chourio isn’t walking. What’s going on here? Read the rest of this entry »
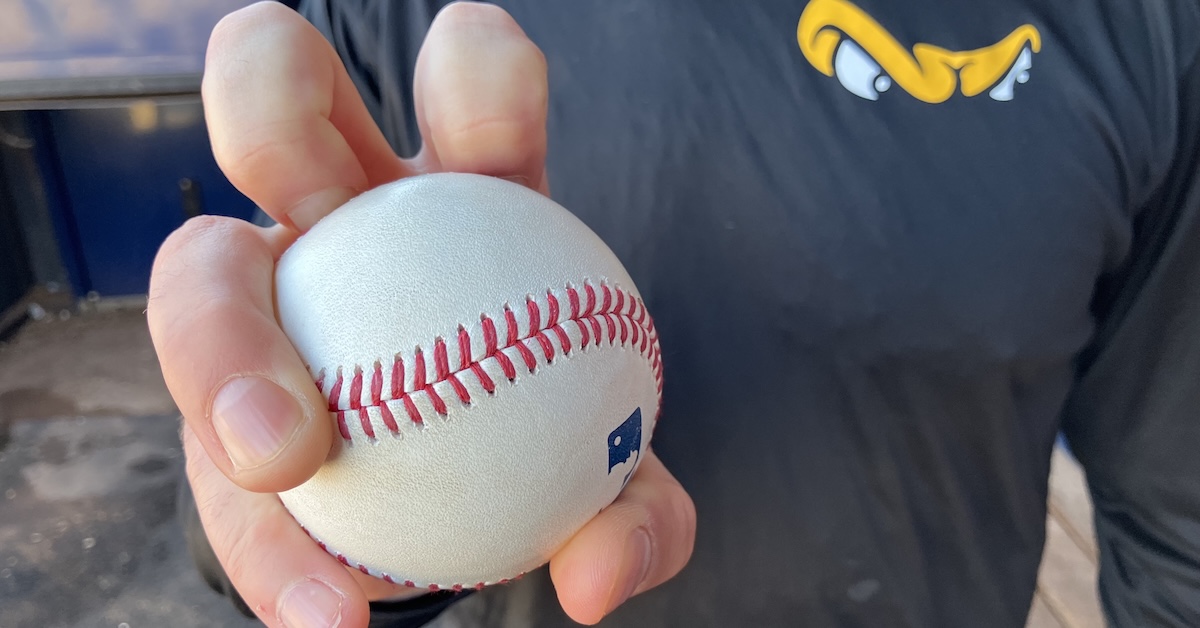
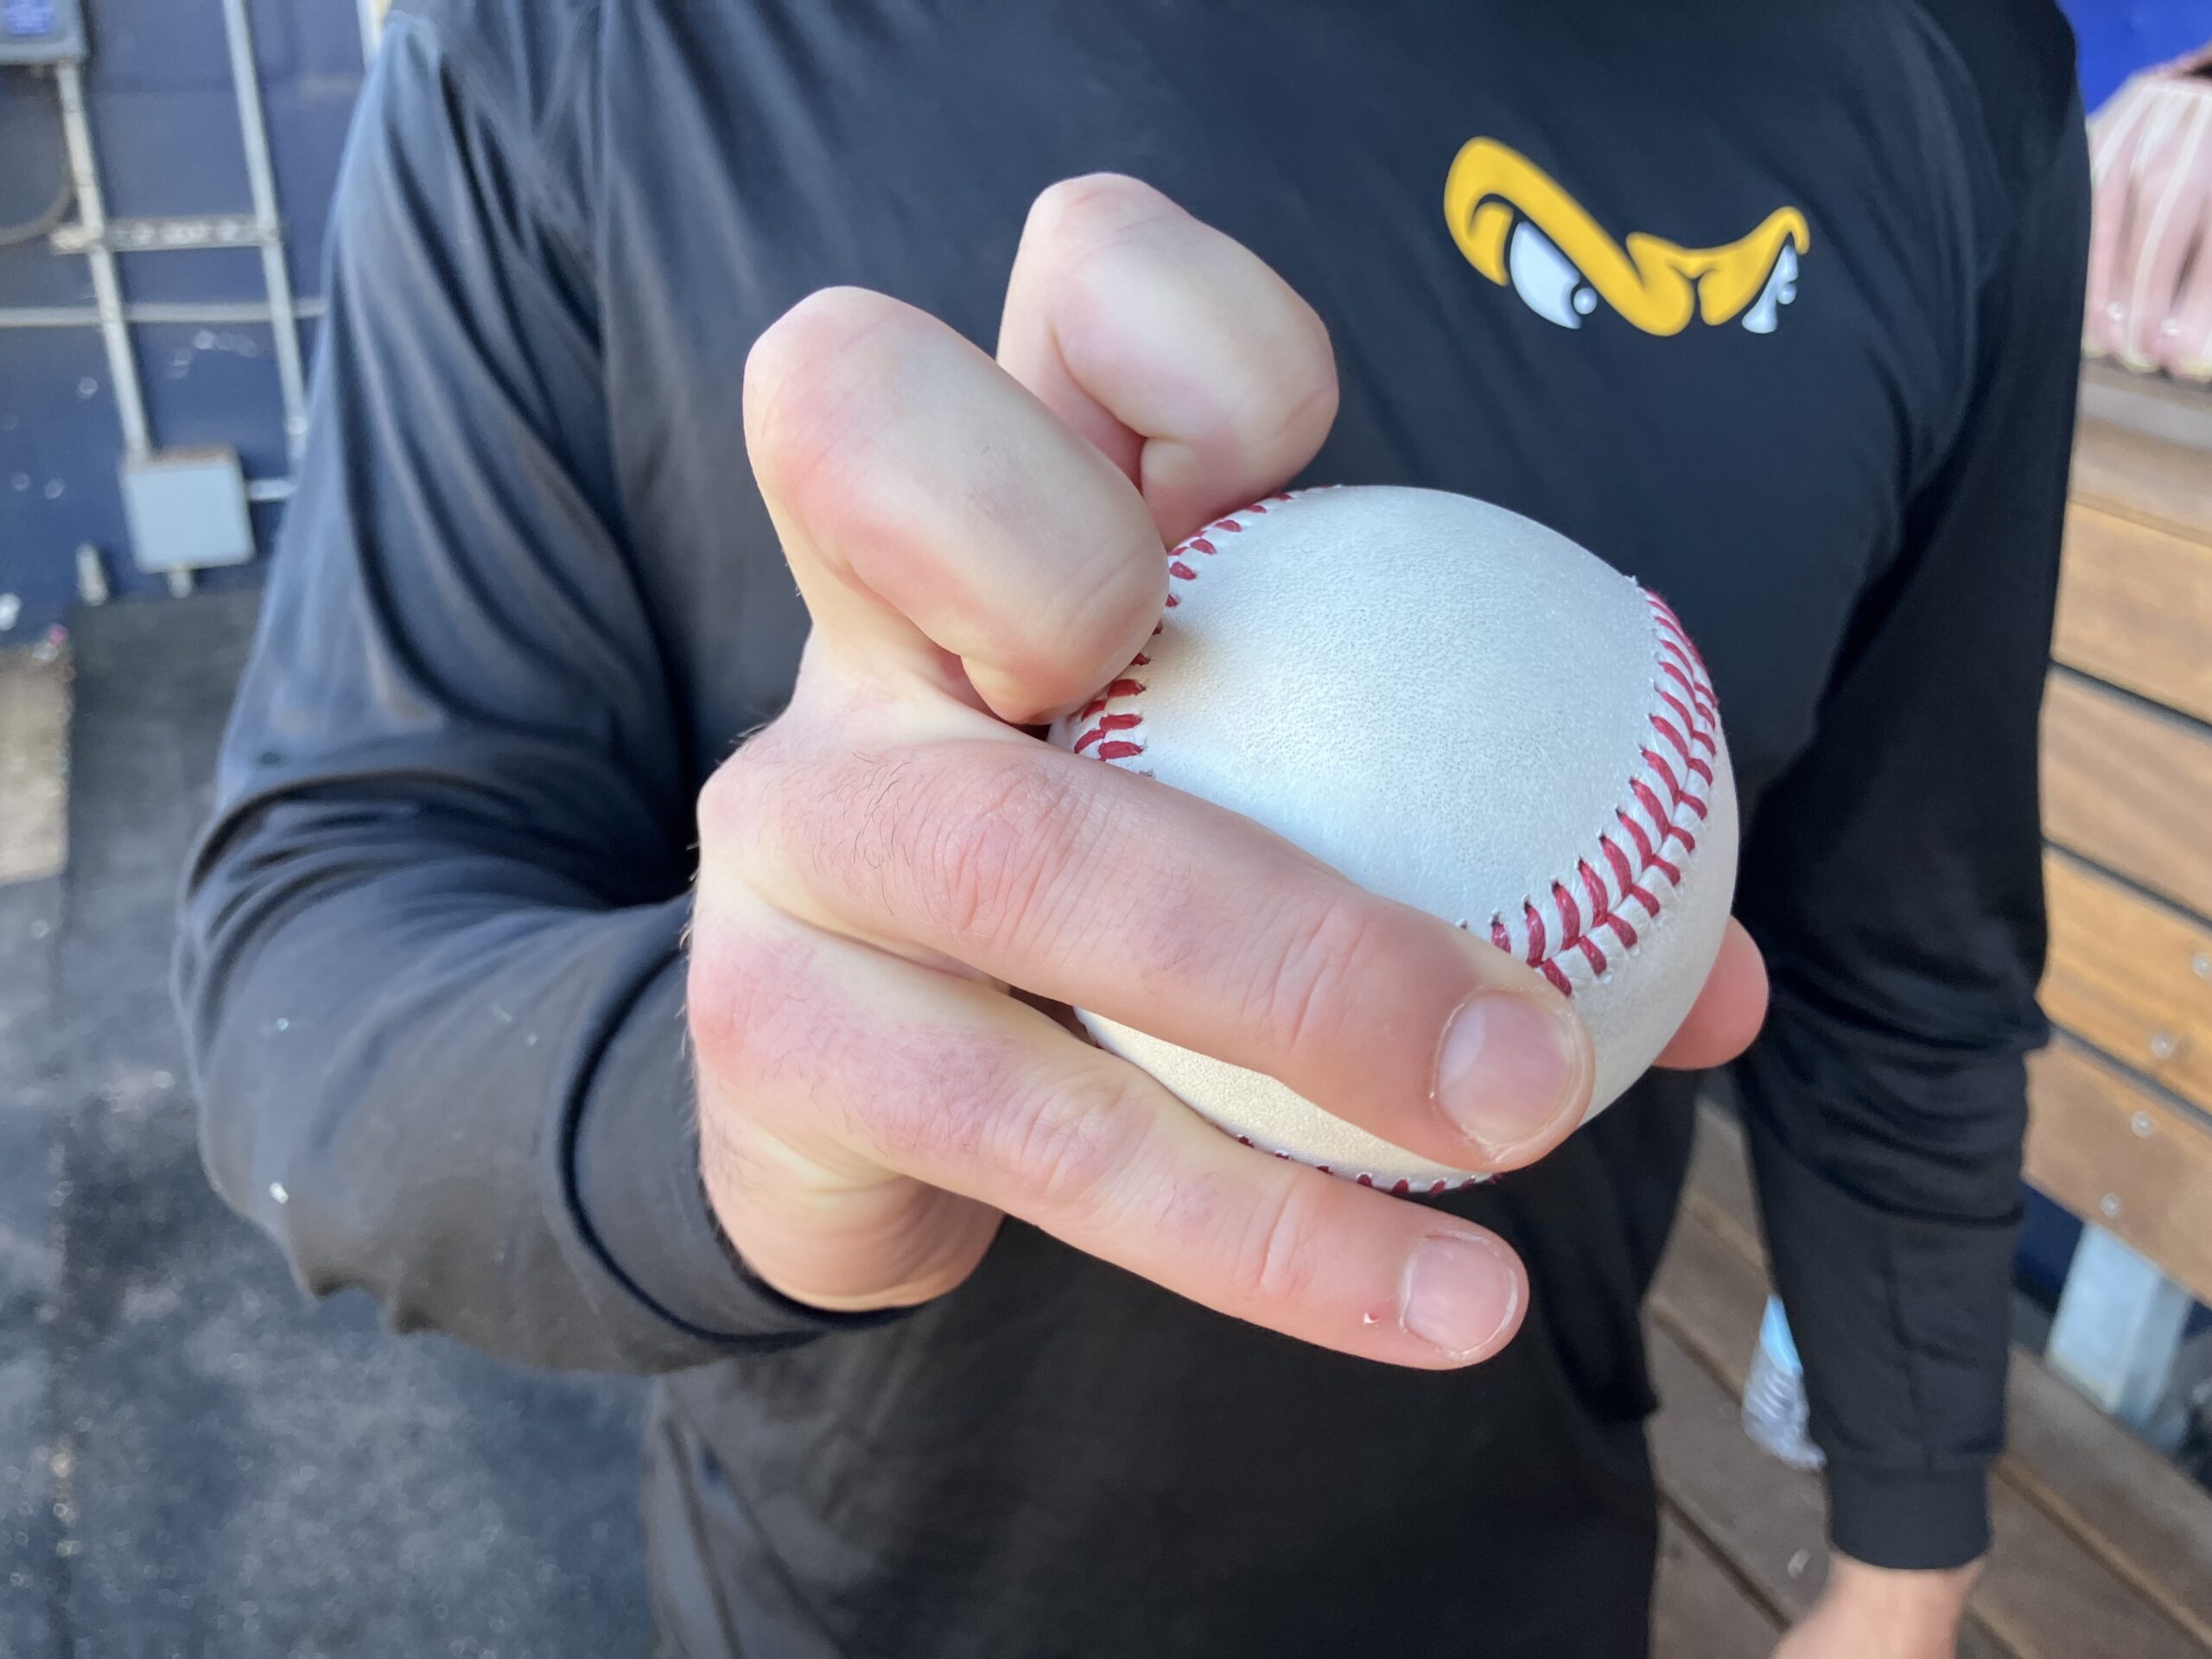
Matt Seelinger has taken an atypical path to the doorstep of the big leagues. Drafted in the 28th round by the Pittsburgh Pirates out of Division-III Farmingdale State College in 2017, the 30-year-old right-hander subsequently played in the Tampa Bay Rays, San Francisco Giants, and Philadelphia Phillies organizations before getting released and hooking on with the Atlantic League’s Long Island Ducks before the 2024 season. His fortunes turned last summer. The Detroit Tigers signed Seelinger in late June, and since returning to affiliated ball he has logged a 1.26 ERA and a 38.4% strikeout rate over 29 relief appearances between Double-A Erie and Triple-A Toledo. So far this season, the Westbury, New York native has a 4-0 record to go with a 0.57 ERA and a 30.9% strikeout rate over nine appearances, the last five of them with the Mud Hens.
His signature pitch is every bit as notable as his late-bloomer success. Seelinger’s repertoire includes a four-seam fastball and a cutter/slider, but it is his unique offering with an unorthodox grip that most stands out. Seelinger shared the story behind it when Toledo visited Triple-A Worcester last week.
———
David Laurila: You throw a unique pitch. What exactly is it?
Matt Seelinger: “So, it was coined on Long Island, where I’m from. It’s called a knuckle drop. Basically, what I do is take a four-seam fastball grip and flip it so that the horseshoe is on the inside. I take my two fingers — my pointer finger and my middle finger — and bend them. I take the top lace, and put them on the bottom of it. I put my ring finger and pinky on the seams. The thumb, I try to get underneath as much as possible, although thumb placement isn’t as big of deal as long as it’s not too high up on the ball. From there, I throw it just like a fastball, only I’m pushing it out.”
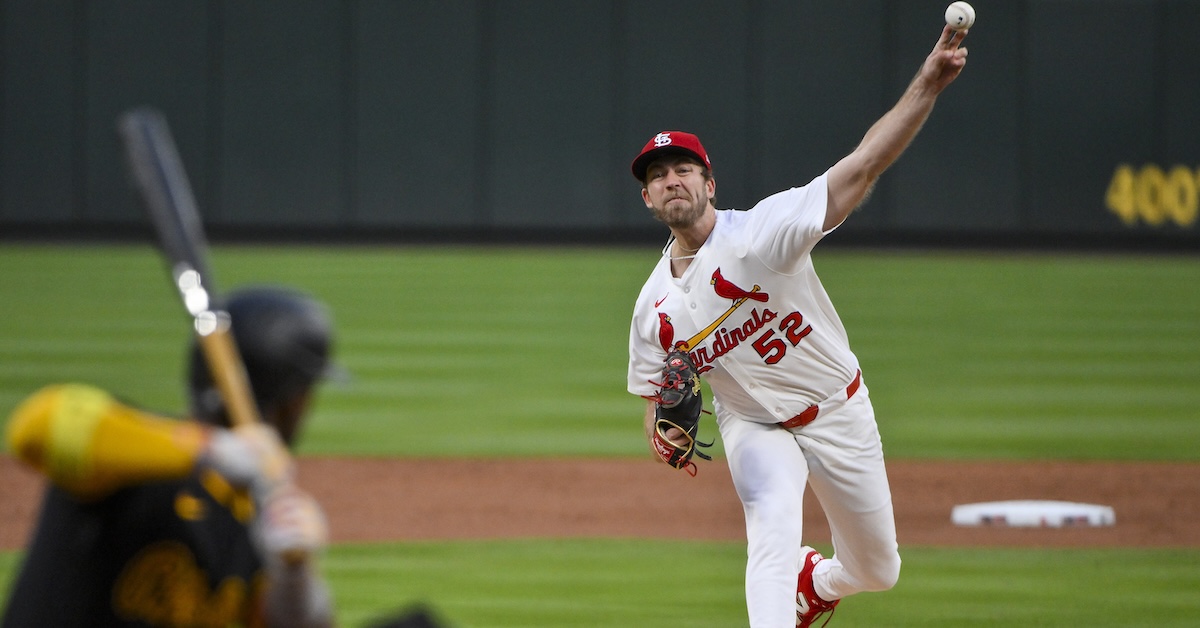
On Tuesday night, Paul Skenes — the most electric pitcher in baseball, the future face of the sport, the only reason (apart from potatoes or metallurgy) that anyone would want to go to Pittsburgh — took the mound and did his stuff. He struck out six Cardinals in six innings pitched, allowed just two runs, and threw 22 four-seam fastballs that clocked between 98.0 and 99.1 mph. If you watched the game, you got what you were promised.
But Skenes was outdueled on the evening, by a pitcher whose developmental track took substantially longer than Skenes’. Matthew Liberatore struck out eight batters over seven innings, allowed only one run, put six baserunners on to Skenes’ seven, threw 70 strikes on 99 pitches to Skenes’s 60 out of 102, and got 17 whiffs to Skenes’ 13. Read the rest of this entry »
About Prep Baseball
Prep Baseball has evolved into one of the country’s biggest and most respected independent scouting services, with a singular focus of providing comprehensive year-round coverage in every state we are in. The mission of Prep Baseball is to scout and promote amateur baseball and, ultimately, help athletes achieve their dreams of playing baseball at the next level. With more than 150 scouts, we have the largest baseball scouting infrastructure across all levels of amateur baseball in the country.
Prep Baseball is revolutionizing amateur baseball by providing athletes with unparalleled exposure through nationwide showcases, tournaments, and digital platforms. Our data-driven approach empowers players, coaches, and scouts with the insights needed to make informed decisions.
The Role: Data Engineer
As a Data Engineer (remote) on our Data Operations team, you’ll build and maintain the data infrastructure that powers Prep Baseball’s digital ecosystem. Your work will directly impact how performance metrics, game statistics, and scouting reports are collected, processed, and served to our applications—shaping the experience of athletes, coaches, and fans alike.
Responsibilities
Develop and maintain data pipelines for ingesting and processing athlete performance metrics, game statistics, and scouting reports
Implement ETL processes to transform raw data into structured formats suitable for analysis and application consumption
Design and maintain APIs for seamless data access by internal and external stakeholders
Utilize streaming technologies for real-time data processing and analytics
Manage and optimize databases to ensure data integrity, performance, and scalability
Collaborate with cross-functional teams (product, engineering, analytics) to deliver data solutions that meet business needs
Tech Stack
Languages: Python, Go
Cloud Platform: AWS (Lambda, S3, Glue, Kinesis, API Gateway, ECS)<
Databases: PostgreSQL, Amazon Athena, DynamoDB
Streaming & Analytics: AWS Kinesis
Data Transformation: AWS Glue, dbt
API Development: FastAPI (Python), Gin (Go)
Qualifications
3 + years in data engineering or a related field
Proficiency in Python, SQL, and cloud-based data solutions
Strong analytical skills with the ability to troubleshoot and optimize data processes
Excellent communication skills and a collaborative mindset
Nice to Have
Genuine passion for baseball and sports analytics
Hands-on experience with Trackman, Blast Motion, Statcast API, Rapsodo, or other baseball performance technologies
Background in event-driven architectures and serverless design
Associate – Baseball Systems – User Interface/Experience UI/UX
Location: Milwaukee, WI
Position Summary:
The Associate – Baseball Systems – UI/UX will work closely with the Software Engineering team within the Baseball Systems department. This position will be responsible for supporting the creation of intuitive, accessible, and visually appealing user experiences that enhance existing web and mobile technologies and creation of new tools.
Core duties for this role include, but are not limited to:
Create wireframes, mockups, and prototypes for web and mobile applications.
Participate in user research activities (e.g., user interviews, surveys, usability testing).
Analyze user feedback and research to refine designs.
The ideal candidate will be currently enrolled pursuing a bachelor’s degree (B. A.) in Computer Science, Human-Computer Interaction, Information Design, Digital/Graphic Design, or related field from four-year college or university; or related experience and/or training; or equivalent combination of education and experience.
Our Team
Baseball Systems is the software backbone of Baseball Operations. We provide data and decision-making tools for analysts, coaches, and front office personnel to help win a World Series. Our department consists of a team of data engineers and a team of software engineers who work across all different aspects of Baseball Operations providing support and tools relevant to each group. We work directly with stakeholders in every department of Baseball Operations to ensure every project we work on drives value to the organization and helps us win more games on the field. We help drive technical innovation to find new ways to solve baseball problems.
Our Pitch
You come here to make a difference. We are a purpose-led organization, focused on building an inclusive and engaging culture that fosters excellence, collaboration, and ingenuity. We strive to be a model employer and cultivator of talent, empowering our teams to drive innovation through the inclusion of diverse thoughts, ideas, and perspectives. We operate at the highest standard of excellence, investing in the development of our staff across all levels and embracing differences through a culture of respect and understanding.
We are proud to offer a highly competitive perks and benefits package including:
League wide medical insurance plan
401(K) match and an additional annual contribution from the Club
Collaborative recognition program and incentives
Online educational platform for personal and professional development
Employee Resource Groups
Paid time off for volunteering
Year-round diversity, equity and inclusion training and development
Brewers Home Game tickets, promotional giveaways and other discounts!
For more information about our Crew, other benefits and insight into our Club culture please visit our Careers Page
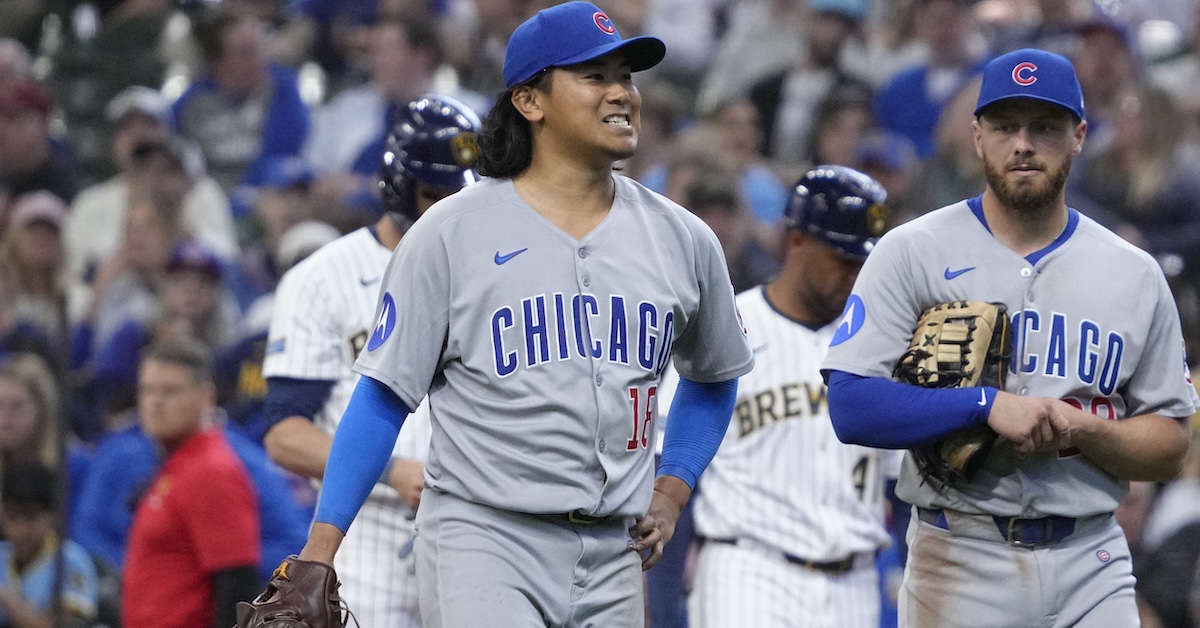
While the Cubs are 22-15 and own a three-game lead in the NL Central — the largest of any team at this writing — the rotation that’s helped them to that perch has taken its hits recently. Last month, 2023 All-Star lefty Justin Steele underwent surgery to repair his ulnar collateral ligament, and Javier Assad suffered a setback while rehabbing to return from an oblique strain. And then on Monday, the Cubs placed 2024 All-Star lefty Shota Imanaga on the injured list due to a left hamstring strain. While his injury isn’t considered to be major, his loss could tighten the division race and test the depth of the already-depleted rotation.
After leaving his April 29 start against the Pirates after five innings due to cramps in both quadriceps, Imanaga cruised through the first five innings against the Brewers on Sunday in Milwaukee, allowing just three singles while striking out four without a walk. The 31-year-old’s afternoon ended on a sour note, however. With the game still scoreless in the sixth, he yielded a leadoff single to Jackson Chourio and then a one-out walk to William Contreras. It looked as though he might escape unscathed when he got Christian Yelich to ground to first baseman Michael Busch, who started a potential 3-6-1 double play. Imanaga ran to cover first base, but not only was Dansby Swanson’s throw a bit late, the pitcher came up limping, forcing him out of the game.
Reliever Julian Merryweather entered, threw a wild pitch that allowed Chourio to score from third, and by the time he got the final out, three more runs had scored in what ended as a 4-0 loss for the Cubs. They suffered a much more gruesome defeat on Tuesday, when reliever Ryan Pressly allowed eight straight Giants to reach base in what became a nine-run 11th inning and a 14-5 drubbing. Read the rest of this entry »