Ben Clemens FanGraphs Chat – 8/25/25
by Ben Clemens


August 25, 2025
If you’re looking for a team to make a surprise run to the playoffs, the final month of the season likely won’t be that exciting; there are just three teams on the fringe of the postseason picture, and none of them have playoff odds higher than 20%. But with 12 teams jockeying for their playoff position and a handful of division races left to be decided, there’s still potential for a good bit of intrigue between now and October.
Last year, we revamped our power rankings using a modified Elo rating system. If you’re familiar with chess rankings or FiveThirtyEight’s defunct sports section, you’ll know that Elo is an elegant solution that measures teams’ relative strength and is very reactive to recent performance. To avoid overweighting recent results during the season, we weigh each team’s raw Elo rank using our coin flip playoff odds (specifically, we regress the playoff odds by 50% and weigh those against the raw Elo ranking, increasing in weight as the season progresses to a maximum of 25%). The weighted Elo ranks are then displayed as “Power Score” in the tables below. As the best and worst teams sort themselves out throughout the season, they’ll filter to the top and bottom of the rankings, while the exercise will remain reactive to hot streaks or cold snaps.
First up are the full rankings, presented in a sortable table. Below that, I’ve grouped the teams into tiers with comments on a handful of clubs. You’ll notice that the official ordinal rankings don’t always match the tiers — there are times where I take editorial liberties when grouping teams together — but generally, the ordering is consistent. One thing to note: The playoff odds listed in the tables below are our standard Depth Charts odds, not the coin flip odds that are used in the ranking formula. Read the rest of this entry »
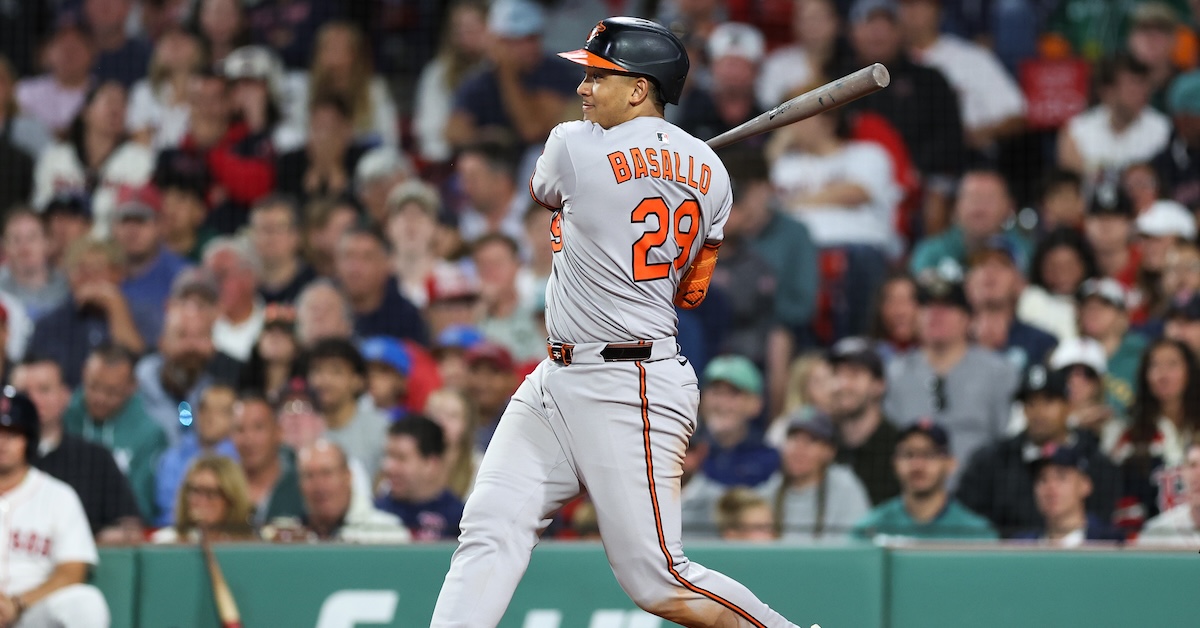
The Baltimore Orioles came into this year with a few goals. Foremost among them: reach the playoffs, find reliable pitching, and sign some of their young core to contract extensions. Goal one is out of the question. Goal two is up in the air. But goal three? Goal three is going strong after the Orioles and Samuel Basallo agreed to an eight-year, $67 million contract extension, with a team option and escalators that could push the total value to $88.5 million. Andy Kostka of The Baltimore Banner first reported the deal.
Basallo, currently the third overall prospect in baseball, debuted in the majors last week after a whirlwind tour of the minor leagues. He overpowered A-ball at 18 in 2023, mastered Double-A in 2024, and was hitting .270/.377/.589, good for a 150 wRC+, in Triple-A before the O’s called him up. He’s been far younger than his opposition at every level, and it just hasn’t mattered; his colossal raw power has papered over any weaknesses or growing pains again and again.
Throughout his ascension through the prospect ranks, the biggest question about Basallo has been whether he’ll stick behind home plate or have to move to a less demanding defensive position, likely first base. While Basallo’s offensive performance has been consistently excellent, his defense hasn’t been quite so exciting. A stress fracture in his elbow has slowed him, costing him valuable reps at catcher. He played DH about as frequently as he caught in Triple-A this year, and the same was true in 2024. Read the rest of this entry »
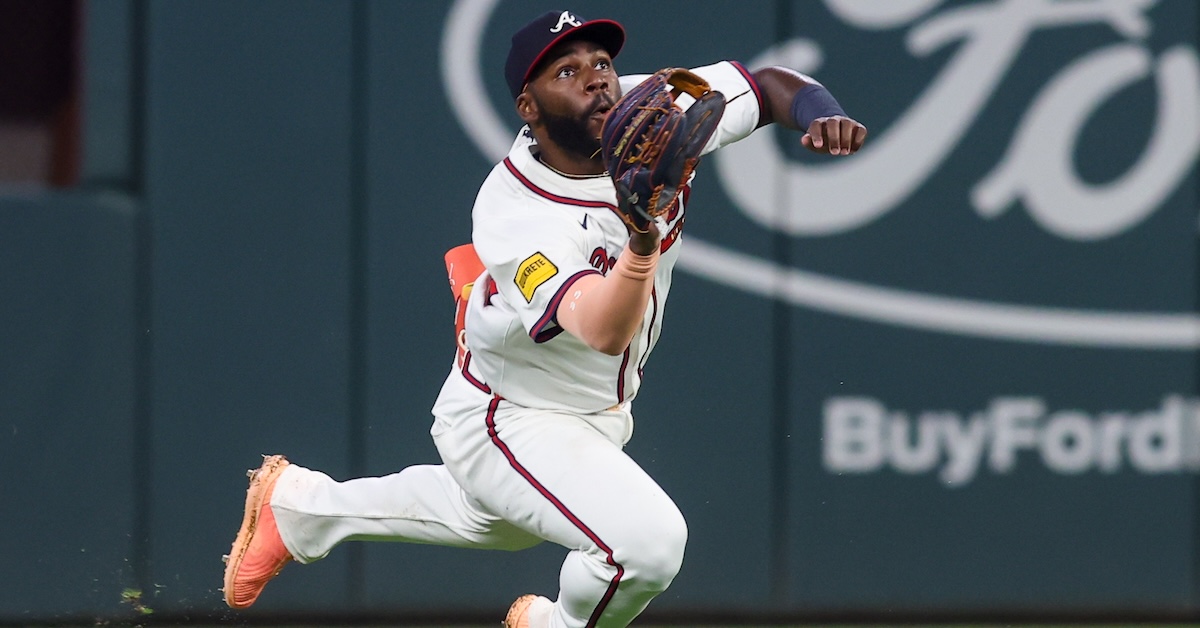
Most of the time, you don’t really have to squeeze your glove when you catch the ball. At least, you don’t have to think about squeezing it. It’s an instinctual thing, and while it’s different if you’re a catcher, the whole point of the glove is to corral the baseball. It was designed just for that. The ball tends to stick in there.
That’s most of the time. Sometimes you really do have to think about squeezing the ball, though. Sometimes there’s geometry involved. I love the geometry.
I love thinking about the angles. How do I position myself so I can catch this throw and apply the tag in one motion? Should I wait on this ball, or should I circle around it so I can charge it and field it on a short hop? At what point do I give up on picking this throw and step back to catch it on the long hop? Read the rest of this entry »
Tarik Skubal and Hunter Brown matched up at Comerica Park earlier this week, and the aces didn’t disappoint. In a game Detroit won 1-0 in 10 innings, the Tigers southpaw fanned 10 batters through seven stellar innings, while the Houston Astros right-hander tossed six scoreless frames with half a dozen strikeouts. In terms of modern-day pitchers’ duels, this was nearly as good as it gets.
On pace to win his second straight AL Cy Young Award, Skubal is currently 11-3 with a 2.32 ERA and a 33.1% strikeout rate. Brown, who is fast establishing himself as one of baseball’s best pitchers, is 10-5 with a 2.36 ERA and a 29.3% strikeout rate. Both cook with gas. Skubal’s fastball ranks in the 91st percentile for velocity, while Brown’s ranks in the 83rd percentile.
A few hours before they went head-to-head, I asked Detroit manager A.J. Hinch how — left and right aside — the two hurlers compare.
“I know my guy, and don’t know Hunter as well — how he goes about it or how he prepares — but if you’re looking at who has the best fastballs in the league, you’re going to look at both of those guys,” replied Hinch. “If you look at who has elite secondary pitches, both do. Tarik will use his changeup more than Hunter will. I just think there’s an it factor that comes with a guy where, when we come to a ballpark and Tarik is pitching, we expect to win. I’m sure when Hunter is pitching, the Astros expect to win. That’s the definition of top of the rotation.”
Which brings us to the baker’s dozen innings they combined to throw on Tuesday night. Once upon a time, it would have been several more. For much of baseball history, pitchers who were dealing were generally allowed to keep dealing. The legendary July 2, 1963 matchup between San Francisco’s Juan Marichal and Milwaukee’s Warren Spahn is a case in point. That afternoon, Marichal threw 16 scoreless innings, while Spahn (at age 42, no less) tossed 15-and-a-third of his own — only to then be taken deep by Willie Mays for the game’s only run. Read the rest of this entry »
One of the funniest things to come out of this mailbag column so far occurred two weeks ago, when I wrote about the most replacement-level players of all time. I began that week’s mailbag by talking about questions that require both quantitative data and subjective analysis to answer, and I used the question “Who is the greatest baseball player of all time?” as an example. I made it quite clear that I wasn’t going to give my opinion on the subject; instead, I explained how people might consider the question and formulate their arguments, and in doing so, I mentioned a few of the best players ever. Nothing to it.
Except, of course, I should’ve known that you wonderful baseball sickos couldn’t resist hashing out that debate in the comments. A good number of you latched on to the part about how someone might give Barry Bonds the edge over Babe Ruth because “Bonds wouldn’t have been allowed to play during Ruth’s career.” Readers also made points about expansion and cited U.S. census numbers to compare the population sizes of major league baseball and the country. I truly did not expect any of that.
So maybe I should be prepared for anything with the question I answered to begin this week’s mailbag, which also deals with all-time great players and lineups. It’s quantitative for sure, but context is also necessary to understand why things turned out the way they did. It’s a fun one, so let’s get to it. Before we do, though, I’ll remind you all that while anyone can submit a question, this mailbag is exclusive to FanGraphs Members. If you aren’t yet a Member and would like to keep reading, you can sign up for a Membership here. It’s the best way to both experience the site and support our staff, and it comes with a bunch of other great benefits. Also, if you’d like to ask a question for an upcoming mailbag, send me an email at mailbag@fangraphs.com. Read the rest of this entry »
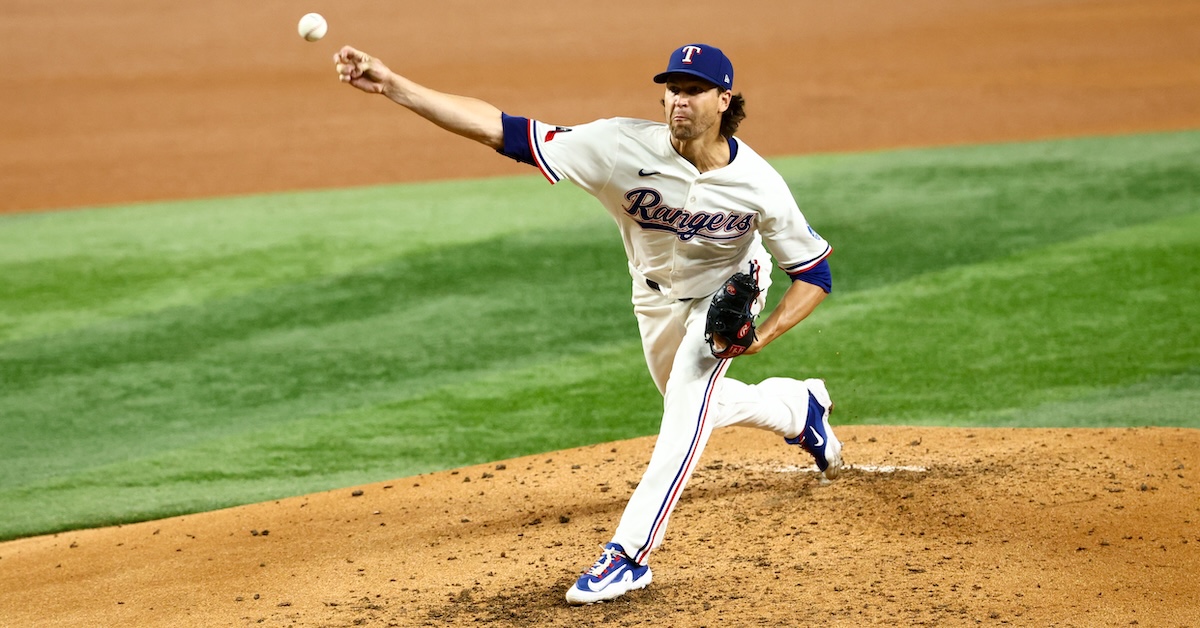
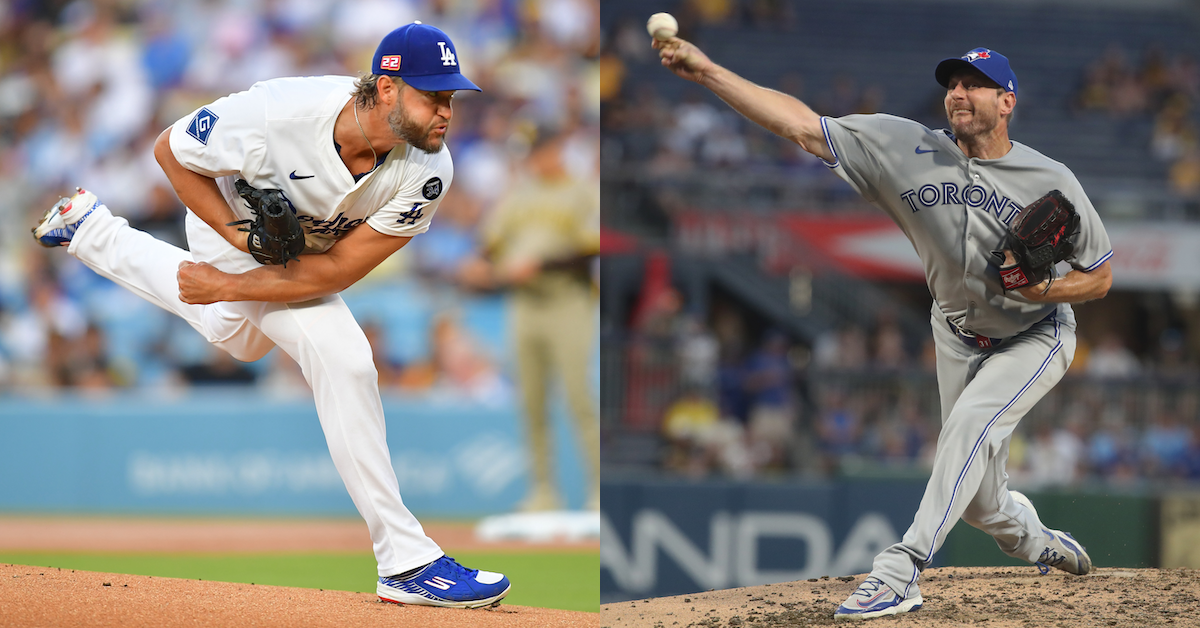
Earlier this week, my colleague Jay Jaffe touched a bit on Jacob deGrom and his Hall of Fame case. Since the world can always use more sentences describing how awesome deGrom is, and because I’m fascinated by how his Hall of Fame case will look to voters sometime in the mid-2030s, I decided to dig a little more into his future candidacy and reasonable expectations for what the end of his career can add to his record. I also wanted to explore what deGrom’s case means for 2010s/2020s Hall of Fame starting pitcher representation more broadly.
This has been a concern of mine for a while, and I talked a bit about it last year in the context of Chris Sale’s marvelous comeback season. This piece has stuck with me as it was one of those rare articles in which the act of writing it changed my opinion somewhat. At the start, my thought process was “with a less than 50% chance of finishing with 200 wins, Sale probably won’t be in the Hall of Fame, and may be too borderline for even me.” But then I projected the rest of the league, and for the first time ever in ZiPS, not a single pitcher who hadn’t already passed 200 wins was projected to have a 50% chance of reaching that milestone. So, perhaps Sale should get to Cooperstown even if he falls short of that threshold, because if the writers don’t vote for him on the grounds that he didn’t get to 200 wins, how could we justifiably elect any future starting pitcher?
| Player | W | Debut | |
|---|---|---|---|
| 1 | Justin Verlander | 260 | 2005 |
| 2 | Max Scherzer | 214 | 2008 |
| 3 | Clayton Kershaw | 210 | 2008 |
| 4 | Gerrit Cole | 145 | 2013 |
| 5 | Johnny Cueto | 144 | 2008 |
| 6 | Lance Lynn | 138 | 2011 |
| 7 | Charlie Morton | 133 | 2008 |
| 8 | Chris Sale | 128 | 2010 |
| 9 | Carlos Carrasco | 109 | 2009 |
| 10 | Kyle Gibson | 108 | 2013 |
| 11 | Wade Miley | 108 | 2011 |
| 12 | Yu Darvish | 107 | 2012 |
| 13 | Sonny Gray | 105 | 2013 |
| 14 | Dallas Keuchel | 103 | 2012 |
When I wrote last year’s piece, there were only 11 pitchers between 100 and 200 wins, a shockingly tiny number. And of those 11, only one is in a better position to win 200 games now than he was then: Sonny Gray, who has added 12 wins and is having a fairly typical season by his standards. As far as the other 10 are concerned… Gerrit Cole is out until well into 2026 due to elbow surgery, and Sale has missed a bunch of time this year from injuries. Lance Lynn and Kyle Gibson have both since retired, Johnny Cueto has all but officially done the same, and Carlos Carrasco and Dallas Keuchel are in the minors and, for the purposes of this exercise, might as well be retired. Wade Miley has one win this season and is currently out with forearm pain in his comeback from Tommy John surgery. Yu Darvish, who didn’t make his season debut until July, has moved only two wins closer to 200 in his age-38 season. As a Baltimore native, I’m not psychologically prepared to talk about Charlie Morton’s progress.
The good news is eight new pitchers have joined the 100-win club this season, but none of them look to be on a path to 200 wins right now.
| Pitcher | Wins | Debut | Age | ZiPS Projected Final Wins |
|---|---|---|---|---|
| Jose Quintana | 112 | 2012 | 36 | 134 |
| Kevin Gausman | 110 | 2013 | 34 | 148 |
| Patrick Corbin | 109 | 2012 | 35 | 128 |
| Michael Wacha | 109 | 2013 | 34 | 146 |
| José Berríos | 108 | 2016 | 31 | 144 |
| Aaron Nola | 105 | 2015 | 32 | 152 |
| Kyle Hendricks | 103 | 2014 | 35 | 119 |
| Nathan Eovaldi | 102 | 2011 | 35 | 136 |
Of these eight, only Nola projects with a 50% chance to get to even 150 wins. While it’s theoretically possible for most of the eight to get to 200 wins, it would require an unusually robust late-career surge. During the Wild Card era, only 10 pitchers have amassed 90 wins after their age-34 season, and almost all of them were in the early part of the era; pitcher workloads have continued to drop, and starting pitchers get fewer decisions than ever.
ZiPS projects only four other pitchers to have a 50% shot at reaching 150 wins: Tarik Skubal, Garrett Crochet, George Kirby, and Paul Skenes.
Rewind ZiPS a decade, and it gave 17 active pitchers a 50% chance to win 200 games. Nine eventually did hit that milestone, and Cueto, the only member of the other eight who is still technically active, isn’t going to do it.
So, let’s run the ZiPS projections for the remainder of deGrom’s contract with the Rangers, beginning in 2026 and running through 2028 — assuming Texas picks up his club option for that season. ZiPS was really worried about his health entering the season, for very obvious reasons, and while he just missed his most recent scheduled start due to shoulder fatigue, the injury is not believed to be a long-term issue. His projected workloads in future seasons have increased now that he’s stayed mostly healthy in 2025.
| Year | W | L | ERA | G | GS | IP | H | ER | HR | BB | SO | ERA+ | WAR |
|---|---|---|---|---|---|---|---|---|---|---|---|---|---|
| 2026 | 8 | 5 | 3.50 | 26 | 26 | 138.7 | 117 | 54 | 19 | 31 | 149 | 116 | 2.7 |
| 2027 | 7 | 6 | 3.81 | 25 | 25 | 132.3 | 120 | 56 | 20 | 32 | 135 | 107 | 2.0 |
| 2028 | 6 | 6 | 4.20 | 23 | 23 | 122.0 | 117 | 57 | 20 | 32 | 119 | 97 | 1.4 |
Give deGrom the 21 projected wins for 2026-28 and a couple September wins this year, and that gets him to 123 for his career. In his piece, Jay brought up Sandy Koufax while discussing deGrom, and I think it’s an apt comparison.
| Pitcher | W | L | IP | K | ERA | ERA+ | WAR |
|---|---|---|---|---|---|---|---|
| Sandy Koufax (1961-1966) | 129 | 47 | 1632.7 | 1713 | 2.19 | 156 | 46.3 |
| Sandy Koufax (Career) | 165 | 87 | 2324.3 | 2396 | 2.69 | 131 | 54.5 |
| Jacob deGrom (Proj. Career) | 117 | 80 | 1928.3 | 2253 | 2.82 | 141 | 52.8 |
Koufax’s peak was more concentrated and more impactful in individual seasons than deGrom’s, but as I said about Johan Santana when he was on the Hall of Fame ballot, if your best years are being mentioned in conversation with those of Koufax, you must have been a dynamite pitcher. To me, from a pure dominance perspective, Peak deGrom isn’t that far behind Peak Koufax; certainly, the gap isn’t wide enough to keep deGrom out of Cooperstown considering pretty much everyone views Koufax as a no-doubt, inner-circle Hall of Famer.
Of course, it’s an inauspicious sign for deGrom that I’m using Santana as the other not-quite-Koufax comp, given that Santana went one-and-done on the ballot. But I’m hopeful that time is on deGrom’s side here. Santana was knocked off the ballot in the 2018 election, and the demographics of BBWAA members who stick around long enough to earn a Hall of Fame vote have changed a lot over the last decade. In fact, the BBWAA didn’t open up membership to internet-based writers — a group that tends to be more versed in analytics — until after the 2007 season, and many of these stathead members couldn’t vote when Santana was eligible. That will be different by the time deGrom hits the ballot in roughly eight or so years.
By then, it’ll be nearly 20 years of writers seeing starter workloads change, and maybe voters will have figured out how to account for the fact that the role of a starting pitcher is very different in the 2020s than it was in the 1990s, let alone in the days of Old Hoss Radbourn. The trio of former Cy Young winners in their 40s — Justin Verlander, Max Scherzer, and Zack Greinke — will likely be in Cooperstown by the time deGrom hits the ballot. Clayton Kershaw is only three months older than deGrom, but considering the Dodgers icon debuted six years earlier, it feels all but guaranteed that he will be the first of the two to retire, meaning he will also enter the Hall before deGrom becomes eligible. If that happens, Kershaw will be the last of his kind to be voted in by the writers, setting the stage for a new standard for starters to make it to Cooperstown. That is, unless Kershaw is to be the last-to-debut Hall of Fame starting pitcher.
I can’t imagine that will be the case, but it is true that over the next decade, the BBWAA has some interesting philosophical questions to answer about the nature of starting pitcher greatness. I’m not sure what those answers will be, but I do know that deGrom will be instrumental in determining them.
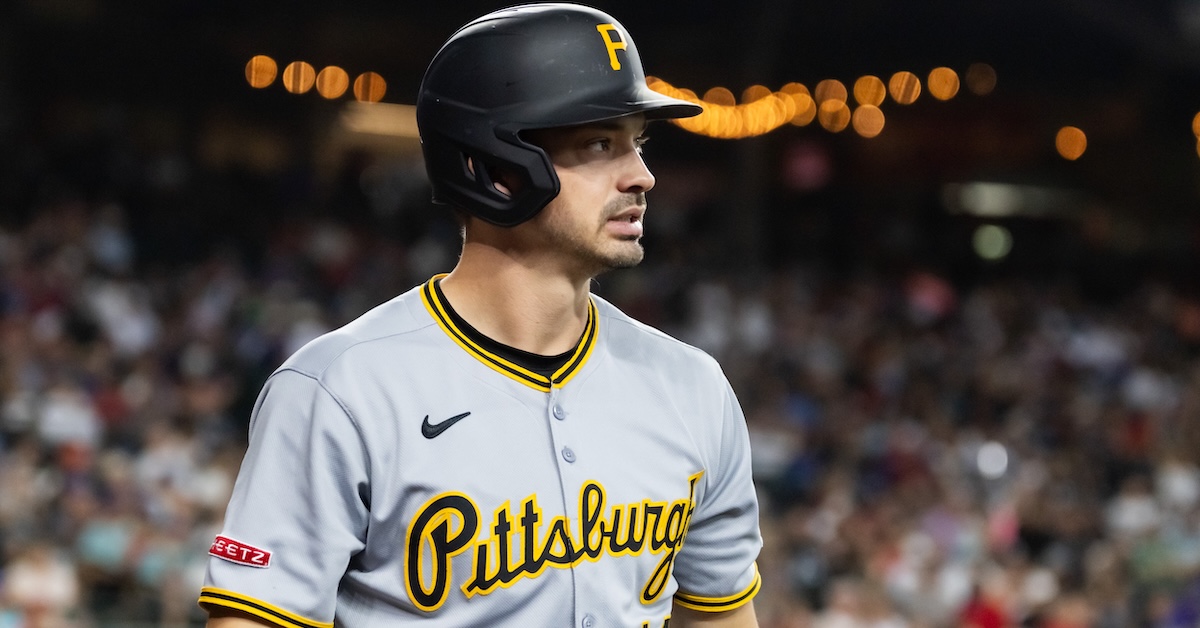
There’s no getting around the fact that the Pirates are a bad baseball team. At 54-74, they’re well on their way to their seventh consecutive losing season and ninth out of the past 10. Even so, they’ve only got the majors’ fourth-lowest winning percentage (.422) — it’s not like they’re the Rockies (.289) or the White Sox (.354). Yet it turns out the Pirates are chasing history, albeit in an under-the-radar and unflattering way. They’re in danger of becoming the first AL or NL team since the start of the 20th century to finish the season without a single hitter producing at a league-average level or better.
I don’t mean “without a single regular,” though depending upon how we define that term, that’s on the table as well. I mean anybody who’s stepped up to the plate while wearing the Pirates’ black and gold this season. The top Pirates hitters by wRC+ are infielders Nick Gonzales and Liover Peguero, both of whom are sporting a wRC+ of 98. The 26-year-old Gonzales, Pittsburgh’s regular second baseman, is hitting .278/.322/.392 through 264 plate appearances. He’s been limited to 62 games due to a fractured left ankle, caused by his fouling a ball off himself during spring training, though he played on Opening Day and even homered off the Marlins’ Lake Bachar. After hobbling around the bases, he landed on the injured list and didn’t return to the lineup until June 3. Peguero, a 24-year-old infielder, has bounced between Triple-A Indianapolis and the majors, where he’s been playing with some regularity since late July; in 58 PA, he’s hit .208/.276/.453.
Six other Pirates have a wRC+ in the 90s:
| Player | PA | AVG | OBP | SLG | wRC+ |
|---|---|---|---|---|---|
| Liover Peguero | 61 | .214 | .279 | .446 | 98 |
| Nick Gonzales | 272 | .281 | .324 | .391 | 98 |
| Tommy Pham | 340 | .263 | .335 | .373 | 97 |
| Spencer Horwitz | 298 | .257 | .326 | .375 | 95 |
| Joey Bart | 272 | .248 | .353 | .321 | 95 |
| Andrew McCutchen | 441 | .238 | .328 | .368 | 95 |
| Bryan Reynolds | 517 | .245 | .304 | .402 | 94 |
| Oneil Cruz* | 454 | .207 | .304 | .398 | 92 |
| 12:01 |
: Hello from sweaty, stormy Tempe where we’ve had a weird mix of 110+ degree heat and moisture the last few days. There were several heat-related incidents with players at Bridge Camp yesterday. Looks like it’s going to break next week and our weather patterns will change.
|
| 12:02 |
: Let’s get to your questions, might be a shorter chat this week as the only game in town is west valley today, which means a longer commute for you friendly neighborhood prospect writer.
|
| 12:02 |
: Minnesota going to keep Abel and Bradley in the minors to lose every game?
|
| 12:04 |
: Their deadline was the only one that felt like a true, complete bottoming out, so maybe? I can see them wanting to give Zebby all the runway, but Urena and Hatch idk. Did Hatch tweak something in Japan they want to see vs MLB hitters for an extended spell? Trying to take the most generous read of the situation but yeah they might just be tanking. Which, ok.
|
| 12:05 |
: Do the Braves have a chance to have more than one(Didier Fuentes) Top 100-ish prospects for 2026?
|
| 12:06 |
: Ritchie’s had a good year and held his stuff even though his innings load has doubled. Will they be as aggressive with him as the other young arms, or will they be gun shy because AJSS and Fuentes were clearly undercooked?
|
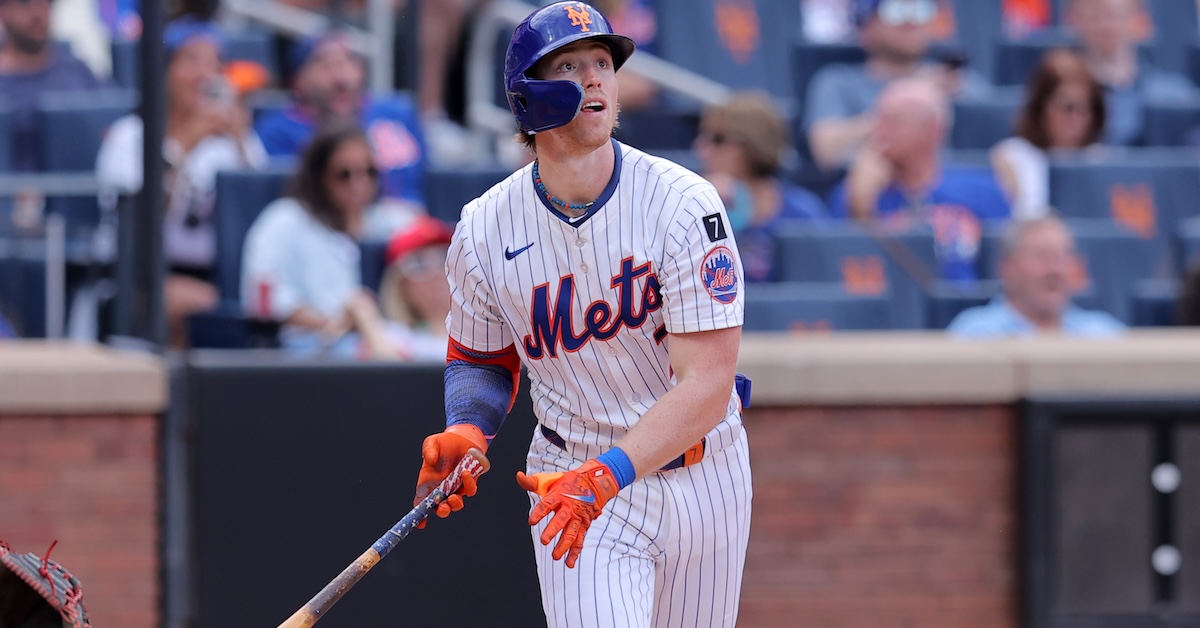
We spend a lot of time here at FanGraphs writing about breakouts. A player who’s suddenly figured it out represents both an exciting piece of news and a chance to dive into the nuances of pitching or hitting. Reading and writing about that subject so often makes you pick up on certain patterns. Today, our subject is Mets infielder Brett Baty, who hasn’t played enough to qualify and who hasn’t broken out in a big way, yet who is fascinating because his breakout doesn’t quite match the patterns we’re used to seeing.
A former 55 FV prospect who ranked 19th on our 2023 Top 100 list, Baty came into the season with a 71 wRC+ over three seasons and 602 total plate appearances. He’s 25, and he’s had an up-and-down career, mashing his way up the Mets system and then struggling upon his promotion to Flushing. He’s got an .889 OPS in the minors and .654 in the majors. If you were to ask a Mets fan what Baty needed to do in order to succeed this season, they probably would have said he needed to put the ball in the air more and he needed to stop striking out so much.
Over 326 plate appearances this season entering play Thursday, Baty has 15 home runs, matching his career total from the start of the year, and a 107 wRC+. These are huge improvements. But he’s done that despite continuing to strike out too much and running a career-low launch angle. That’s not the only mystery. Baty is hitting the ball harder, going from an average exit velocity of 88.8 mph from 2022-24 to 90.8 mph in 2025. Adding two ticks of EV is huge. His hard-hit rate has also jumped from 40% to nearly 47%. But once again, his increased contact quality doesn’t fit the patterns we’re used to seeing. Read the rest of this entry »