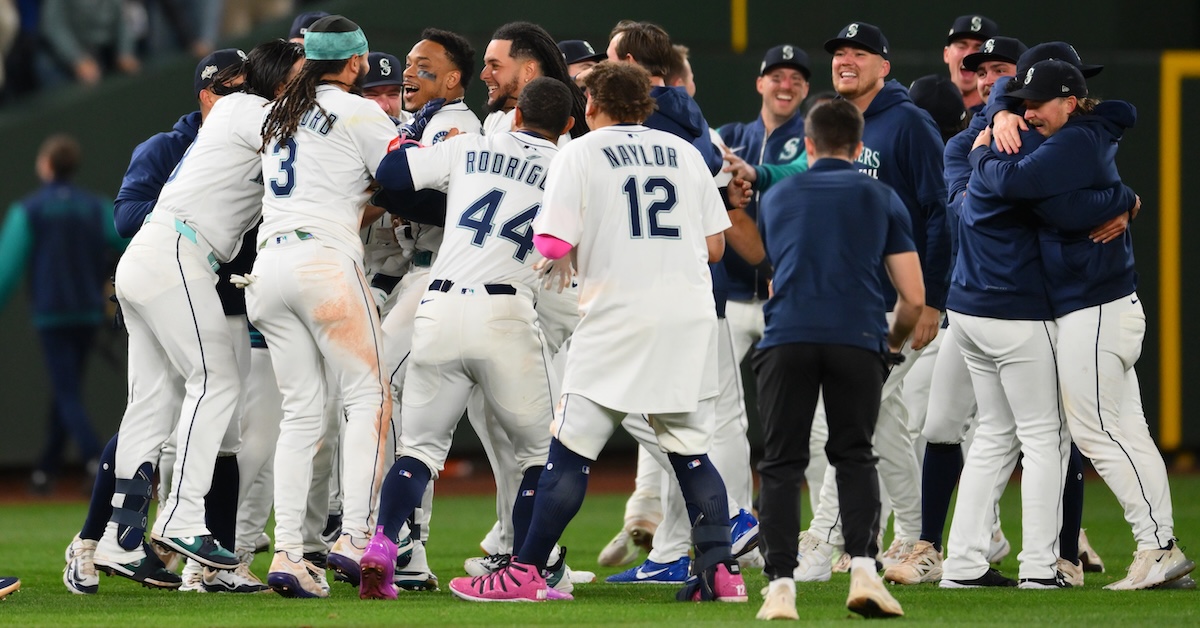
Raleigh, Polanco, and Miller Come up Big as Mariners Notch Efficient Win Over Blue Jays in ALCS Game 1
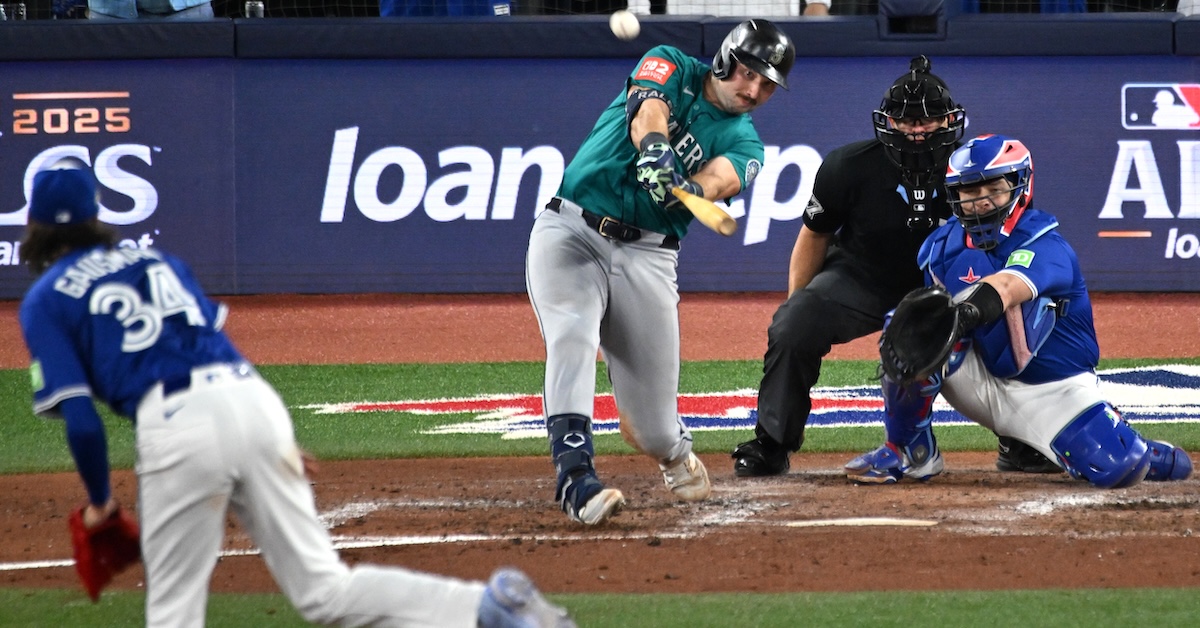
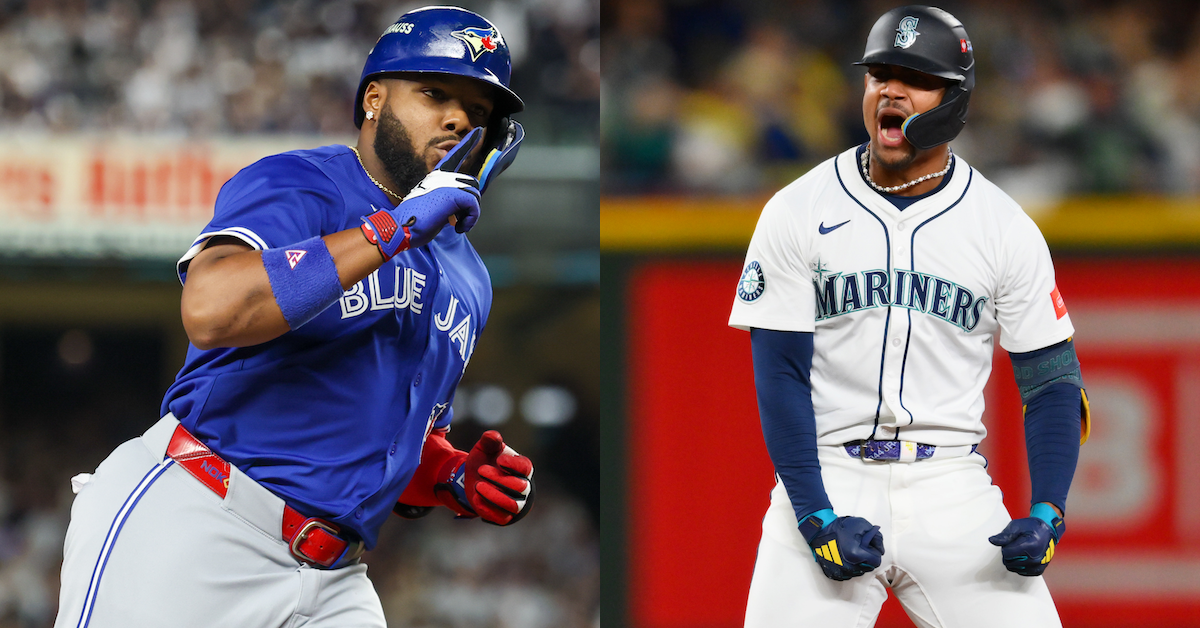
Jorge Polanco played the hero on Friday night, ending the epic Division Series Game 5 with an RBI single in the 15th inning off the Tigers’ Tommy Kahnle. Two nights later, in the American League Championship Series opener in Toronto, Polanco added to his October highlight reel with a pair of late-inning RBI singles against Blue Jays relievers, the first of which gave Seattle the lead. The switch-hitting second baseman wasn’t the only Mariner who came up big, as Bryce Miller tossed six strong innings on three days of rest, Cal Raleigh clubbed a game-tying solo homer, and three relievers turned in perfect innings as the Mariners took Game 1 in Toronto, 3-1.
In marked contrast to the four-hour and 58-minute Division Series finale that allowed Seattle to advance, this was a comparatively concise and fast-paced game, completed in two hours and 48 minutes. After throwing 209 pitches to the Tigers on Friday night, the Mariners mercifully needed just an even 100 pitches to dispatch the Blue Jays while giving up just two hits.
For as compelling a matchup as an ALCS pitting the two 1977 expansion teams — one seeking its first World Series berth in 32 years, the other its first-ever pennant — the pairing of Blue Jays starter Kevin Gausman against Miller appeared to be a mismatch based on their respective arcs. Coming off a strong regular season and a stellar Division Series Game 1 start against the Yankees, and with seven days of rest under his belt, Gausman appeared to have quite the advantage on Miller, who scuffled this year due to injuries, took an early exit in his Division Series Game 4 start against the Tigers, and started on Sunday only because ALDS Game 2 starter Luis Castillo and Game 3 starter Logan Gilbert were both called upon in relief during the extra innings of Game 5. Read the rest of this entry »