Cade Horton hasn’t simply been one of the best rookie pitchers in MLB this year, he has been one of the better starters in the senior circuit. The 24-year-old Chicago Cubs right-hander has a record of 11-4 to go with a 2.66 ERA and a 3.53 FIP over 115 frames. Moreover, he boasts a 0.93 ERA over his last 11 starts. In Triple-A to begin the season — his Cubs’ debut came on May 10th — Horton is now poised to start for Craig Counsell’s club in October,
My colleague Michael Baumann wrote about the 2022 first-rounder just over a month ago, but given his continued success, and with the postseason looming, another article seemed in order. Already well-informed on his background and arsenal, I asked Horton about the approach he takes with him to the mound.
“I’m a guy that is going to go out there and fill up the zone,” the erstwhile Oklahoma Sooner told me prior to a recent game at Wrigley Field. “I really just try to get outs and put my team in a good position to win. I’m a competitor, so I’m attacking the strike zone.”
Attacking the strike zone is, in many ways, akin to pitching to contact — more of an old-school approach to pitching — whereas in today’s game, chasing swing-and-miss is most often the goal. Given his high-octane heater and overall plus stuff, is he not looking to miss bats? Read the rest of this entry »
I promise, I didn’t plan to write about the 2019 Diamondbacks in back-to-back editions of this column. That year was Ketel Marte’s breakout season, and also the year they traded Zack Greinke to the Astros at the trade deadline, but otherwise, they were a mostly forgettable team. Not bad by any means — Arizona finished 85-77, second in the NL West — but nowhere near notable enough to be remembered in consecutive weeks of the same column six years later.
And yet, isn’t that the beauty of this mailbag? This is the space for you to ask any and all baseball questions that pop into your head, no matter how silly or irrelevant they may be. And as far as we’re concerned here, the 2019 Diamondbacks might just be one of baseball’s more relevant irrelevant teams. I mentioned them last week because they were the team that Gerardo Parra was pitching against on August 3 when he became the third player ever to allow five or more runs without recording an out in his only career pitching appearance.
But before we get to the 2019 Diamondbacks in this week’s installment of the mailbag, I’d like to remind all of you that while anyone can submit a question, this mailbag is exclusive to FanGraphs Members. If you aren’t yet a Member and would like to keep reading, you can sign up for a Membership here. It’s the best way to both experience the site and support our staff, and it comes with a bunch of other great benefits. Also, if you’d like to ask a question for an upcoming mailbag, send me an email at mailbag@fangraphs.com. Read the rest of this entry »
As much as I love coverage of Shohei Ohtani, Aaron Judge, or Cal Raleigh, talking about the absolute best players in the league can be a bit too rich, like trying to eat an entire plate of fudge in a single sitting. Since so many baseball arguments revolve around who is going to win an award or who is the best at something, I feel there’s a bit of a weird tendency for the next tier of players — those who are having great seasons but are likely to fall short of winning a major award, even if they end up as finalists — to get surprisingly little coverage relative to the big dogs (or dumpers). So, in the interest of improving the coverage-to-awesomeness ratio for baseball’s next-best guys, here are the most interesting players on the edges the awards conversation. I’ll also throw in some updated long-term projections because, as Chekhov’s projection system states, if ZiPS is on the mantle in the first act, it should be run at some point. Stats are through Wednesday’s games unless otherwise noted. Read the rest of this entry »
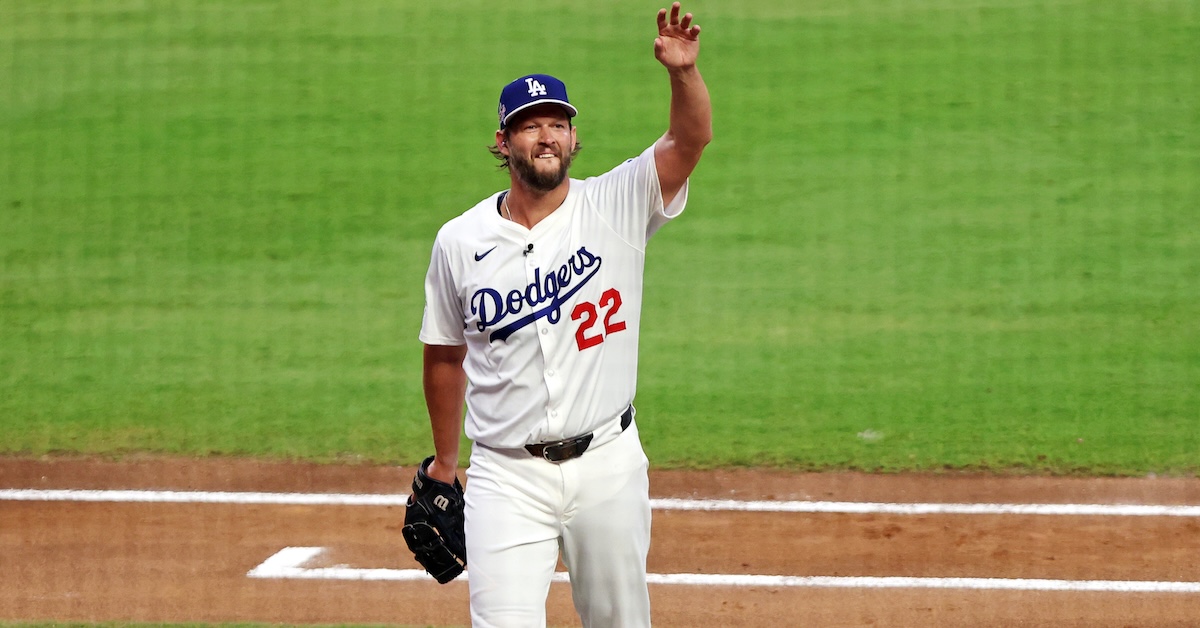
The end of an era is coming to Los Angeles. On Thursday at Dodger Stadium, Clayton Kershaw announced that he will retire at the end of this season, and thus will make the final regular season home start of his career on Friday night. The news isn’t exactly a surprise, given that the 37-year-old lefty has been working more or less year-to-year while occasionally musing about retirement since his three-year, $39 million contract expired after the 2021 season. When Kershaw notched his 3,000th strikeout on July 2, it was generally understood as the final major milestone of his illustrious 18-year career that will one day be celebrated in Cooperstown. Just days later, commissioner Rob Manfred named him to the NL All-Star team as a “Legend Pick.”
On Thursday morning, Kershaw sent a group text to his teammates, telling them of his decision to retire. Teammates Freddie Freeman and Max Muncy both revealed that the pitcher had told them of his plans about a month ago, but swore them to secrecy. On Thursday afternoon, the Dodger released a statement regarding the iconic southpaw’s impending announcement.
At his press conference, Kershaw expressed measures of gratitude and relief, his voice occasionally cracking as he thanked the organization and his family. He said that he and his wife Ellen had been discussing his retirement all year. “Usually we wait until the offseason to make a final call, but almost going into this season, we kinda knew this was going to be it,” he said. “So [I] didn’t want to say anything in case I changed my mind, but over the course of the season, how grateful I am to have been healthy and out on the mound, being able to pitch, I think it just made it obvious that this was a good sending-off point.”
With 222 career victories, 3,039 strikeouts, 11 All-Star selections, five ERA titles, three Cy Young Awards (2011, ’13, ’14), an MVP award (2014), a Pitching Triple Crown (2011), a no-hitter (June 18, 2014), and two World Series rings (2020 and ’24), Kershaw is a surefire first-ballot Hall of Famer who will be eligible for election on the 2031 BBWAA ballot. He is 20th all-time in S-JAWS, second among active pitchers behind Justin Verlander, who has one more point (66.1 to Kershaw’s 65.1) in about 700 more career innings. Kershaw’s 2.54 ERA is the lowest of any integration-era pitcher with at least 2,500 innings:
If you’re wondering about the rankings of another three-time Cy Young-winning Dodgers lefty, Sandy Koufax pitched to a 2.76 ERA and 75 ERA- in 2,324 1/3 innings; at a 2,000-inning cutoff, he would rank fourth in ERA and seventh in ERA-. Kershaw is tied with outfielder Zack Wheat and shortstop Bill Russell for the most seasons played with the Dodgers (18), and he holds the franchise records for strikeouts and pitching WAR (78.7 fWAR, 77.6 bWAR) while ranking second in wins only to Don Sutton (233).
After reaching free agency following the 2021, ’22 and ’23 seasons, Kershaw mulled the possibility of leaving the Dodgers to sign with the Rangers, his hometown team. But between his various offseason rehabilitation programs, the 2021–22 owners’ lockout, and the Rangers’ financial uncertainty regarding their cable television deal, staying with the team that drafted him out of Highland Park High School with the seventh pick in 2006 — a round that accounts for eight Cy Youngs between Kershaw, 10th pick Tim Lincecum, and 11th pick Max Scherzer — always made more sense. When he reported to Camelback Ranch in February, Kershaw admitted that he may have previously undervalued the possibility of spending his entire career with the Dodgers:
“I don’t think I put enough merit on it at times, what it means to be able to be in one organization for your entire career. You look at people throughout all of sports that have been able to do that, and it is special, it is. I don’t want to lose sight of that. Getting to be here for my whole career, however long that is, is definitely a goal.”
It’s been an amazing run in Los Angeles. Kershaw first turned heads during spring training in 2008. In a March 9 Grapefruit League game against the Red Sox, 10 days short of his 20th birthday, he threw a curveball that buckled the knees of Sean Casey and awed broadcaster Vin Scully, whose nickname for that big-bending pitch stuck: “Ohhh, what a curve ball! Holy mackerel! He just broke off Public Enemy Number One. Look at this thing! It’s up there, it’s right there, and Casey is history.”
Kershaw began that season at Double-A Jacksonville, making 11 starts before being called up to debut against the Cardinals on May 25, 2008. In his prime, he pumped his fastball in the mid-90s — it averaged 95.0 mph in his rookie season, and was still at 94.3 mph as of 2015 — but that famous curveball and its similarly devastating cousin, his slider, are the pitches that have earned him a spot in the pantheon. According to Baseball Savant — which covers the entirety of his career via PITCHf/x and Statcast — batters have hit .145 and slugged .216 with a 36.5% whiff rate against his curve, and hit .183 and slugged .292 with a 38.8% whiff rate against his slider; the former was strike three 753 times, the latter a jaw-dropping 1,332 times.
Though he flirted with adding a changeup here and there, and over the past three seasons has dabbled with an effective splitter, Kershaw’s three-pitch combination, coming from an extremely over-the-top arm slot (62 degrees as of 2020, the first year of Statcast’s measurements in that area, and 56 degrees as of this season), with a familiar hesitation at the top of his delivery, was enough to befuddle batters. His .211 batting average allowed is the second lowest at the 2,500-inning cutoff since integration, nestled between Nolan Ryan (.204) and Martínez (.214), while his 65 OPS+ allowed is second to Martínez’s 61, ahead of Clemens’ third-ranked 68. That dominance drove his success, and that of the Dodgers, for the better part of the past two decades. If the team holds on to win the NL West this season, it will be its 14th division title in his 18 seasons, and its 15th playoff berth.
Kershaw’s announcement comes at a time when he has begun to scuffle a bit; over his last three starts, he’s yielded 10 runs and walked nine in 13 2/3 innings, and he hasn’t lasted six innings since his August 15 start against the Padres — a memorable outing in which he helped the Dodgers halt a four-game losing streak and reclaim a share of first place in the NL West. Even so, he has generally pitched well this season despite working with a fastball that has averaged just 89 mph, topping 90 only a handful of times per start.
After undergoing a pair of offseason surgeries — one to repair the torn meniscus in his left knee, the other to remove a bone spur and repair a ruptured plantar plate in his left foot — Kershaw didn’t make his season debut until May 17. But aside from a start skipped just before the All-Star break, he’s taken the ball on turn, though almost always with five or six days of rest. In 102 innings, he’s pitched to a 3.53 ERA and 3.59 FIP, offsetting a career-low 17% strikeout rate by holding batters to a 4.1% barrel rate and generally avoiding the long ball. The solo homer he allowed to the Padres’ Ramón Laureano in that August 15 outing is the only one he’s served up in his last 60 1/3 innings dating back to July 2. That was the night he struck out Vinny Capra of the White Sox with the 100th and final pitch of his night — a slider on the outside edge of the plate, naturally — to give him an even 3,000 for his career.
That strikeout made Kershaw the 20th pitcher to reach 3,000 but just the fourth left-hander, after Steve Carlton, Randy Johnson, and CC Sabathia. While Kershaw was the fourth-fastest pitcher to reach the milestone in terms of innings pitched, getting there turned into quite a slog due to his injuries, which have prevented him from making 30 starts in any season since 2015 and sent him to the injured list at least once in every season since.
Kershaw finished the 2021 season, his age-33 campaign, needing just 330 strikeouts to reach 3,000, which based on his 2019–21 performances looked doable across a pair of 25-start seasons. While he pitched his way onto the NL All-Star teams in both 2022 and ’23, with ERAs of 2.28 and 2.46, he totaled just 46 starts and 274 strikeouts in that span, leaving him 56 strikeouts shy of the magic mark. With last season bracketed by his recovery from November 2023 surgery to repair the glenohumeral ligaments and capsule of his left shoulder on one side, and the aforementioned left leg surgeries on the other, he made just seven starts totaling 30 innings, with just 24 strikeouts. He was not on the active roster during the Dodgers’ run to a championship, and at the team’s victory parade in Los Angeles, he exclaimed, “I didn’t have anything to do with this championship, but it feels like I have the best feeling in the world — that I get to celebrate with you guys!”
As for what comes next for Kershaw after Friday’s start, it’s not yet clear. Barring an injury, he will almost certainly be on the postseason roster, but unlike the past two Octobers, the Dodgers are headed toward the playoffs with their best starters healthy and effective. Indeed, since the All-Star break, the Dodgers have the majors’ best rotation in terms of both ERA (3.27) and FIP (2.99); the latter mark is nearly three-quarters of a run better than that of the second-ranked Phillies (3.70). Every starter but Kershaw is missing bats galore:
Dodgers Starting Pitchers Since the All-Star Break
*Includes two bulk relief appearances totaling eight innings.
There’s no question that Glasnow, Snell, and Yamamoto will start for the Dodgers this October, and all signs point to Ohtani being the fourth. The team has kept the two-way superstar on a short leash in his first season back from his second UCL reconstruction surgery; only twice has he reached the five-inning mark or gone past 70 pitches. Though the Dodgers have considered the possibility of using Ohtani in relief à lathe 2023 World Baseball Classic championship game, that prospect is complicated by the fact that removing him would cost the team its designated hitter spot — thus requiring Ohtani to play the outfield in order to remain in the game, something he hasn’t done since 2021. Manager Dave Roberts all but shut that alternative scenario down earlier this week, saying in part, “[T]o think that now it’s feasible for a guy that’s just coming off what he’s done last year, or didn’t do last year, to then now put him in a role that’s very, very unique… You potentially could be taking on risk, and we’ve come this far, certainly with the kid gloves and managing.”
As for the other two starters, Sheehan has been brilliant lately but may face an innings cap given in his first year back from Tommy John surgery. Both he and Kershaw could be used as multi-inning relievers, possibly able to go three or four innings after a starter goes five or six, which would help to mitigate a bullpen that’s been torched for a 5.43 ERA this month. “I feel that there’s a place for him on our postseason roster,” Roberts said of Kershaw on Thursday. “I don’t know what role, but I think that the bottom line is, I trust him. And so, for me, the postseason is about players you trust.”
The postseason has often been a fraught subject when it comes to Kershaw. His 4.49 ERA in October is nearly two full runs higher than his regular season mark, and his 3.81 postseason FIP nearly one run higher than his regular season one (2.85), with his home run rate almost doubling, from 0.74 to 1.39. At times he’s been let down by his offenses and his bullpens, as is the case for just about every starting pitcher given enough opportunities. At times he’s been let down by his managers; think Don Mattingly leaving him in to allow eight seventh-inning runs in the 2014 Division Series opener against the Cardinals. At times he’s been let down by his opponents’ skullduggery and his own hubris; in the wake of commissioner Rob Manfred’s investigation into the Astros’ 2017 sign-stealing scheme, Kershaw expressed regret in early 2020 that he didn’t heed warnings to change signs with a runner on second base in Game 5 of the World Series, during which he allowed six runs. And of course, at times Kershaw has been let down by his own failing body; he retired just one out of eight Diamondbacks in the Division Series opener in 2023 while pitching through the shoulder issues that led him to undergo surgery less than a month later.
While his postseason heroics never reached the level of a Gibson or a Madison Bumgarner, Kershaw has had some shining moments in October. He made a dominant pair of starts against the Braves in the 2013 Division Series, allowing one earned run in 13 innings. He came out of the bullpen on one day of rest to record a two-out save in Game 5 of the 2016 Division Series against the Nationals, after closer Kenley Jansen had thrown 2 1/3 innings; Kershaw followed that with seven shutout innings against the Cubs in Game 2 of the NLCS. He struck out 11 while allowing one run and three hits in seven innings against the Astros in the 2017 World Series opener at Dodger Stadium, where Houston’s notorious trash cans were out of reach. He spun eight shutout innings with 13 strikeouts against the Brewers in the 2020 NL Wild Card Series clincher, and authored two gutty wins in that year’s World Series against the Rays, the second of which, in Game 5, came after Tampa Bay’s bizarre walk-off win in Game 4 and set up the Dodgers’ chance to clinch.
Regarding Kershaw’s career, one other blemish can’t escape mention. Twice in the past three seasons, he has upstaged the Dodgers’ annual LGBTQ Pride Night, and it’s cost him some amount of goodwill. In 2023, he publicly pressured the Dodgers to rescind an invitation to the Sisters of Perpetual Indulgence, a drag troupe that describes itself as a “leading-edge Order of queer and trans nuns.”
The Dodgers at first heeded the calls of Kershaw and others to disinvite the Sisters, only to reverse course after they received backlash for canceling on them. But Kershaw’s comments did force the team to accelerate its announcement of its Christian Faith and Family Day, for which the pitcher served as the primary organizer. “This has nothing to do with the LGBTQ community or Pride or anything like that,” he said at the time. “This is simply a group that was making fun of a religion — that I don’t agree with.”
It might have been easier for some to overlook Kershaw’s reaction to the Sisters as an isolated incident had it not been for this year’s Dodgers Pride Night on June 13, when Kershaw altered his cap, which featured the team’s interlocking LA filled in with the colors of the rainbow. On it, he wrote “Gen. 9:12-16,” an Old Testament verse that, as Michael Elizondo at True Blue LA notes, has been “frequently used by homophobic Christians to denounce the LGBT community as their appropriation of the rainbow is allegedly blasphemous.” On a night meant to celebrate diversity, Kershaw instead chose a message of defiance and intolerance.
Particularly in these politically polarizing times, with LGBTQ+ rights under daily attack by the Trump administration, Kershaw’s move was divisive and disappointing, but it went unchallenged on the Dodgers beat even as the photo of him wearing the altered hat wentviral. As best I can tell, he’s never publicly commented on the matter, so if a picture is worth a thousand words, he’s left that image to be his statement on the subject without offering any alternative interpretations. Three months later, the cap controversy was still being referred to on social media as news of Kershaw’s retirement announcement began to circulate.
Kershaw is not without his imperfections, his impact in the game not without complication. Inarguably, he has defined one of the most fruitful eras in Dodgers history while carving his own niche, not only as one of the best pitchers of his generation, but of all time. His public persona has been marked by his charitable foundation, Kershaw’s Challenge, which according to its web page has raised $23 million “to support at-risk children and families around the globe,” as well as his comments denouncingracial injustice in June 2020, in the wake of the murder of George Floyd. Yet it also carries with it his Pride Night remarks and protest at a moment of profound vulnerability for the LGBTQ+ community. To appreciate Kershaw’s immense legacy is to view him in his totality, the greatness, the disappointments, and everything in between, all taken together.
Eric A Longenhagen: Good morning, everyone. I just got back from visiting family in PA and am looking forward to starting the mental lawnmower again. Let’s get to as many of your questions as possible in the next hour-ish.
12:01
Taker55: Can Spencer Jones fake it in CF enough for the Yankees to run him out there next year? The price tags for Grisham and Bellinger go up by the week.
12:03
Eric A Longenhagen: I think you add him to the 40-man but need redundancy at the position in case he can’t make enough contact to be good. They should try to re-sign one of those guys or seek an alternative option. I don’t think it’s advisable to just hand the job over to a guy striking out as much as Jones does with no other option.
12:04
Rob: With Lara getting promoted today, what looks good with him despite the awful AAA numbers?
12:04
Eric A Longenhagen: This is Jhancarlos Lara, btw. He throws really, really hard. I wouldn’t add him if you’re in your fantasy championship series or anything, he’s too wild to trust in that way.
12:04
Pudge: How much has your view on Connelly Early shifted in the last couple weeks?
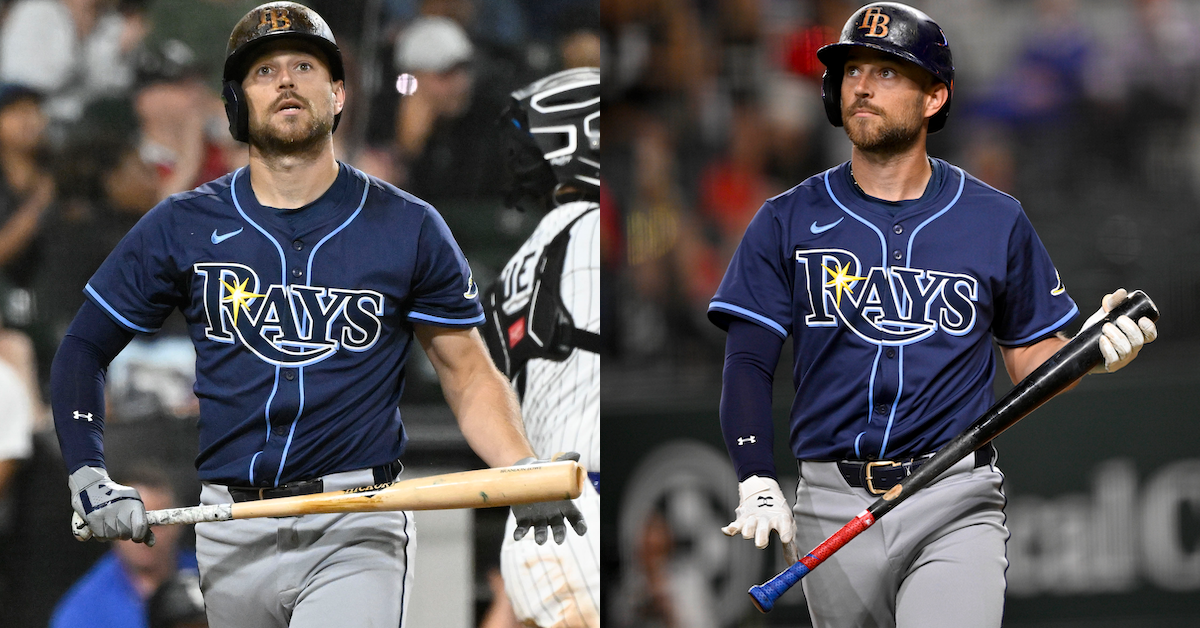
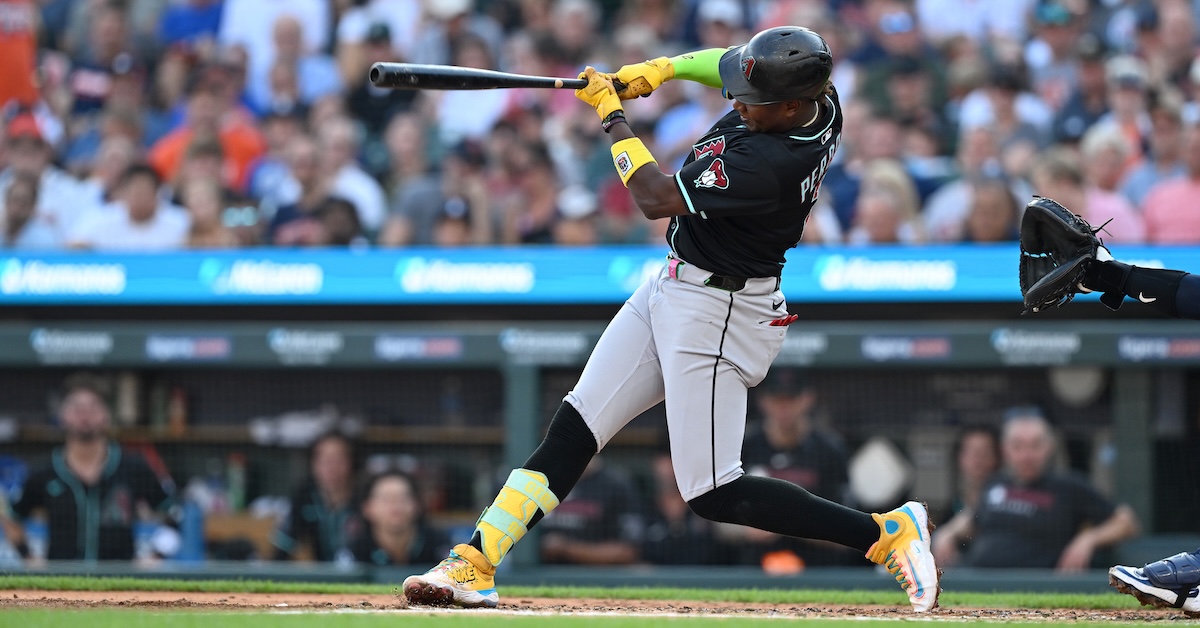
It sure seems like the Diamondbacks knew something the rest of us didn’t. Back in February, when Arizona signed shortstop Geraldo Perdomo to a four-year contract extension to keep him around through the 2029 season, I wrote, “I think the Diamondbacks are paying for floor rather than ceiling. However he gets there, if Perdomo keeps performing like a two-win player, the contract will work out well for both sides.” Perdomo was coming off a knee injury and two straight seasons of absolutely average offensive performance. It may have looked like the Diamondbacks were comfortable with that level of production, but the 2025 season has put things in an entirely new light.
Perdomo has been unequivocally one of the best players in baseball. He leads all National League position players in bWAR, and if not for Shohei Ohtani, he would have a very good argument for the MVP. Geraldo Perdomo, whom I first wrote about because he was a great test case for players with extremely low exit velocities. Geraldo Perdomo, whose offensive approach I summed up earlier this year as, “Try with all your might to avoid swinging.” Geraldo Perdomo, whose 12th-percentile hard-hit rate represents a career-high! That guy has 6.7 WAR. That guy has 19 home runs after coming into this season with a combined 14 for his major league career, which began in 2021. That guy is running a 138 wRC+ and none of the advanced numbers is saying it’s because of batted ball luck. Perdomo really has been a great hitter. We’ve been all over the story. Michael Baumann has written about him twice, I’ve broken down his breakout and documented one of his trademark swingless plate appearances. Now that October is near, we need to acknowledge how big a deal it is that Perdomo has kept this going all season long.
Perdomo has gotten bigger and stronger. He’s changed his mechanics from both sides of the plate. He’s somehow chasing and whiffing even less than he did last season, and he’s somehow doing so while lifting the ball more, swinging a bit harder, and hitting the ball a bit harder. We’ve broken down all those points in the articles I linked to above, so I’m not going cover that ground again. I’m here to show you one graph that cracks me up.
This is from the last paragraph of my article back in February: “I am so, so curious to see what it would look like if Perdomo were to start attacking the ball. He’s still young, and I really do think it’s possible that he has the capacity to be more than an average hitter.” I’m not trying to say I called this. I definitely did not. One sentence later, I wrote “Still, I don’t think we should expect that going forward.” But Perdomo really did start attacking the ball in his own way, so I can now show you what it looks like.
In terms of average exit velocity, it doesn’t look like all that much. He’s running a career-high 87.6 mph, up half a tick from last season. That’s still only enough to put him in the 19th percentile. However, you know better than to just look at average EV and call it a day. His 90th-percentile exit velocity jumped from 100.4 mph to 101.5. That’s a bigger jump, but in terms of percentiles, it only moves him from the 14th to the 18th. So, uh, that doesn’t look like that much either.
It’s impressive that Perdomo can swing harder, lift the ball more with a steeper swing, and maintain his absurdly high contact and squared-up rates. Regardless of where you’re starting out, that’s not normally how things work. But it’s also not enough to earn him respect. For all the reasons in the previous paragraph, pitchers still aren’t afraid of Perdomo, like at all. He ranks fifth among qualified players in zone rate. He’s seen 873 pitches over the heart of the plate. That’s the most in the game, and nobody else is even close. But Perdomo has the best hard-hit rate of his career by a wide margin, and that does matter. He’s never going to break the power scale, but let me show you Tom Tango’s graph for the thousandth time.
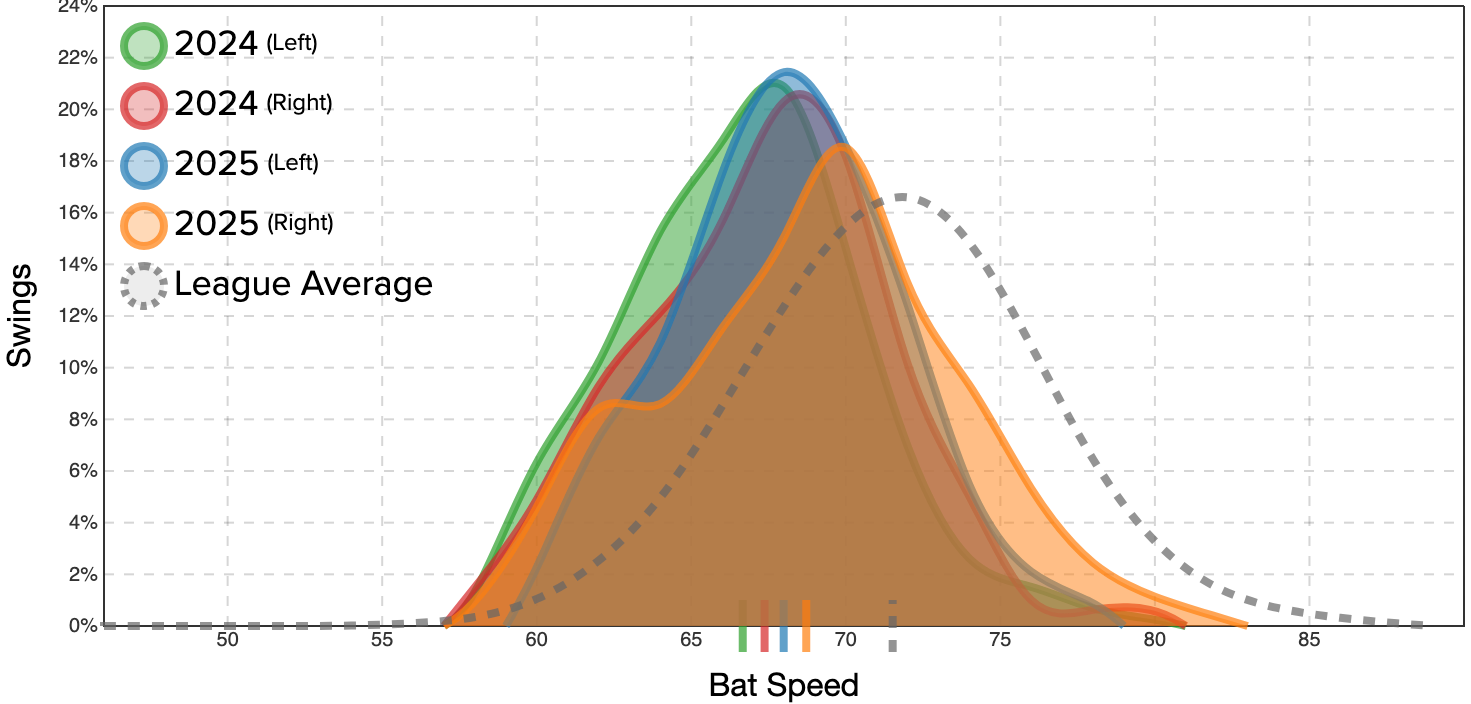
Going from a 25.8% hard-hit rate to a 31.5% hard-hit rate means crossing that threshold way more often. Even if you’re just barely crossing it, it’s still a big deal. There are way more hits on the right side of the line. The odds have changed on all those pitchers who are content to let Perdomo put the ball in play. Perdomo is still not a big, powerful guy, but he’s got a new A-swing. Here’s Baseball Savant’s distribution graph of his bat speed. This is for all swings.
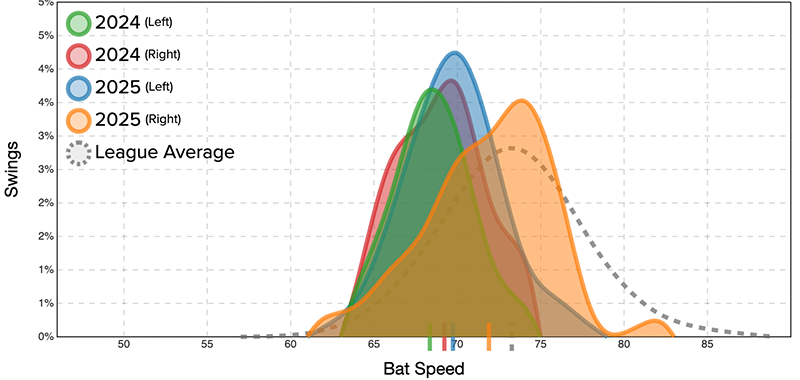
Perdomo’s right-handed numbers from the 2025 season are in orange in the front. It’s still not as fast as the dotted line that represents the league average, and even though its peak is more than 1 mph higher than the peaks of the previous seasons, its shape doesn’t look all that different. It’s just that the tails on either side are fatter. That’s really noticeable on the left of the graph. Perdomo isn’t taking fewer super-weak, 57-63 mph swings than he did in previous seasons. What he’s cut down on are the medium-speed swings, and he’s getting off more fast swings than ever before. In other words, when he knows he has a chance to hit the ball hard, he’s making sure he does it. I know that looks pretty subtle here, and the difference between the green and blue areas that represent his 2024 and 2025 stats batting left-handed is even smaller. But now we’re getting to the graph I really want to show you, the one that has me cackling. Here’s the same exact thing, except it only shows the swings that result in hard-hit balls.
Well that’s different! Look how far the 2025 distributions are from the 2024 ones. The blue left-handed peak is roughly 2 mph faster than it was in 2024, and the orange right-handed peak is 5 mph faster! All of a sudden, Perdomo is getting his getting his money’s worth. He’s still happy to take a slow swing and put the ball in play – that’s why the tail on the left side of even this graph extends farther than in any of the previous seasons. But not only is he kicking into high gear more often, it’s a higher gear than he ever had before. Perdomo still doesn’t have the top-end bat speed to keep up with the league average on the right side of the chart, but he’s way above that dotted distribution line until we get to 77 mph or so. He’s more than doubled his fast-swing rate from 2024. That’s what it looks like when Perdomo starts attacking the ball, and it’s even more fun than we could’ve hoped.
Author’s note: “Five Things I Liked (Or Didn’t Like) This Week” is taking a short break, but will return next Friday for the end of the regular season.
Earlier this week, I did the sabermetric equivalent of eating my vegetables by testing the accuracy of our playoff odds projections. I found that our odds do a pretty good job of beating season-to-date odds (particularly late) and pure randomness (particularly early, everything does pretty well late). It’s good to intermittently check in on the accuracy of our predictions. It’s also helpful to build a baseline as a benchmark to measure future changes or updates against.
Those are a bunch of solid, workmanlike reasons to write a measured, lengthy article. But boring! Who likes veggies? I want to beat the odds, and I want to flex a little mathematical muscle while doing it. So I goofed around with a computer program and tried to find ways to recombine our existing numbers to come up with improved odds built by slicing up existing ones. It didn’t break the game wide open or anything, but I’m going to talk about my attempts anyway, because it’s September 19, there aren’t many playoff races going on, and you can only write so many articles about whether the Mets will collapse or if Cal Raleigh will hit 60 dingers.
What if you just penalized extreme values?
I first tried to correct for the fact that early-season projection-based odds (which I’m calling FanGraphs mode for the rest of the article) seem to be too confident and thus prone to large misses. I did so by applying a mean reversion factor that pulled every team’s values toward the league-wide average playoff chances (i.e. how many teams made the playoffs that year). This method varies based on the current playoff format; we have 16-team, 12-team, and 10-team samples in the data, and I adjusted each appropriately. I set the mean reversion factor so that it was strong early in the year and decayed to zero by the end of the season. Read the rest of this entry »
Ben Lindbergh and Meg Rowley banter about 2025’s record number of 25-25 players and whether the current power/speed version of the sport is rendered any less impressive by its recent rule-change origins, the historic pre/post-All-Star break splits of Julio Rodríguez and whether the Mariners can help him become less of an extreme slow starter/fast finisher (phrasing?), the lockstep seasons (and recent slumps) of Pete Crow-Armstrong and Ceddanne Rafaela, the impending retirement (and on/off-field legacies) of Clayton Kershaw, and MLB’s new Amateur Recovery Period Policy, plus follow-ups (1:21:31) on a few of those topics.
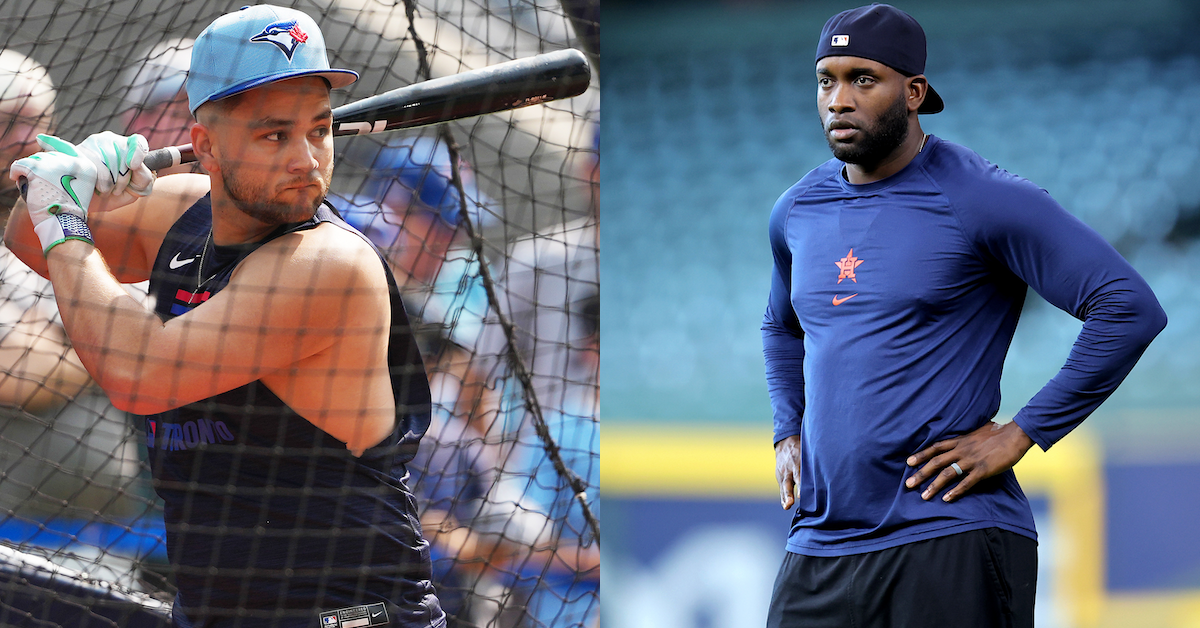
The Astros have spent nearly the entire season missing the superstar version of Yordan Alvarez, first because the 28-year-old slugger struggled during March and April and then because he missed nearly four months due to a fractured metacarpal in his right hand. He heated up upon returning to the lineup in late August, but on Monday night he sprained his left ankle, an injury likely to sideline him for the rest of the regular season and perhaps longer. He’s not the only American League star whose best hope for returning to the lineup is during the playoffs, as Blue Jays shortstop Bo Bichette has been ruled out for the rest of the regular season with a sprained ligament in his left knee.
Alvarez suffered his injury in the first inning of Monday night’s game against the Rangers in Houston. He followed Jeremy Peña’s leadoff single by drawing a walk against Jack Leiter. Carlos Correa then hit a weak comebacker toward the mound; Leiter tried to throw while on the ground but airmailed the ball far beyond the reach of first baseman Jake Burger. Peña scored easily as Adolis García retrieved the ball, but the right fielder’s throw home was nearly in time to nab Alvarez, who instead of sliding went in standing up, only to slip on home plate. He immediately began limping, had to be helped into the dugout, and did not return to the field — he started in left field — when the half-inning ended. Instead, right fielder Jesús Sánchez shifted to left and Zach Cole entered the game in right. Cole, who homered off the Braves Hurston Waldrep in his first major league plate appearance on September 12, hit his second homer off Leiter in the fifth inning of what turned out to be a 6-3 win.
“When he stepped on home plate, I had a front-row seat,” Peña said after the game. “His ankle kind of twisted, and when he had to plant again, I saw it twist again. And it’s not pretty. You don’t want to see that, especially Yordan Alvarez. We need him.”
Brandon Mann’s playing career was coming to a close when he was featured here at FanGraphs in June 2020. A southpaw whose professional experience spanned 17 seasons — including part of 2018 with the Texas Rangers — he was soon to turn from hurler to tutor. Mann served as a pitching coordinator for the KBO’s Lotte Giants in 2021, then spent the next two years as a trainer and pitching coordinator at Driveline. His last two season have been in Miami. Mann joined the Marlins as a pitching strategist in 2024, and this year he is their bullpen coach.
Given his background and expertise, as well as my being intrigued by some of the talented arms on the Miami pitching staff, I made it a point to catch up with Mann when the Marlins visited Fenway Park in mid-August. I wasn’t sure exactly what we’d talk about, but I knew that it would be a good pitching conversation. We ended up focusing on changeups and splitters.
———
David Laurila: You just told me that Edward Cabrera has a unique changeup. What makes it stand out?
Brandon Mann: “The most unique part is how hard it is [94.2 mph, per Baseball Savant]. The movement profile is similar to a sinker, although it has a little bit more depth than sinkers in general. It’s really more of the spin. Say he throws a changeup and a sinker and both are 96 [mph]. The movement profiles would be almost identical, but the changeup is going to fall off more because it’s got as much as 600 fewer rpm. That’s super unique.
“I don’t know if the movement gives it justice when you actually see… say it’s three [inches] of induced vertical break and 16 [inches] horizontal — and then he throws a sinker at six and 18. They’re the same velo, and the sinker stays up, but the changeup falls off, and somebody swings and misses at it. A lot of that is the spin component. Again, it’s similar velo, but anywhere from 500 to 600 rpm less spin. Read the rest of this entry »