
Postseason Starting Pitching Ain’t What It Used to Be, After All

If there’s a surprise about the Phillies falling one win short of a second straight trip to the World Series, it’s not that their fearsome sluggers couldn’t come up with one last big hit when needed. It’s that Philadelphia has gone fishing despite getting more out of its starting pitchers than any of the other postseason participants. Then again, you can call upon Zack Wheeler for relief in a do-or-die game, but you can’t do that every night, nor can you clone him and get an extra start per round. The reality is that any short series depends as much, if not more, on the performances of bullpens that continue to absorb an increasingly large share of the postseason innings. Regardless of those controversial decisions about whether to pull a starter who’s cruising along, eventually it comes down to which team can put out the fires in the seventh, eighth, or ninth innings of the close games.
This isn’t intended to be a “Eureka!” moment in cracking the postseason code — just a reminder as I take another spin through trends in postseason starting pitching, which I’ve been tracking annually for the last several seasons. In the broader context, last year’s rebound of starting pitcher workloads, both in the regular season and in October, may well have been an aberration.
To get back to the Phillies: Wheeler pitched at least six innings in all four of his postseason starts for the second postseason in a row, posting a 2.08 ERA and 2.37 FIP in 26 innings in that capacity. They went 3–1 in those games, losing only via a remarkable late-inning turnaround by the Braves in Game 2 of the Division Series. While Nathan Eovaldi has also turned in four efforts of six innings or more in helping the Rangers to the World Series — he’ll start Game 1 on Friday — no other starter has totaled so many such outings in a single postseason since 2019, when the Astros’ Gerrit Cole and the Nationals’ Stephen Strasburg both did so. That the latter was never the same after five starts of six innings or more is a lesson probably not lost on more recent teams.
With Wheeler, Aaron Nola, and Ranger Suárez each taking four starts and Cristopher Sánchez one, the Phillies totaled 70 innings from their starters during their run, an average of 5.38 per outing; they went 3–1 in Nola’s starts, three of which lasted 5.2 innings or more, but just 2–3 in those of the others, the longest of which was 5.1 innings. None of the other three LCS participants have coaxed even five innings per turn from their starters throughout the postseason, nor have they received run prevention that was as effective:
| Team | GS | IP | IP/GS | K% | BB% | HR/9 | ERA | FIP |
|---|---|---|---|---|---|---|---|---|
| Phillies | 13 | 70.0 | 5.38 | 28.7% | 3.4% | 0.77 | 2.19 | 2.60 |
| Rangers | 12 | 59.2 | 4.93 | 20.0% | 5.1% | 0.91 | 3.62 | 3.61 |
| Diamondbacks | 12 | 57.0 | 4.75 | 23.7% | 8.6% | 1.74 | 3.63 | 4.94 |
| Astros | 11 | 49.1 | 4.46 | 22.9% | 9.6% | 2.37 | 5.11 | 6.11 |
The Phillies had the best starting pitching across the board; even limiting the data to the NLCS, they put up a 2.78 ERA and 2.83 FIP in 35.2 innings to Arizona’s 4.45 ERA and 5.85 FIP in 32.1 innings. They also had the better numbers in the series when it came to aggregated bullpen performance, but those numbers are distorted by the 10–0 thrashing they administered in Game 2; take the six runs Arizona’s relievers allowed in 2.1 innings of that game off their ledger, and likewise the three shutout innings by Philadelphia’s relievers when the outcome was hardly in doubt, and the comparison favors the Diamondbacks. Limited to situations where the average Leverage Index was 1.0 or higher, the balance clearly tilts towards the still-alive Snakes:
| Team | Split | App | IP | K% | BB% | HR/9 | ERA | FIP |
|---|---|---|---|---|---|---|---|---|
| Phillies | NLCS all | 28 | 25.2 | 24.3% | 12.2% | 0.35 | 2.81 | 3.33 |
| Diamondbacks | NLCS all | 31 | 28.2 | 19.8% | 12.4% | 0.63 | 3.77 | 4.06 |
| Phillies | NLCS w/o G2 | 25 | 22.2 | 21.2% | 12.5% | 0.40 | 3.18 | 3.61 |
| Diamondbacks | NLCS w/o G2 | 27 | 26.1 | 23.1% | 11.5% | 0.68 | 2.05 | 3.79 |
| Phillies | NLCS Lev ≥1.0* | 15 | 12.0 | 20.3% | 15.6% | 0.75 | 5.25 | 4.67 |
| Diamondbacks | NLCS Lev ≥1.0* | 17 | 16.1 | 24.6% | 15.4% | 0.00 | 1.65 | 3.13 |
Long story short, all of those quality innings from Wheeler and company were undone by Craig Kimbrel. You didn’t need a table to tell you that, but the comparison is more stark once you see the numbers.
Moving beyond a postmortem of the Phillies and a meditation on bullpens, one looming question coming into this season was whether last year’s increase in starter workloads, both in the regular season and the postseason, would be sustained given a normal offseason cycle. Recall that following the pandemic-shortened 2020 season, teams had every reason to be concerned about pitcher injuries and ramping up workloads for ’21 — and then the transition to ’22 was complicated by a lockout-abbreviated spring training. All of that has provided teams with reasons to be wary of overtaxing their starters beyond what we’ve already leared about the times through the order penalty and the reliever advantage. Not only have we observed a sudden scarcity of 200-inning workhorses, but we’re also seeing fewer pitchers meet the threshold of one inning per team game needed to qualify for the ERA title:
| Season | Qualified | 200 IP |
|---|---|---|
| 2017 | 58 | 15 |
| 2018 | 57 | 13 |
| 2019 | 61 | 15 |
| 2020 | 40 | 0 |
| 2021 | 39 | 4 |
| 2022 | 45 | 8 |
| 2023 | 44 | 5 |
| 2017-19 Avg | 59 | 14 |
| 2021-23 Avg | 43 | 6 |
Now it appears that we’re not getting a return to pre-pandemic normalcy so much as the adoption of a new normal. Indeed, while starters averaged more innings per turn in 2022 than in any other season since ’18, this year their workloads receded again, no doubt due to the higher scoring levels driven by the offense-friendly rule changes — higher batting averages, more stolen bases, less time between pitches — and a robust home run rate:
| Season | IP/GS | Change | Starter IP% | K% | BB% | HR/9 | ERA | ERA- | FIP | FIP |
|---|---|---|---|---|---|---|---|---|---|---|
| 2015 | 5.81 | -2.6% | 65.0% | 19.5% | 7.1% | 1.06 | 4.10 | 103 | 4.03 | 102 |
| 2016 | 5.65 | -2.8% | 63.3% | 20.2% | 7.7% | 1.24 | 4.34 | 104 | 4.30 | 103 |
| 2017 | 5.51 | -2.4% | 61.9% | 20.6% | 8.1% | 1.34 | 4.49 | 103 | 4.48 | 103 |
| 2018 | 5.36 | -2.8% | 59.9% | 21.6% | 7.9% | 1.21 | 4.19 | 101 | 4.21 | 101 |
| 2019 | 5.18 | -3.4% | 57.9% | 22.3% | 7.7% | 1.44 | 4.54 | 101 | 4.51 | 100 |
| 2020 | 4.78 | -7.6% | 55.5% | 22.9% | 8.3% | 1.40 | 4.46 | 100 | 4.46 | 100 |
| 2021 | 5.02 | 5.0% | 57.3% | 22.6% | 7.8% | 1.33 | 4.34 | 102 | 4.30 | 101 |
| 2022 | 5.21 | 3.6% | 58.7% | 21.6% | 7.5% | 1.16 | 4.05 | 102 | 4.04 | 102 |
| 2023 | 5.14 | -1.2% | 58.6% | 22.1% | 7.9% | 1.32 | 4.45 | 103 | 4.42 | 102 |
Barring a reduction in the number of pitchers a team can carry on its active roster — the limit of 13 that was announced for 2020 wasn’t actually implemented until June 20, 2022 — I don’t think we’re likely to see a return even to the modest starter workload levels of 2017–18. I wouldn’t hold my breath waiting for starters to account for 60% of the league’s innings again.
Some part of that owes to the prevalence of openers and bullpen games, a trend that started with the Rays but spread to other clubs, with this year’s Giants using it more often than any other post-pandemic team. Defining such starts for the purposes of quantification is somewhat tricky, but we can get ourselves in the ballpark easily enough by tallying the number of starts that lasted one or fewer innings, two or fewer innings, and three or fewer innings — take your pick as to which you find the most meaningful — then converting those into percentages. This winds up overestimating the share of such starts because it captures those that went short due to injury or ineffectiveness, but it illustrates the trend well enough for our purposes:
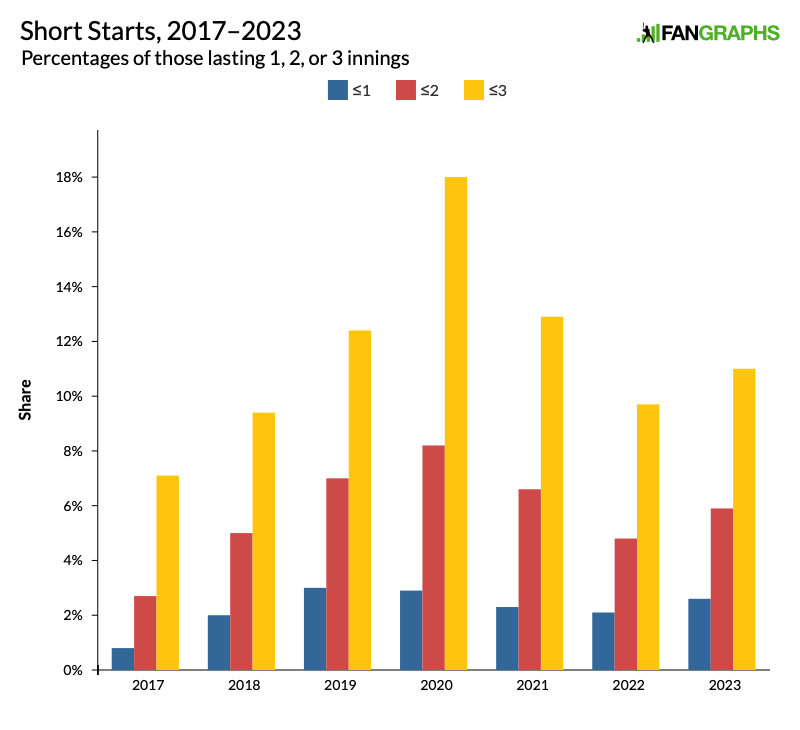
Across the board, we’re below 2019–21 levels with these openers and bullpen games, but 11% of all starts lasted three or fewer innings, 5.9% lasted two or fewer, and 2.6% lasted one or fewer. The Giants, who tried to contend by routinely using openers instead of going out and acquiring back-end starters, had 47 starts lasting three or fewer innings, third behind the 2018 and ’19 Rays (71 and 53, respectively) but well ahead of any team in the last three seasons, with the ’22 Rays (39) and ’21 Padres (36) the next-closest.
As for the postseason, here’s the comparison to regular-season innings per start:
| Season | Reg IP/GS | Post IP/GS | Change from Reg |
|---|---|---|---|
| 2015 | 5.81 | 5.51 | -5.2% |
| 2016 | 5.65 | 5.11 | -9.5% |
| 2017 | 5.51 | 4.73 | -14.1% |
| 2018 | 5.36 | 4.68 | -12.7% |
| 2019 | 5.18 | 5.14 | -0.8% |
| 2020 | 4.78 | 4.40 | -8.0% |
| 2021 | 5.02 | 3.96 | -21.2% |
| 2022 | 5.21 | 5.10 | -0.4% |
| 2023 | 5.14 | 4.55 | -11.5% |
So much for the return of postseason starting pitching. For the fifth year out of the last seven, starters are averaging fewer than five innings per turn, and the dropoff from the regular season is the second-largest we’ve seen in the last five years.
A closer look at the performances helps us to understand why:
| Season | GS | IP | IP/GS | Pit/GS | BF/GS | 6+% | 3-% | ERA | FIP | R/GS |
|---|---|---|---|---|---|---|---|---|---|---|
| 2015 | 72 | 396.7 | 5.51 | 88.4 | 22.8 | 50.0% | 12.5% | 4.33 | 4.17 | 2.85 |
| 2016 | 70 | 357.7 | 5.11 | 82.6 | 21.1 | 34.3% | 10.0% | 3.88 | 3.86 | 2.29 |
| 2017 | 76 | 359.7 | 4.73 | 79.6 | 19.9 | 32.9% | 19.7% | 4.08 | 4.32 | 2.33 |
| 2018 | 66 | 309.0 | 4.68 | 75.2 | 19.5 | 28.8% | 22.7% | 3.9 | 3.96 | 2.08 |
| 2019 | 74 | 380.0 | 5.14 | 84.9 | 21.4 | 44.6% | 13.5% | 3.36 | 3.91 | 2.09 |
| 2020 | 106 | 466.3 | 4.40 | 75.6 | 18.8 | 26.4% | 23.6% | 4.25 | 4.55 | 2.20 |
| 2021 | 74 | 293.0 | 3.96 | 67.1 | 17.1 | 17.6% | 35.1% | 4.61 | 4.01 | 2.11 |
| 2022 | 80 | 400.7 | 5.10 | 82.5 | 20.4 | 37.9% | 12.1% | 3.62 | 3.74 | 2.21 |
| 2023 | 72 | 327.7 | 4.55 | 74.9 | 19.6 | 26.4% | 25.0% | 4.53 | 4.76 | 2.39 |
As a group, this year’s postseason starters just haven’t been that effective. Thanks in no small part to the extra off-days built into postseason schedules, managers have become increasingly willing to turn the ball over to their bullpens rather than stick with starters, whether they’re struggling or not (just ask Suárez, José Berríos, Brandon Pfaadt, et al). Via that last column, you can see that while starters are actually allowing more runs per game (not per nine innings) than in any season since 2015, they don’t get very long leashes; odds are that their third run allowed is their ticket to the showers, regardless of how many outs they’ve gotten. In fact, postseason starters’ collective FIP is the highest it’s been since 2008, but they’re being bailed out by bullpens.
Note also that this year’s frequency of starts of three or fewer innings is more than double the regular-season rate. That wasn’t the case last year, but it’s actually not a new phenomenon:
| Season | Reg ≤3 | Post ≤3 | Post Ratio |
|---|---|---|---|
| 2017 | 7.1% | 19.7% | 2.76 |
| 2018 | 9.4% | 22.7% | 2.40 |
| 2019 | 12.4% | 13.5% | 1.09 |
| 2020 | 18.0% | 23.6% | 1.31 |
| 2021 | 12.9% | 35.1% | 2.73 |
| 2022 | 9.7% | 12.1% | 1.25 |
| 2023 | 11.0% | 25.0% | 2.28 |
As with the shock that every felling of a 100-win juggernaut produces in the expanded postseason, this seems to be a lesson we have to relearn every October. The postseason ballgame is a different animal than the regular-season one, and for all of our hopes that some Bob Gibson or Madison Bumgarner is going to carry a team to a championship, or a Maddux-Glavine-Smoltz or Strasburg-Scherzer combo will absorb the vast majority of a team’s innings, this isn’t the game of 50-some years ago, or even four years ago. For as much as we would like it to be, there’s probably no turning back.
Brooklyn-based Jay Jaffe is a senior writer for FanGraphs, the author of The Cooperstown Casebook (Thomas Dunne Books, 2017) and the creator of the JAWS (Jaffe WAR Score) metric for Hall of Fame analysis. He founded the Futility Infielder website (2001), was a columnist for Baseball Prospectus (2005-2012) and a contributing writer for Sports Illustrated (2012-2018). He has been a recurring guest on MLB Network and a member of the BBWAA since 2011, and a Hall of Fame voter since 2021. Follow him on BlueSky @jayjaffe.bsky.social.
I personally preferred the style of baseball played 50 years ago but I don’t think many other fans do. To make starters more important MLB would have to undo a number of rule changes that almost nobody wants to undo — 25 man roster, no DH.
Then HR would have to become 0.8 per 9 IP probably via a dead ball. Make OF larger and asymmetrical to increase 2B and 3B. I don’t think fans nor players want any of this.
I personally find ITPXBH and defensive gems the most enjoyable things to watch but I think others prefer strikeouts and HR. So that’s what we got.
I don’t know that neutering offense is likely to bring back long starts. It’s likely just to depress scoring.
The problem isn’t DHs mashing rabbit balls over short fences.
The problem is velocity. Guys going max effort don’t go deep. Not sure how any rules change is going to affect that.
Deadening the ball means less emphasis on pulling fly balls and more emphasis on driving batted balls to all fields. This means less selling out. This means strikeouts are harder to come by. This means more balls in play regardless of velocity. This reduces the incentive to maximize velocity and spin rate.
It’s not neutering offense. It’s changing emphasis to line drives from pulling fly balls
More BIP and larger OF means more emphasis on defense than slugging. Yordan Alvarez can play a small LF but the CF and RF had better be able play defense.
Velocity (and strikeouts) have been increasing since the dawn of baseball. Regardless of the rest of the ruleset, there is always an advantage (for the pitcher) in more of each. Always.
If you want to bring back longer pitchers, you’d have to get to that directly. Set a cap on pitching changes, or roster spots, or something like that. Messing with ballpark dimensions and batter incentives won’t do it.
The DH means no need for 5-6 hitters on the bench. A 25 man roster with 14 hitters and 11 pitchers means a 6 man bullpen. In the regular season that would mean 4 multi inning guys.
I think HappyFunBall is right. There is more emphasis on strikeouts which means more effort, more hard breaking balls, shorter outings by starting pitchers. Also, more emphasis on walks for hitters and working deep into counts, so more pitches/PA.
Teams also understand issues like wear and tear that may be more significant after ~100 pitches in an outing and the third time through the order penalty. It has proven a little harder to find durable, top of the rotation starters to fill out an expanded number of teams than it has to find good hitters or high relievers that can throw hard in short stretches.
But I agree with you on style of play. HR are great, but making them more common makes them less great. I also agree that most fans probably don’t want to go back to that. They dig the long ball more than they want to see solid defense.
The deep counts and walks would decline if pitchers weren’t always looking for the strikeout. If a pitcher could pitch to quadrants rather than ninths without fear of HR there wouldn’t be the long counts