The Long and Short of It: A Look at This Year’s Postseason Starting Pitching
At last, we’ve got a World Series matchup to wrap our heads around. Representing the American League are the Blue Jays, who are back in the Fall Classic — making it a truly international World Series — for the first time since 1993. They’ll face the Dodgers, who are vying to become the first back-to-back champions since the 1999–2000 Yankees. They’re the first defending champions to repeat as pennant winners since the 2009 Phillies, who lost that World Series to the Yankees. If that matchup feels like a long time ago, consider that it’s been twice as long since the Blue Jays were here.
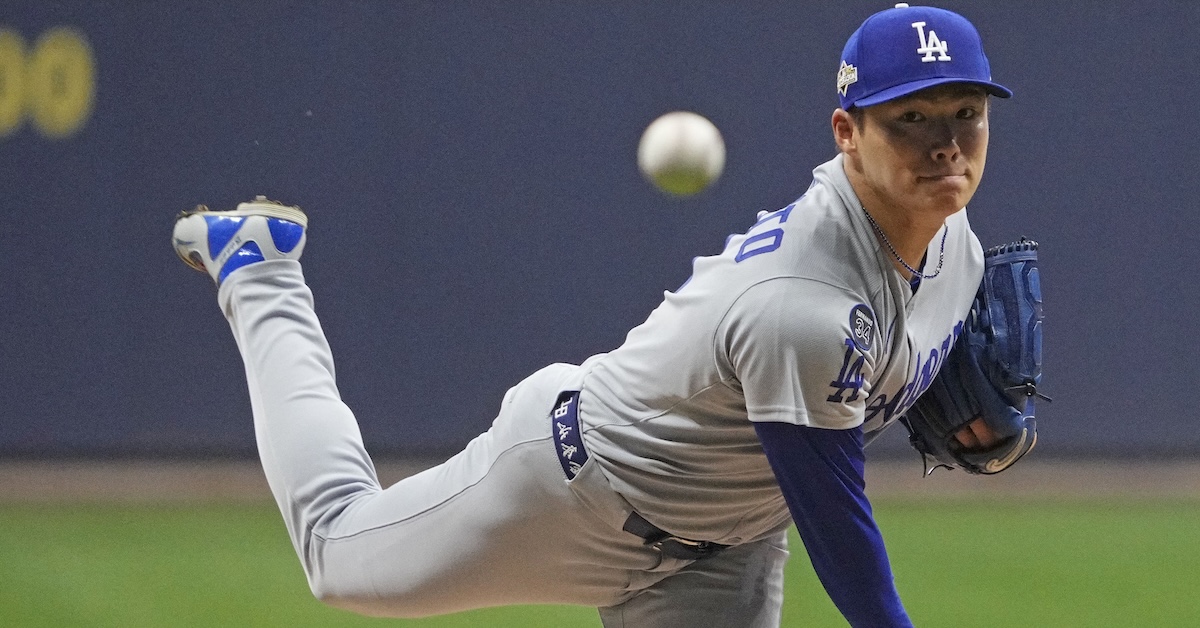
Though the core of the lineup is largely unchanged, this year’s Dodgers team differs from last year’s in that it has reached the World Series on the strength of its starting pitching rather than in spite of it. Due to a slew of injuries in the rotation last year, manager Dave Roberts resorted to using bullpen games four times to augment a rickety three-man staff consisting of Yoshinobu Yamamoto, Jack Flaherty, and Walker Buehler. Even as those starters (or “starters,” in some cases) put up a 5.25 ERA while averaging just 3.75 innings per turn, the bullpen and offense more than picked up the slack, and the Dodgers took home their second championship of the Roberts era.
This time around, with Flaherty and Buehler elsewhere and Blake Snell, Tyler Glasnow, and Shohei Ohtani joining Yamamoto, Dodgers starters have been absolutely dominant, posting a microscopic 1.40 ERA while averaging 6.43 innings per turn through the first three rounds, helping the team to paper over a shaky bullpen. After Snell utterly dominated the Brewers, holding them to just one hit over eight innings while facing the minimum number of batters in Game 1 of the NLCS, Yamamoto followed with a three-hit, one-run masterpiece — the first complete game in the postseason since the Astros’ Justin Verlander went the distance against the Yankees in Game 2 of the 2017 ALCS. Glasnow, who began the postseason in the bullpen, allowed one run across 5 2/3 innings in Game 3 of the NLCS, while Ohtani backed his 10 strikeouts over six shutout innings in Game 4 with a three-homer game in what for my money stands as the greatest single-game postseason performance in baseball history.
How good has the Dodgers rotation been? Since the advent of division play in 1969, only one other team rotation has turned in a lower ERA while playing at least two rounds (LCS and World Series, or more):
| Team | Season | GS | QS | IP | ERA | Results |
|---|---|---|---|---|---|---|
| Orioles | 1983 | 9 | 6 | 61 2/3 | 1.31 | Won WS |
| Dodgers | 2025 | 10 | 8 | 64 1/3 | 1.40 | Won NLCS |
| Braves | 1996 | 16 | 15 | 113 1/3 | 1.59 | Lost WS |
| Expos | 1981 | 10 | 8 | 73 2/3 | 1.59 | Lost NLCS |
| Brewers | 2018 | 10 | 0 | 33 | 1.64 | Lost NLCS |
| Mets | 1973 | 12 | 10 | 81 2/3 | 1.87 | Lost WS |
| Athletics | 1972 | 12 | 6 | 76 1/3 | 1.89 | Won WS |
| Tigers | 2012 | 13 | 10 | 85 1/3 | 1.90 | Lost WS |
| Diamondbacks | 2001 | 17 | 14 | 120 1/3 | 1.94 | Won WS |
| Dodgers | 1981 | 16 | 11 | 110 1/3 | 1.96 | Won WS |
That’s some impressive company, though what stands out as much as the Dodgers’ being one of just two teams from the past decade to crack the list is that the period’s other representative used a completely different approach. As with their counterparts this year, the 2018 Brewers used openers, bullpen games, and short-working starters to cover for the team’s lack of a strong set rotation. It worked better last time around than it did this year, as those Brewers extended the Dodgers to seven games in the NLCS.
We’ve seen other teams besides the Brewers do that this fall, at least occasionally, so particularly during the pre-World Series doldrums, this is a worthwhile time to delve into my annual checkup on postseason starting pitching. First off, for the third year in a row and fourth year out of five, postseason starter workloads — as measured in innings per start — are down at least 10% relative to the regular season:
| Season | Regular Season IP/GS | Postseason IP/GS | Change From Regular Season |
|---|---|---|---|
| 2015 | 5.81 | 5.51 | -5.2% |
| 2016 | 5.65 | 5.11 | -9.5% |
| 2017 | 5.51 | 4.73 | -14.1% |
| 2018 | 5.36 | 4.68 | -12.7% |
| 2019 | 5.18 | 5.14 | -0.8% |
| 2020 | 4.78 | 4.40 | -8.0% |
| 2021 | 5.02 | 3.96 | -21.2% |
| 2022 | 5.21 | 5.01 | -3.8% |
| 2023 | 5.14 | 4.60 | -10.5% |
| 2024 | 5.22 | 4.25 | -18.6% |
| 2025 | 5.19 | 4.35 | -16.1% |
The yellow cells indicate seasons where postseason starters have averaged less than five innings per turn. With starter usage in the regular season already on the wane due to workload concerns and an understanding of the three-times-through-the-order penalty, the average postseason start slipped below five innings in 2017, and it’s only crossed back above that line twice in the past nine seasons, including just once in the six since the pandemic. This year, starting pitchers have thrown just 48.5% of postseason innings, compared to 58.5% during the regular season.
For as limited as starting pitchers have been in terms of workloads this year, they’ve performed pretty well in the aggregate; their collective 3.64 ERA is the third lowest of the past 11 seasons, a whisker behind 2022, and their FIP is the lowest for that span.
| Season | GS | IP | IP/GS | Pit/GS | BF/GS | 6 or more IP% | 3 or fewer IP% | ERA | FIP | R/GS |
|---|---|---|---|---|---|---|---|---|---|---|
| 2015 | 72 | 396 2/3 | 5.51 | 88.4 | 22.8 | 50.0% | 12.5% | 4.33 | 4.29 | 2.85 |
| 2016 | 70 | 357 2/3 | 5.11 | 82.6 | 21.1 | 34.3% | 10.0% | 3.88 | 4.01 | 2.29 |
| 2017 | 76 | 359 2/3 | 4.73 | 79.6 | 19.9 | 32.9% | 19.7% | 4.08 | 4.47 | 2.33 |
| 2018 | 66 | 309 | 4.68 | 75.2 | 19.5 | 28.8% | 22.7% | 3.90 | 4.08 | 2.08 |
| 2019 | 74 | 380 | 5.14 | 84.9 | 21.4 | 44.6% | 13.5% | 3.36 | 3.97 | 2.09 |
| 2020 | 106 | 466 1/3 | 4.40 | 75.5 | 18.8 | 26.4% | 23.6% | 4.25 | 4.66 | 2.20 |
| 2021 | 74 | 293 | 3.96 | 67.1 | 17.1 | 17.6% | 35.1% | 4.61 | 4.13 | 2.11 |
| 2022 | 80 | 400 2/3 | 5.10 | 80.8 | 20.4 | 33.8% | 13.8% | 3.62 | 4.06 | 2.36 |
| 2023 | 82 | 377 1/3 | 4.55 | 75.0 | 19.6 | 28.0% | 24.4% | 4.39 | 4.63 | 2.33 |
| 2024 | 86 | 365 2/3 | 4.25 | 70.7 | 18.2 | 22.1% | 25.6% | 4.13 | 4.32 | 2.12 |
| 2025 | 80 | 348 1/3 | 4.35 | 70.5 | 18.1 | 27.5% | 30.0% | 3.64 | 3.64 | 1.95 |
As you can see from the table, in the past couple of postseasons managers have scaled back the average starter appearance to about 18 hitters and 70 pitches thrown; starters are sticking around only long enough to allow about two runs before getting the hook. For the second year in a row and third in the past five, starts of three innings or less have outnumbered those of six innings or more.
That said, the Dodgers’ performances the last two years may be distorting the trends a bit. Here’s a look at how the other 11 postseason teams performed during both the 2024 and ’25 playoffs:
| Season | GS | IP | IP/GS | Pit/GS | BF/GS | 6+% | 3-% | ERA | FIP | R/GS |
|---|---|---|---|---|---|---|---|---|---|---|
| 2024 Total | 86 | 365 2/3 | 4.25 | 70.7 | 18.2 | 22.1% | 25.6% | 4.13 | 4.32 | 2.12 |
| 2024 No Dodgers | 70 | 305 2/3 | 4.37 | 72.3 | 18.7 | 24.3% | 21.4% | 3.92 | 3.92 | 2.10 |
| 2025 Total | 80 | 348 1/3 | 4.35 | 70.5 | 18.1 | 27.5% | 30.0% | 3.64 | 3.64 | 1.95 |
| 2025 No Dodgers | 70 | 284 | 4.06 | 67.0 | 17.2 | 20.0% | 34.3% | 4.56 | 3.89 | 2.06 |
This year, the starters from the other 11 teams are averaging just over four innings — with more than a third of them running three innings or less — while posting an ERA higher than we’ve seen from the whole playoff field since 2021. If we look back to last year’s performance without the Dodgers, we can see a drop of about a third of an inning per turn and about a 12-percentage point increase in the short starts category.
Whether imitating the success of the most recent champion, the admission of weaker teams to the playoff field thanks to the 2022 format change, a reaction to the compressed schedule, or the chasing of increased velocity, the reasons for short starts vary. On the velocity front, it’s worth keeping in mind that smaller workloads allow for a reliever-like approach — throwing harder over shorter stints because of less need to conserve energy over the course of 100-plus pitches, and perhaps mothballing those less effective secondary pitches since they won’t be needed for multiple encounters. Here’s a look at the trend in fastball velocities among starters:
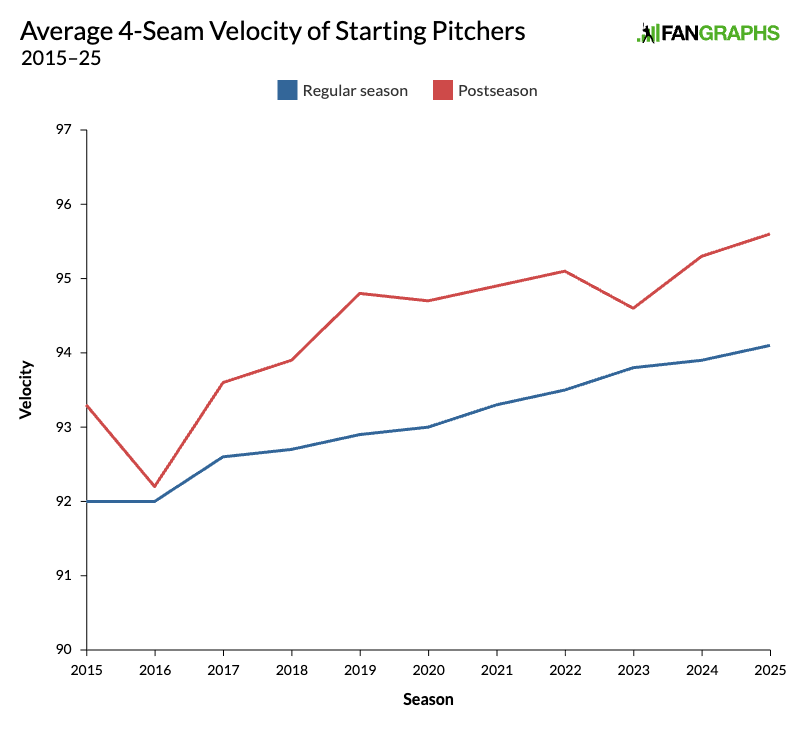
The scale is distorted in order to highlight the gap, but it’s still been pretty consistent. During this postseason, starters are averaging 95.6 mph with their four-seamers, up 1.5 mph from the regular season. The gap was actually at its largest in 2019 (1.8 mph) and smallest in ’16, though it closed to just 0.8 mph in ’23; other than that year, it’s been 1.2 mph or higher annually since 2018.
Now, let’s look at each playoff team’s rotation performance so far, with the four League Championship Series participants highlighted:
| Team | GS | IP | IP/GS | 6 or more IP% | 3 or fewer IP% | ERA | FIP |
|---|---|---|---|---|---|---|---|
| Dodgers | 10 | 64 1/3 | 6.43 | 80.0% | 0.0% | 1.40 | 2.00 |
| Phillies | 4 | 20 | 5.00 | 50.0% | 25.0% | 2.25 | 2.09 |
| Yankees | 7 | 34 2/3 | 4.95 | 57.1% | 42.9% | 5.19 | 4.26 |
| Tigers | 8 | 38 2/3 | 4.83 | 37.5% | 25.0% | 2.56 | 2.95 |
| Blue Jays | 11 | 51 1/3 | 4.67 | 9.1% | 18.2% | 3.33 | 4.01 |
| Red Sox | 3 | 13 2/3 | 4.56 | 33.3% | 33.3% | 3.95 | 2.99 |
| Mariners | 12 | 52 1/3 | 4.36 | 16.7% | 16.7% | 4.47 | 4.40 |
| Guardians | 3 | 13 | 4.33 | 33.3% | 33.3% | 1.38 | 1.67 |
| Padres | 3 | 9 2/3 | 3.22 | 0.0% | 33.3% | 3.72 | 3.34 |
| Reds | 2 | 6 1/3 | 3.17 | 0.0% | 50.0% | 11.37 | 8.82 |
| Cubs | 8 | 22 1/3 | 2.79 | 0.0% | 50.0% | 4.43 | 3.81 |
| Brewers | 9 | 22 | 2.44 | 0.0% | 66.7% | 7.77 | 7.50 |
The Dodgers are one of just two teams averaging at least five innings per start, and the only one without a single short start; only once has a Dodgers starter exited before completing 5 2/3 innings. (Yamamoto was pulled after four in NLDS Game 3.) On the other hand, the Brewers were one of four teams that didn’t have a single six-inning start, and one of two to win a series while doing so, along with the Cubs. Milwaukee’s results weren’t so hot; 7.77 is better suited to describing a Boeing jet than a rotation’s ERA.
Again, the reasons for short starts vary. Sometimes a manager makes a quick read of the situation, decides his starter doesn’t have it that day, and pulls him before things get out of hand. Red Sox manager Alex Cora did this with Brayan Bello in Game 2 of the Wild Card Series against the Yankees, when Bello had allowed two runs in 2 1/3 innings and wasn’t missing bats against a lefty-heavy lineup. While six other relievers held the Yankees to two runs over 5 2/3 innings, that was one run too many as Boston lost.
Sometimes a manager goes short with his starter by design, as Tigers manager A.J. Hinch did with regards to Casey Mize, who turned in two three-inning, one-run starts in front of bullpens that were well set up. (The Tigers split those games.) Phillies manager Rob Thomson did this with Aaron Nola in Game 3 of the Division Series; after he threw two scoreless innings, Ranger Suárez entered and pitched five innings of one-run ball in the team’s lone win over the Dodgers.
Sometimes a manager uses a high-leverage reliever as an opener, with a bulk guy either directly following him or at the start of the next clean inning. The Brewers started Aaron Ashby three times and Trevor Megill once, with Quinn Priester or fireballer Jacob Misiorowski adding three to five innings at a time in relief. The Blue Jays eschewed the bulk guy in Game 4 of the ALDS against the Yankees, rolling with Louis Varland and seven other relievers, none of whom threw more than 1 2/3 innings or faced more than seven hitters. No Yankee got a second look at a pitcher that night, and the team went down in defeat.
As those examples suggest, the lines here are somewhat blurred. The Nola start fits the patter of an opener/bulk game, and there wasn’t much difference between the Bello game and the Varland one save for an extra three outs by the former and some premeditation on the part of manager John Schneider with regards to the latter. Thus, it’s hard to get a true feel for how well such gambits work. Overall, teams that have gotten three innings or fewer out of their starters have gone just 7-17 in those games, including 2-8 when a “traditional starter” — a pitcher generally used as a starter during the regular season — allowed three or more runs. Which means that even when managers went with quicker hooks, à la Cora with Bello or Mike Shildt with Yu Darvish (who departed after yielding two runs in the first inning of Game 3 of the Padres’ Wild Card Series loss to the Cubs), their teams ended up losing more often than not. Last year, teams went 8-14 when their starters worked three innings or less, including 2-10 when a traditional starter yielded three runs or more. The Dodgers went 2-2 in games where they used an opener (Ryan Brasier, Ben Casparius, or Michael Kopech) and thanks to their offense managed to go 2-1 in games where Flaherty and Yamamoto pitched poorly and exited early.
On the other hand, teams that have gotten six or more innings in a game from their starters have gone 15-7, with all but one of those starters (Cam Schlittler opposite Varland) allowing three runs or less and thus delivering a quality start. In 2024, teams went 12-7 when getting at least six innings, with 16 of those 19 starts counting as quality starts. Unsurprisingly, longer starts give teams a better shot at winning.
Back to the World Series matchup. The Dodgers are likely to go with the same order as they used during the NLCS: Snell, Yamamoto, Glasnow, and then Ohtani. That plan gives Snell and Glasnow four days of rest between turns if they’re needed for Games 5 and 7, with Yamamoto getting an extra day while working 2 and 6; Ohtani could be available in relief in Game 7 if it comes to that, and whoa, wouldn’t that be something?
The Blue Jays have taken what might qualify as the most conventional approach to their rotation, in that the largest share of their starts (72.7%, eight out of 11) has landed between three and six innings. Shane Bieber is the only one of their starters to reach the six-inning mark, doing so in ALCS Game 3 against the Mariners, but he’s also gotten a couple of quick hooks, lasting just 2 2/3 innings against the Yankees in ALDS Game 3 and 3 2/3 in ALCS Game 7. Of the rest, they’ve all been either 5 1/3 or 5 2/3 innings with zero to two runs allowed save for Trey Yesavage’s four-inning, five-run dud in ALCS Game 2.
At this writing, Schneider has yet to formalize the Blue Jays’ rotation plan. Kevin Gausman started the ALDS and ALCS openers, as well as ALCS Game 5; he would be working on three days of rest, though he did throw only 19 pitches in his scoreless inning in the ALCS finale on Monday. Yesavage, who has followed Gausman in each series, could jump the line to start Game 1, as he would be on four days of rest. Max Scherzer, who turned in a gritty 5 2/3 innings in ALCS Game 4 after not pitching for more than three weeks, is the likely Game 3 starter followed by Bieber. Chris Bassitt, who made two scoreless appearances out of the bullpen in the ALCS after being left off the ALDS roster, could be in the mix if there’s a need, but his problems against lefties make him a less-than-ideal fit against the Dodgers.
Regardless, if the trends continue, this is a World Series matchup where the spotlight could shine on both teams’ starters to a greater extent than some of the other pairings this fall. Then again, it’s baseball. Who knows what we’re about to get?
Brooklyn-based Jay Jaffe is a senior writer for FanGraphs, the author of The Cooperstown Casebook (Thomas Dunne Books, 2017) and the creator of the JAWS (Jaffe WAR Score) metric for Hall of Fame analysis. He founded the Futility Infielder website (2001), was a columnist for Baseball Prospectus (2005-2012) and a contributing writer for Sports Illustrated (2012-2018). He has been a recurring guest on MLB Network and a member of the BBWAA since 2011, and a Hall of Fame voter since 2021. Follow him on BlueSky @jayjaffe.bsky.social.
The table, Regular vs. Postseason Start Length 2015-25, has an error in 2022 and a smaller error in 2023. 2022 should be 3.8% not 0.4, 2023 should be 10.5% rather than 11.5.