The NL Cy Young Race Is Still Wide Open

Spencer Strider may be comically overpowering, but his bid to win the NL Cy Young is anything but a cakewalk. Over the course of his past two outings, he’s been hit for 10 runs in 8.2 innings, elevating his ERA from 3.46 to 3.83, higher than any pitcher who has won the award. The truth is that with less than four weeks to go in the season, no NL pitcher — not Strider, Blake Snell, Justin Steele, Zac Gallen or Zack Wheeler, just to run through a partial list of names — has a particularly strong statistical case to win. While each candidate’s remaining few starts may provide some clarity before voters send off their ballots, the race as it stands is worth a closer look.
I’m not a BBWAA voter in this or any of the annual awards this year, but I had been thinking about this race a bit lately thanks to a couple of questions from readers in recent chats and on social media. To that point, my default answer prior to those had been “Strider or Snell,” but I hardly had my mind made up. By a happy coincidence, all of this happened just as we introduced a Cy Young Projections leaderboard based on a simple model created by Tom Tango, using only earned runs, innings pitched, strikeouts, and wins — all counting stats, no rate stats. I know what the leaderboard says, and you can look as well, but I’ll save what it’s telling us about this race until later in this piece.
The 24-year-old Strider is the most dominant pitcher in the game, a marvel whose understanding of the biomechanics necessary to get the most out of his small stature (he lists at 6 feet and 195 pounds but is often referred to as 5-foot-11) recalls those of Tim Lincecum and Sandy Koufax, or at least Jane Leavy’s version of him. Last year as a rookie, he set a record for fewest innings to reach 200 strikeouts, doing so in 130 frames; he finished sixth in the league with 202 Ks despite not making his first start until May 30.
This year, Strider broke his own record, reaching 200 strikeouts in 123.1 innings. His 250 strikeouts are 49 more than the closest NL pitcher, Snell; as a percentage of batters faced, Strider’s 37.8% not only leads the league — 6.7 percentage points ahead of Snell — but is also the second-highest strikeout rate of any qualified starter over a full season (as in, no strike or pandemic years) behind only the 2019 edition of Gerrit Cole (39.9%). That said, by our Plus stats, which normalize a pitcher’s K% to the league rate, Strider’s 170 K%+ — that is, 70% above the league average — is merely 156th among qualified AL and NL pitchers dating back to the 19th century.
Strider additionally has the NL’s top strikeout-walk differential (30.0%) by a 6.9-point margin and the league’s lowest FIP at 2.89, though his 67 FIP- trails Wheeler (65). But he’s been undone to some degree by his 1.11 homers per nine, which is in a virtual tie for 15th among the 26 qualified NL starters, and his 3.83 ERA is 14th.
Indeed, Strider has had his days where he’s taken his lumps; five times he’s allowed five or more runs, with a high of eight against the Mets on June 8, and he’s allowed six in 2.2 innings twice in his past half-dozen starts, first on August 7 against the Pirates and then on Wednesday against the Cardinals. Five other times he’s allowed four runs in either five or six innings, including four in six against the Dodgers on August 31. Here’s a look at his six-start rolling average, which includes a lot of time in midsummer where that mark was around or above 5.00:
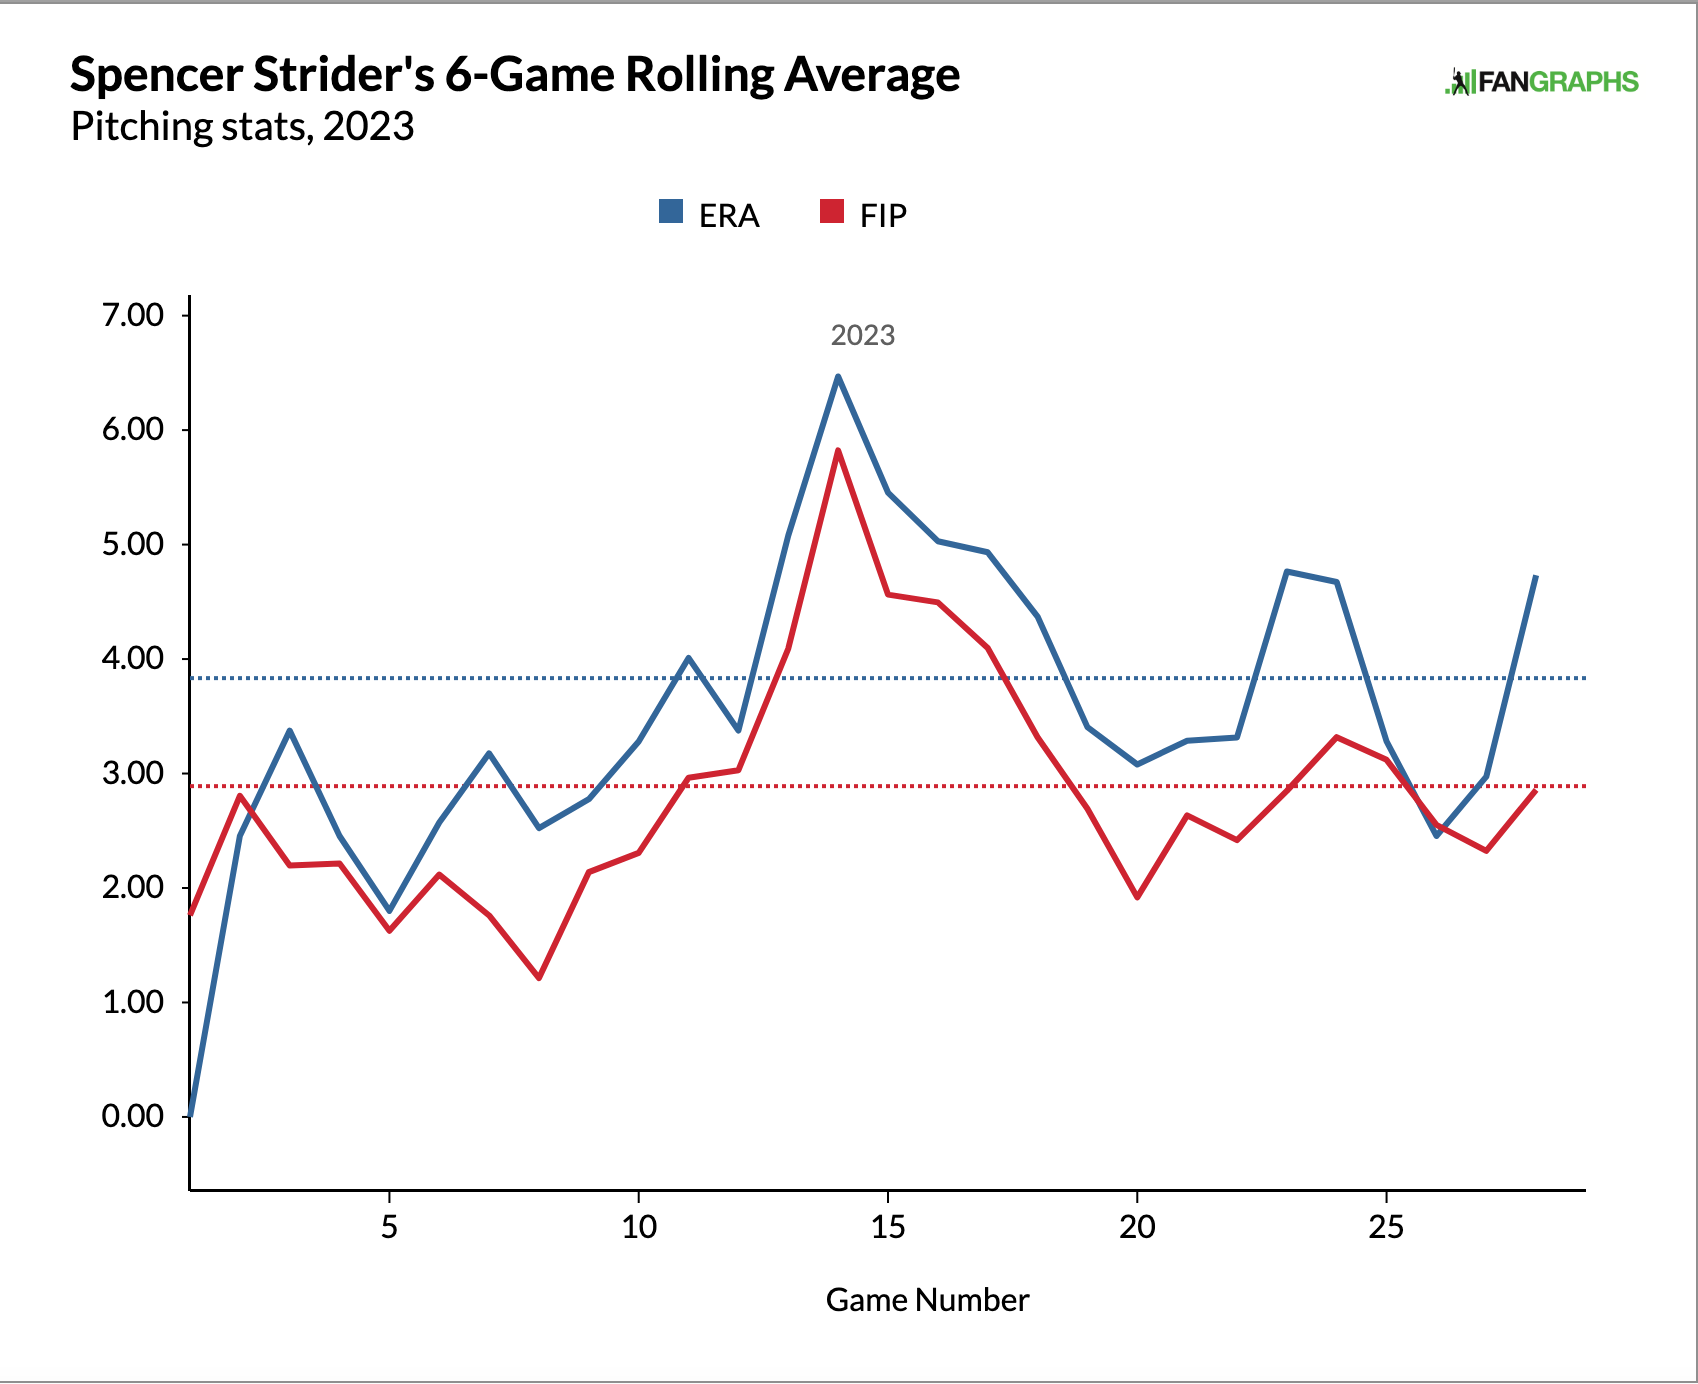
As his 0.94 runs per nine gap between his ERA and his FIP — the largest of the 26 qualified NL starters — suggests, a couple of things are going on that have inflated Strider’s ERA. A look at Statcast’s expected home runs leaderboard shows that he’s allowed 2.8 more than projected based on exit velocities, launch angles, projected distances, and wall heights; among pitchers who have allowed at least 10 homers, that places him in the 91st percentile. Only five of his 25 homers were no-doubters (gone in all 30 parks) and five are doubters (gone in 1–7 parks). That’s some bad luck.
Likewise when it comes to Strider’s .317 BABIP, the second-highest among the qualified NL starters and 13 points higher than the Braves’ mark as a whole. We know a lot more about pitchers’ influence on BABIP than we did 10 years ago thanks to Statcast, such as the fact that Strider ranks in the 75th percentile in terms of hard-hit rate (35.2%) and the 67th percentile in terms of average exit velocity (88.2 mph) but only the 29th percentile in terms of barrel rate (9.1%). With the first two of those marks within a couple eyelashes of last year’s numbers (36% and 88.0 mph), it’s the three-point rise in barrel rate that most helps to explain Strider’s jump in ERA from 2.67 to 3.83 and in xERA from 2.39 to 3.06. But guess what? That last mark leads NL starters this year, and so does the 0.77 runs per nine gap between Strider’s actual and expected ERA. It’s fair to say he’s been especially unlucky.
Strider’s 3.83 ERA would be the highest of any Cy Young honoree, ahead of 1983 AL winner LaMarr Hoyt (3.66), 2001 AL winner Roger Clemens (3.51), and 2005 AL winner Bartolo Colon (3.48), all of whom finished first thanks in large part to having notched 20 or more wins. Adjusted for ballpark and league scoring levels, Clemens’ 80 ERA- and Colon’s 82 ERA- are both substantially better than Strider’s 86, which is at least better than Hoyt’s 88, as well as the 87 of 1982 AL winner Pete Vuckovich (on a 3.34 ERA). Still, that ERA is the biggest impediment to voting for Strider, whose 6.28 runs per game of offensive support has helped push his won-loss record to 16–5 nonetheless.
If not Strider, then who? One could point to Wheeler, who leads in fWAR (5.7, a full win ahead of the second-ranked Snider) and is second in FIP (2.93), xERA (3.13), and K-BB% (23.1%); or Snell, who leads in ERA (2.50) and bWAR (4.6) and is second in both strikeouts and strikeout rate (31.1%). Steele is second in ERA (2.55), third in FIP (2.98) and fWAR (4.3), and fourth in bWAR (4.1); thanks to his 6.39 runs per game of offensive support, he has an even gaudier won-loss record than Strider at 16–3.
While there are other NL starters having fine seasons, such as Gallen and Kodai Senga, I don’t see any statistic or combination of stats that elevates them into that quartet. Senga’s 3.08 ERA is the league’s third-lowest, and his 29.3% strikeout rate the fourth-highest, but he also has just 143.1 innings, 26.2 fewer than Wheeler (the leader of that quartet, and third overall) and 8.2 fewer than Steele (the low man of the group). Then again, each of those top four have nits we can pick in addition to those already mentioned:
- Strider’s 3.0 bWAR — which contains adjustments not only for ballpark but also the quality of the offenses he’s faced and the defense behind him, making it preferable (to these eyes, at least) to our RA9-WAR — is merely tied for 13th.
- Steele’s 24.5% strikeout rate is the lowest of this group, and just 13th in the league. Additionally, he has allowed an NL-high 12 unearned runs, and while it’s customary to ignore those within the very convoluted concept of ERA, those runs count just the same. We have better tools to separate pitching from fielding, as Baseball Prospectus’ Michael Wolverton pointed out nearly 20 years ago, and our toolbox has only gotten larger in the ensuing decades. Steele’s 3.26 RA9 (runs allowed per nine) is still second among NL qualifiers, but it’s nearly two-thirds of a run behind Snell’s 2.61.
- Snell’s 13.8% walk rate is the highest among qualifiers in either league, and it makes actually watching him pitch a damn chore. It also inflates his FIP to 3.69, the highest of this quartet and merely eighth in the league. His -1.19 ERA-FIP differential is the lowest in the league, at the opposite end of the spectrum from Strider’s 0.94.
- Wheeler’s biggest problem seems to be that nobody is talking about him as a candidate. His 3.49 ERA would be on the high side for a winner, fitting between those of Colon and Clemens. That said, he’s such a workhorse that he’s got a big lead in innings among this group (though he’s just seventh overall), and in addition to his other rate stats cited, his 4.6% walk rate is the league’s third-lowest.
I threw those four into a spreadsheet along with any other qualified NL starter whose ERA and FIP were both at 3.83 or lower — a description that applies to Senga and two as-yet unmentioned hurlers — and then tried something that I’ll surely regret:
| Name | W-L | IP | K% | BB% | ERA | xERA | FIP | jERA | fWAR | bWAR | jWAR | aWAR |
|---|---|---|---|---|---|---|---|---|---|---|---|---|
| Blake Snell | 12-9 | 155.0 | 31.1% | 13.8% | 2.50 | 3.94 | 3.69 | 3.38 | 3.0 | 4.6 | 3.6 | 3.75 |
| Justin Steele | 16-3 | 152.0 | 24.5% | 5.3% | 2.55 | 3.39 | 2.98 | 2.97 | 4.3 | 4.1 | 4.2 | 4.22 |
| Kodai Senga | 10-7 | 143.1 | 29.3% | 11.0% | 3.08 | 3.62 | 3.47 | 3.39 | 3.1 | 3.7 | 3.3 | 3.38 |
| Zack Wheeler | 11-6 | 170.0 | 27.7% | 4.6% | 3.49 | 3.13 | 2.93 | 3.18 | 5.7 | 4.2 | 4.4 | 4.75 |
| Logan Webb | 9-12 | 187.0 | 23.3% | 3.8% | 3.51 | 3.67 | 3.31 | 3.50 | 3.9 | 4.2 | 4.1 | 4.08 |
| Jesús Luzardo | 9-8 | 155.1 | 28.2% | 7.0% | 3.59 | 3.89 | 3.65 | 3.71 | 3.0 | 3.1 | 3.1 | 3.05 |
| Spencer Strider | 16-5 | 162.0 | 37.8% | 7.9% | 3.83 | 2.94 | 2.89 | 3.22 | 4.7 | 3.0 | 4.1 | 3.93 |
As if we needed more numbers and letters in this alphabet soup, I tried averaging ERA, FIP and xERA into something I call jERA, so you can remember who to blame. Sort the table by that column and you can see Steele, Wheeler, and Strider are 1-2-3. I then used jERA to cobble together a back-of-the-envelope approximation of WAR by using 5.49 runs per nine (25% higher than the NL average ERA of 4.39) as the replacement level, each pitcher’s innings total, and a very rough conversion of 10 runs to one win; call it jWAR and direct your ire at me. I then averaged fWAR, bWAR, and jWAR together — sure, why not? – into something called aWAR. That puts Wheeler, Steele, and Logan Webb (the league leader in innings) 1-2-3, with Strider fourth and Snell fifth.
I’m not sure I like that final ranking or even would use it as a guide to how I would cast a ballot, but it’s an attempt to balance a lot of different inputs and find a middle ground. You’re free to ignore it.
As for our new toy, it uses a very simple formula, where Cy Young Points (CYP) = IP/2 – ER + SO/10 + W. It’s so simple that it’s tough to believe it works, but as Tango pointed out, “Every single Cy Young winner [from 2006–20] finished 1st or 2nd in Cy Young points, since 2006, without exception. None.” We also have a FIP-adjusted system that may do a better job of predicting more recent voter behavior, where FIP CYP = (IP/2 – ER) + (IP/2 – FIP Runs) + SO/10 + W.
On the leaderboard, you can sort to see the current standings in both CYP and FIP CYP as well as the projected standings using our rest-of-season numbers from your choice of systems: Steamer, ZiPS, the Depth Charts (which uses those two), The Bat, and ATC. Here’s how the top 10 shakes out currently and using the Depth Charts projections. Sort to your heart’s content:
| Pitcher | CYP | FIP CYP | Proj CYP | Proj FIP CYP |
|---|---|---|---|---|
| Blake Snell | 73.5 | 88.7 | 73.5 | 88.7 |
| Justin Steele | 69.1 | 96.1 | 69.1 | 96.1 |
| Spencer Strider | 62.1 | 94.9 | 62.1 | 94.9 |
| Zac Gallen | 59.9 | 85.7 | 59.9 | 85.7 |
| Charlie Morton | 56.6 | 69.4 | 56.6 | 69.4 |
| Kodai Senga | 58.3 | 76.8 | 58.3 | 76.8 |
| Zack Wheeler | 57.5 | 90.4 | 57.5 | 90.4 |
| Clayton Kershaw | 54.9 | 61.2 | 54.9 | 61.2 |
| Merrill Kelly 켈리 | 52.4 | 65.9 | 52.4 | 65.9 |
| Logan Webb | 53.8 | 82.5 | 53.8 | 82.5 |
The CYP-based ones place both the current and projected podium as Snell-Steele-Strider; the ones that incorporate FIP call it Steele-Strider-Wheeler, an interesting result given that Steele’s case is so driven by ERA.
If the race ended today, I don’t feel strongly that there’s a “right” or “wrong” answer from among those four; I can see reasons to vote for each, and the point of this article is to illustrate that, not to convince myself or you that one absolutely has to vote a certain way. If it’s dominance you want to reward while thumbing your nose at ERA, choose Strider. If it’s by-the-book run prevention, go with Steele. If you want to combine those two, vote Snell. If you want to reward durability in an age of five-and-fly, pick Wheeler. If anything, I’m glad that each starter has at least a few more turns to make his case. Perhaps that will provide some clarity where none exists now.
Brooklyn-based Jay Jaffe is a senior writer for FanGraphs, the author of The Cooperstown Casebook (Thomas Dunne Books, 2017) and the creator of the JAWS (Jaffe WAR Score) metric for Hall of Fame analysis. He founded the Futility Infielder website (2001), was a columnist for Baseball Prospectus (2005-2012) and a contributing writer for Sports Illustrated (2012-2018). He has been a recurring guest on MLB Network and a member of the BBWAA since 2011, and a Hall of Fame voter since 2021. Follow him on BlueSky @jayjaffe.bsky.social.
Don’t a lot of the award voters still go based off of ERA? Like we saw in 2017 with the AL Cy Young where Kluber beat Sale in a rout? Or in 2015 with Arrieta over Kershaw?
In 2015, they actually didn’t go with ERA, because Zack Greinke had an ERA of 1.66. And in 2017, a fair amount of that was recency bias, given that iirc Sale struggled a bit at the end of the year; four blowup starts in August and September. Kluber had a grand total of three during the whole season, all in April or May. So while Sale had great overall numbers, Kluber finished stronger.
Arrieta was only what 0.07 behind Greinke. And a half run better than Kershaw.
Voter fatigue played a role with Kershaw, as he’d just won back-to-back Cy’s, three of the last four, and was reigning NL MVP. The narrative of him failing in the postseason had started to take hold, so that probably dinged him in the voters’ heads even though it’s not one of the criteria they’re supposed to consider.
His ERA was also a half run back. Like it or not, that matters.
Very likely not the primary factor, the way you seem to be presenting it. If he was in second, maybe, but he finished behind both Arrietta and Greinke, and with only 3 first place votes. It’s pretty clear the voters were just like “ehhhh, these guys deserve it too.”
I feel like this a a year where it’s going to be very easy for someone with Steele’s resume (Wins, ERA) to win the award. The fact that the Cubs are likely to be a suprise playoff darling only aids in his narrative.
Strider’s Ks are freakish but if he limps to the finish it won’t matter. Snell’s got the bad command and the anchor of SD’s disappointing season. Wheeler’s got a pretty good skills-based case, but too many analytically inclined voters will line up behind Strider and Snell for him to win out on that basis. IMO.
Plus Justin Steele sounds like the secret identity of a superhero
Or a pornstar.
Arrieta had some narrative going for him too–a no hitter and a 0.75 ERA 2nd half.
I mean it took voters like 20 years to finally quit the Win. Probably a long way off before they quit ERA
Kluber beat Sale in a route largely because of timing more than ERA. He had a bad April was gone for most of May and then came back and accumulated all of his 7.2 fWAR (6.9 to be exact) including two complete games and one shutout in September. Sale was almost the inverse barely putting up any WAR in September and getting out WAR’d by 2.5 from June to September on (he was at his best early in the year).