
Wait, FanGraphs Is Too Low on the Orioles Again?!
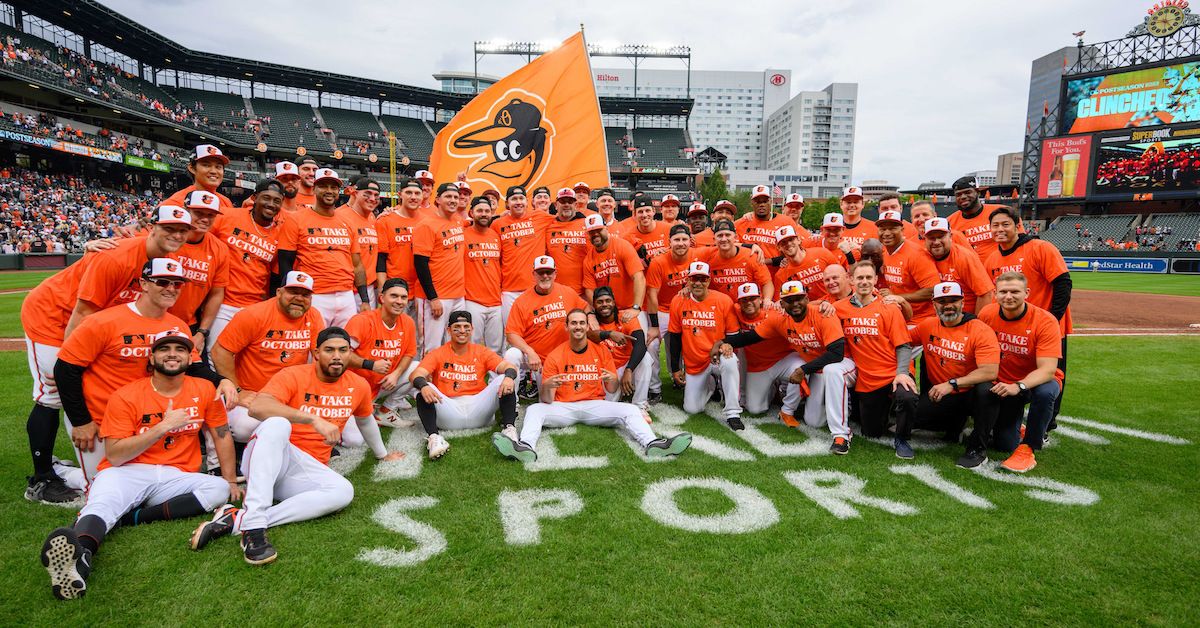
The Orioles have a tight grip on the AL East race. With time running out on the season, they have a 2.5 game lead on the Rays with the tiebreaker in hand; the division title comes with homefield advantage throughout the AL playoffs. Their +127 run differential is the third-best in the AL. So then why oh why do we at FanGraphs think they only have a 5.5% chance of winning the World Series, worse than the Astros and Rays and just ahead of the Blue Jays and Mariners?
It’s happened two years in a row now. FanGraphs keeps doubting the Orioles, and they keep winning. But don’t you worry, disgruntled O’s fans. As the resident Orioles believer – I picked them to win their division before the season, even if that was mostly a statement that they were underrated rather than a sincere belief that they were the best team in the East – I’m here to dig through the madness and see what’s going on.
First things first, in these “why don’t the odds believe in my team?” articles, it’s always good to walk through how the odds work. They’re quite straightforward, though straightforward isn’t the same thing as simple. We start at the player level, averaging the Steamer and ZiPS projections to come up with projections for every player in baseball. Then we manually build a depth chart for each team. From there, we stitch those pieces together to come up with team-level offensive, defensive, and pitching projections. We plug those into the BaseRuns formula and get projections of how many runs per game each team will score and allow, then convert those to expected winning percentages using Pythagenpat expectation.
In plain English, we use two computer systems to estimate how good every player is, then use human expertise to figure out how much each player will play. That gets us to how good each team is. Easy! After that, we simulate out the season and playoffs 20,000 times, and that’s how we end up with the odds. Why don’t our odds like the Orioles more? It’s going to be because of one of those parts.
Before I delve into which part is driving the divergence between our projections and the consensus, let’s talk about the consensus. Betting markets have the Orioles as the fourth most likely team to win it all this year, behind the Braves, Dodgers, and Astros. After accounting for the fact that World Series odds add up to more than 100% (that’s how sportsbooks work), the odds have them around 10% to win it all. That’s nearly double our odds; clearly something is out of whack.
Okay, back to figuring out what’s causing our odds to throw shade on the Orioles. We can rule one thing out right away: It’s not the playing time projections. You can see those right here, and there’s just nothing weird there. The hitters projected for the most plate appearances are Gunnar Henderson, Anthony Santander, Cedric Mullins, and Adley Rutschman. The O’s have 11 games left, and we’re projecting their six-man rotation to handle all of them. Their best relievers have the most projected relief innings. You could stare at these all day and struggle to find anything even slightly odd.
Is our process that converts team statistics into team strength wrong? I’m not going to spend much time on this one because I don’t find it to be a credible complaint. BaseRuns is a complex formula, but the thing it does is quite intuitive: It converts granular results, like homers, doubles, walks, and fly outs, into runs. It includes baserunning. We fold defense in on the pitching side. And even if there were something wrong with it, that would affect every team, not just the Orioles.
That lands us, as it always seems to, with the projections. Let’s put it this way: So far this year, the Orioles have scored 5.13 runs per game and allowed 4.29. The rest of the way, we think they’ll score 4.78 runs per game and allow 4.65. So yeah, our projections just think that the team will be worse going forward than it’s been so far in 2023.
I’ll admit that before I started diving in, I was skeptical of those projections. I know that our odds work well in the aggregate because I’ve tested them. In the long run, we do a pretty good job; the general methodology is solid. Projection systems do a good job in the long run, too. Starting with an idea of how good each player is and adjusting that incrementally based on how they perform in-season yields logical results. Projection systems don’t get too hyped about Elly De La Cruz, something I’ve been guilty of. They don’t get too down on Julio Rodríguez when he starts slowly. On a long enough time horizon, they’re generally right. But could they be wrong this time?
As it turns out, I think they do an excellent job of projecting Baltimore’s offense going forward. So far this year, the Orioles have scored a boatload of runs, as I mentioned. But they’ve done so unsustainably, at least in my estimation. So far this season, they’ve batted .258/.323/.430 as a team. We think that they’ll bat .254/.323/.424 the rest of the way, essentially the same line. The thing is, they’ve scored runs like a team with a far better batting line.
Some of that comes down to baserunning; the Orioles have added roughly 12 runs on the basepaths this year according to our calculations, and we think they’ll be average going forward. That feels wrong to me; I doubt our projections are great at predicting baserunning, and the O’s have been good at it all year. But for the most part, they’re just cashing in runs at a crazy rate. They have the sixth-best batting average in baseball, but the best batting average with runners in scoring position (.288!). With runners in scoring position and two outs, they’re second in the majors. They’re third in wOBA with RISP as compared to 10th overall. With runners on base, their slugging percentage jumps by 23 points, as opposed to eight points for all teams in aggregate.
I just gave you the simple statistics describing how well the Orioles have done when the chips are down, but there’s a fancier way to think about it too. BaseRuns takes everything about an offense into account – how often runners take an extra base on hits, how often the team puts the ball in play, sacrifice fly rate, whatever you can imagine – and tries to figure out how many runs the team will score given those inputs. It thinks that the Orioles “should” have scored 4.81 runs per game so far this year. In other words, if the O’s keep hitting like the O’s, but lose their distribution of having more good outcomes with runners on base, they’ll perform basically like our projections.
Does this mean that we think they’re just getting lucky? I think that misunderstands what “luck” means. The Orioles have earned those runs. It’s not luck when you clobber a home run or lace a double; in fact, it’s overwhelmingly skill. But when you happen to do it, the temporal distribution of your results? It’s fortunate to have them in good spots. No one’s denying that the Orioles have risen to the occasion this year, and I think calling that luck is unfair. But I also don’t think they have an innate talent for doing that, and well, neither do an overwhelming number of studies of “clutch” in baseball over the years.
Okay, so I understand our offensive projections, and why the Orioles fall short of what you might expect from a cursory look at the team’s run scoring. On the pitching side of things, however, further digging is required. As I mentioned up above, the O’s have allowed 4.29 runs per game. Per BaseRuns, they “should” have allowed 4.36 runs per game. There’s not much of a discrepancy there. Yet our projections think they’ll be worse by a third of a run going forward. Weird, no?
Our projections disliked Baltimore’s pitching heading into 2022. We kept projecting the pitching staff to falter, and eventually, it did. This year is a different matter. Here are the actual and projected stats for the first 11 pitchers in our depth chart:
| Pitcher | 2023 ERA | 2023 FIP | Proj ERA |
|---|---|---|---|
| Kyle Bradish | 3.12 | 3.41 | 4.03 |
| Grayson Rodriguez | 4.53 | 4.13 | 3.85 |
| Kyle Gibson | 5 | 4.13 | 4.41 |
| Dean Kremer | 4.17 | 4.66 | 4.25 |
| John Means | 3.60 | 6.36 | 4.3 |
| Jack Flaherty | 5.03 | 4.4 | 4.47 |
| Yennier Cano | 1.94 | 2.91 | 3.79 |
| Danny Coulombe | 2.47 | 2.94 | 3.76 |
| DL Hall | 4.61 | 3.95 | 3.68 |
| Shintaro Fujinami | 7.22 | 4.54 | 4.31 |
| Jacob Webb | 3.44 | 2.55 | 4.18 |
Yeah, uh, those projections mirror what’s already happened almost perfectly. If you take those pitchers’ actual 2023 ERAs and pro-rate them across our projected innings, you’d get an aggregate 4.18 ERA. If you instead look at their projections, you’d get an aggregate… 4.15 ERA. Across the majors as a whole, RA/9 is roughly 0.35 runs higher than ERA, and the O’s have a worse-than-average defense according to Statcast, so maybe you can adjust that up to 0.4 runs per game or so. Now we’re getting pretty close to the 4.66 number we’re projecting them to allow; throw in the lower-leverage members of the bullpen, and we’re basically there.
But it’s really not the guys who are in our projections that are causing the disconnect between the O’s season so far and the rest of the year. No, what’s hurting Baltimore in the projection of runs allowed is that Félix Bautista is missing. So far this year, he’s pitched 4.5% of their total innings and allowed only 2.2% of their runs. If you had replaced his innings with an up-and-down reliever, their team ERA would have increased by roughly 0.15. We also think Cano will get proportionally fewer innings the rest of the way. The same goes for a lot of Baltimore’s relievers who have excelled this year.
That’s the part of the projection I’m most skeptical of, mostly because I think the Orioles do a great job of maximizing their bullpen. The Bautista injury is a real headwind, but I think that we’re missing the boat slightly on the rest of Baltimore’s relievers. I’m not sure how I’d fix this in the projections, because the way we hand out innings works pretty well, but I wouldn’t bet against the team getting the most out of their relievers. Put another way, we project that unit for an aggregate 4.09 ERA the rest of the way, and non-Bautista Orioles relievers have amassed a 3.86 ERA so far this year. I like their odds of continuing that trend.
So when you put all of this data together, what’s the conclusion? I’d say that our projection system slightly underrates the Orioles, largely because I expect their bullpen to perform better than our estimates even without Bautista available. If he is available, as Brandon Hyde suggested over the weekend, that would of course be a huge boost. We’re not projecting much from him – how could you? – but that’s something to keep an eye on.
On the other hand, I think that betting markets are a bit too high on the O’s. This isn’t like last year where our projections were alone on an island and not buying real improvements the team had made. Heck, Baseball Prospectus thinks they’ll outscore their opponents by a single run the rest of the year, and they’re using completely different methodology. Our projections have caught up to the performance, because they incorporate it. The Orioles have posted the underlying metrics of a winning team all year, and so we expect them to keep showing off a solid offense and good bullpen.
The truth, as is so often the case, likely lies somewhere between our naive model and the suggestible public. I do think we’re too low on the Orioles’ run prevention. I think that the general public is too high on their run production. I tried to back into a new projection after accounting for their bullpen being slightly better than our estimates, and that gets me to 7.2% World Series odds. It’s not a huge difference, and you could probably talk me into going a bit higher by highlighting some individual players, but “halfway between FanGraphs and Vegas” sounds about right to me.
Still, I hope I’m wrong about Baltimore’s offense. It’s been fun to watch them crank out wins all year. They’re a blast on the basepaths. Cedric Mullins is just delightful across the board. But saying they’re the 10th-best offense going forward, when they’ve been the sixth-best so far this year, doesn’t feel unduly harsh to me. The Orioles are awesome, and the odds here at the site are probably underrating them. It’s just not for the reasons you’d think, and not by as much as you’d expect, at least in my biased opinion.
Ben is a writer at FanGraphs. He can be found on Bluesky @benclemens.
I care less about the systemic projection system and have more frustration with the “power ranking” methodology to be honest.
Another thing I’m dying for someone to do some updated in-depth work on is exploring the outliers in players and teams with large discrepancies in the major defensive metrics. Statcast discredits the Orioles defense, but DRS and UZR love them.
The projection system is great. There’s room for improvement but it’s not broken–it will tend to beat informed human prognostication. And when human prognostication does beat it, it’s typically because humans have learned what’s important from projections and uses it as a solid base for guessing. If someone were to tweak the model to fit the Orioles it would be overfitting, and probably make the overall model worse.
The power rankings are nonsense because it has no idea what it wants to be. Right now, it’s just a worse version of BaseRuns. Most of the reason that it is worse is due to self-inflicted errors on the run prevention side, where the tools you need to break apart individual performance from the team aren’t needed when you’re looking at team performance. But some sort of rolling average of BaseRuns inputs (maybe scaled by opponent strength) and projections based on current lineups would be something different enough from BaseRuns to be interesting enough to talk about (even if it doesn’t have a lot of analytical purpose).
Exactly. The projection system didn’t deny the Orioles had a chance to be good–a lot could have gone wrong, but a lot went right and the Orioles are profiting. But the power rankings are wildly out of touch and don’t seem to recognize what power rankings are supposed to be.
I’m not sure what power rankings are “supposed to be”, as I can think of at least three distinct options. But it does help if you have a single idea of what it is supposed to be before doing them.
7-10% are Great odds for winning it all – the Birds have a strong shot. I’m happy for their fans who have suffered a lot of losses over the last 10-20 years….with only a few good seasons. they are looking good now….real good.
Great article!
I vaguely remember Fangraphs being generally down on the Orioles for most or all of the time they were a decently successful team from 2012-2016. I think the discrepancies were particularly wide in 2014 when the Orioles won 96 games.
I wonder if Fangraphs could publish its pre-season projections compared to actual results going back the 15ish years those have seemingly been a part of the site, to determine once and for all which teams they actually do hate.
You can actually pull up the preseason odds for every year we’ve had them on the playoff odds tab. I looked back at them in an article that is linked up above.
Coming into 2023, ZiPS had overrate the O’s since 2005 by 1.4 wins per year.
The thing is, win misses in ZiPS — and I’d bet my lunch of Steamer and PECOTA being the same — are not correlated. Even if you look at individual franchises, misses aren’t predictive (though with smaller than ideal sample sizes, but I won’t have a good sample size until long after I’m dead).
of all the “Dan Hates <my favorite team>, I’m most amused when they choose “Baltimore.” He might be the only person in America rooting for a CIN-BAL WS, including The Angelosi.
I don’t think they are correlated over the long run, but in short stints it sorta makes sense that a team might over (or under) perform projections over the course of a number of years.
A group of players that defy expectations don’t make future expectations change that much (that would be a shitty model); so if those players stick together, that could remain sticky.
The fact that the 2018 Orioles “underperformed” by 30 wins doesn’t take away from the fact that in general the 2012-16 Orioles did in fact over-perform these projections. I recall the inability to project the value of a strong bullpen being brought up as a possibility; my guess is that was noise.
Anyway, I was really just looking for an answer to which team has the best case to bitch about favoritism, knowing full well that the idea of “Fangraphs hates my team” is among the dumbest ideas of all time whenever it is said, point blank period.
Is there such thing as/ any use for a projection for the first 100 games of a season? I.e. pre-trade deadline, before a team that might be underperforming sells off and gets noticeably worse or a team that overperforms buys hard at the deadline? one season is such a small sample, but a post-deadline team isn’t exactly representative of the pre-deadline roster sometimes.
This makes a lot of intuitive sense, because projecting reliever performance is the thing projection systems have a terrible time figuring out. And the O’s relievers do not have long track records, even by reliever standards. So Yennier Cano and Danny Coulombe have outpitched their projections by a lot. It will take a couple years of performing like this for the projections to catch up.
On the position player side, there have been a few unexpected successes (Ryan O’Hearn, Aaron Hicks) that also add a little bit, and it helps that pretty much no one is dramatically under their projections.
And then there’s about 5 games worth of sequencing, although it seems like that was mostly early in the year.
How do you get 5? By BaseRuns, they’ve outplayed their performance by a whopping 12 wins.
I was thinking of sequencing in terms of stringing together hits within an inning to get runs, but you could also think of it in terms of getting runs “when you need them” to win the game. You can sort of unscientifically decompose BaseRuns, Pythagorean, and actual record to get to 5 games for the first one, and 7 games for the second. There’s definitely a better way to do it than how I just explained it, but I don’t have the patience to figure it out right now.
I think that giving such a boost for the bullpen is putting your thumb on the scale a bit too much. Yes I agree that the Orioles are/will be able to get more out of their bullpen than the projections show. But can’t we say that about just about any playoff team? For example, the Orioles path to a world series could very well be through Tampa Bay (ALDS), Houston (ALCS), & Dodgers (WS). In each of those matchups I’d imagine that their opponent also gains an advantage from how they use their bullpen (which can also be seen in how much those teams’ bullpens outperform their ERA estimators), which would neutralize the advantage you are giving to Baltimore here
Bullpen projections might be an oxymoron. It is the most difficult to do because it changes the fastest, and a bullpens overall impact can be emphasized or hidden based on so many other things, like offensive production, SP innings, managerial styles, and even bullpen morale/commraderie.
Felix Bautista’s injury leaves a gaping hole in the O’s bullpen, and should have a sizable impact on ROS projections and how they compare to season to date. But a flaw in those ROS projections could also be who you’re giving the innings to and how good you project them to be. Remember how fast bullpens can change? Cionel Perez came out of nowhere to be one of the O’s best relievers in 2022. He was a non-factor for most of 2023, but has gotten himself back on track and looks like a dynamic high leverage arm again. He’s probably the 2nd best reliever in the O’s pen right now and isn’t even listed among the bullpen arms in the article. Will they miss Bautista? 100% Will the projections over-correct the projections of an O’s Bullpen without Bautista if they aren’t giving Cionel Perez many of those innings? Probably.
So to summarize without the numbers and verbiage —
Yeah we don’t like the Orioles. You got a problem with that?
Tell me you didn’t read the article without telling me you didn’t read the article
Apparently my sense of humor is not appreciated. Or perhaps something else.
I thought about trying to disabuse you of the notion that the projection systems specifically dislike this one team and convincing you that it’s not a personal against the Orioles. But instead I’ll just point out that without the numbers and words this article wouldn’t make a whole lot of sense.
So to summarize without the numbers and verbiage: [complete silence]
How do the depth charts handle platooning and bullpen matchups? One of the benefits of a deep roster with fewer stars is playing matchups, like allowing Ryan O’Hearn to face RHP 92% of the time.
The Orioles don’t rank #1 in the majors in many things, but they rank #1 at the plate in terms in % of plate appearances with the platoon advantage. They also rank #1 on the mound in % of batters faced with the platoon advantage.
Between batting and hitting, the Os have the platoon advantage 61% of the time. Most teams (including most playoff teams) are in the 45-50% range.
It’s hard to judge much the effectiveness of Ryan O’Hearn’s platooning with the unsustainable BABIP he’s running. His career BABIP against RHP is .302, but this season he’s at .374.
Doesn’t eliminating the shift have to be a consideration? He seems to have benefitted more than most from that.
And BABIP by handedness is usually crazy lopsided. 374 isn’t high at all for a season.
Probably minimal impact, if any. He actually doesnt pull the ball that much (37% for his career) and he is hitting more flyballs this year. Besides, teams are still playing him with the SS up the middle which is really no different than pre 2023 (and probably actually takes away more hits than the guy playing shallow RF that isnt allowed now). FG hates links but if you look at his spray chart on baseball savant its not the look of a guy who is predominantly smashing groundballs pull side.
The big difference is his barrel rate and hard hit % have skyrocketed this year. In 2022 he had a 7% barrel rate (which is in line with his career avg) this year its 11%. Not surprisingly his hard hit % has also jumped from its usual mid 40% to over 52% this year. He is actually 23rd in all MLB in avg exit velo. Which is probably also why he is running a pretty ridiculous .364 BABIP.
The most logical reason is just platoon advantage and alot of batted ball luck in a relatively small sample size. But thats just my opinion.
I noticed this the other day when looking at total team WAR.
The team with the most WAR in baseball has the best record in baseball (Atl).
The team that ranks 2nd in WAR has the 4th best record (TB)
The team that ranks 3rd in WAR has the 3rd best record (LAD).
But the team with the 2nd best record in baseball, Baltimore, ranks 12th in team WAR!
Sequencing’s a powerful thing.
Yes, but there’s an important asterisk on this – as Ben mentions, Statcast views the O’s defense as a negative (-11.6 Def collectively, 22nd in the league). However, other metrics view them much more positively (+22.9 UZR, 5th in the league, and +32 DRS, 7th in the league). Choosing UZR or DRS rather than OAA would add about 3.5-4.5 WAR to their total. Adding 4 WAR to their total leapfrogs them to #6 in the league in WAR, which is not too far out of whack with their actual results. Choice of stat matters a lot here.
As a sanity check, over at BREF, the O’s rank 7th in WAA, 0.1 behind MIN for 6th (and for whoever’s wondering, the O’s ERA is almost identical to their FIP, at 4.04 and 4.07 respectively).
After over 90% of the season has been played, you still think the Os results are ‘unsustainable’? Isn’t outscoring the opposing team by almost 1 run over the course of 150+ games the DEFINITION of SUSTAINABLE?
“Isn’t outscoring the opposing team by almost 1 run over the course of 150+ games the DEFINITION of SUSTAINABLE?”
Uh…not exactly. No more than “well this coin came up heads 62 times out of 100, this can’t possibly be a fair coin!” is a true statement. I think the article fairly summarizes as “a little better than expected, a little luckier/better with sequencing than expected” which seems a fair place to land.
I like to think they are unlucky when it doesn’t matter!
Glad you used a coinflip example. The odds of a fair coin coming up heads 62% of the time is approx 1%. The odds of a fair coin coming up 70% is less than .4%.
At what point does one ‘adjust his priors’ before betting on tails for the Nth time?
Isn’t that what my comment was about?
…now think of how many sequences of 100 games occur in MLB over the course of the season. Each team has 62 of them alone (games 1-100, 2-101,…etc) and then multiply that over 30 teams. Even rare (1%) events like a “true talent” .500 team will have 62-38 streaks, or 38-62 streaks. Does it mean they’re not a “true talent” .500 team? Nah. Rare events over huge numbers of occurrences become pretty common.
(That said, they may not be a .500 “true talent” team – also true and quite common! Gets really Bayesian really fast…)
Yes, but in this case, the number of games is 150. There are only so many permutations of 150 you can make out of 162.
At what point in the season do you admit: ‘actually, having outscored their opponents by 150 runs, I’m willing to admit we got our expectations wrong, rather than talk about ‘sustainable.’
It’s not as good as outscoring the opposing team by more than a run. They should try that next time.
More seriously, projection systems (especially Steamer) typically do not react much to recent events. If someone shows up and blasts a bunch of home runs in a season, they’re like “cool, but this is probably just a hot streak. it’s inconsistent with the last 2000 PAs they’ve had”. I actually think Steamer is too conservative in this regard, although on the average it’s performed similarly to ZiPS. Which turn outperforms things like run differential (which in turn outperforms actual win-loss record).
“The Orioles are awesome, and the odds here at the site are probably underrating them. It’s just not for the reasons you’d think, and not by as much as you’d expect, at least in my biased opinion.”
But for every single day this season, with the exception of fewer than a dozen days, the Rest of Season projections have, every morning like clockwork, projected the Orioles to be a under-.500 team the rest of the way and to win fewer games than any other team in the AL East going forward from that day. They’ve won 95 games this year. So that’s at least 130+ days thus far that the ROS predictions have been proven pretty inaccurate. What’s up with that?
Keep reading.
Felix Bautista did not get hurt until late August. If expected bullpen regression is the reason why projections have dipped, then explain to me May, June, July and August until Felix’s injury. Because I see nothing in the article that explains the rest of season projections for those months where, on a daily basis, they projected the O’s to be under .500 rest of season on a daily basis almost without fail.
Well there has been expected bullpen regression from Bautista and Cano all season as well as regression from Bradish and Wells. Looking at their BaseRuns record, they’ve played like an 89 win (over a full season) team so far. If that is with players performing above expectations, then it isn’t too hard to get to a sub .500 projection if Cano, Bradish, and Wells are treated as true talent 4+ ERA pitchers.
The projections adjust as we get more info that O’Hearn and Cano might be appreciably different players than we thought they were. But even with that, no projection is going to expect O’Hearn to keep putting up a 134 wRC+ after he had a 68 wRC+ over the last 4 seasons.
He’s now facing LHP only 8% of his PA, where previously it was more than 15%. If his usage has changed, isn’t it reasonable his outcomes might change as well?
Fair point, but moving 7% of your ABs from LHP to RHP isn’t going to take you from a 68 wRC+ to a 134 wRC+ alone.
There’s only a few weeks of baseball left. Why would we expect results to normalize now?
We should always expect results to normalize today. This is true no matter what day it is.
*except Wacky Wednesday
This seems tremendously confused and garbled to me. Or at least, your objection to the word “luck” appears, as far as I can tell, to be based on a mistake about its meaning, which is why you’ve settled right back on the synonym “fortunate” while still seeming to think you’re drawing a distinction. No one who says that the sequencing of hits is “luck” has ever meant by it that the individual hitters didn’t “earn” their hits.
Then why is it unfair? Using the words “luck,” “chance,” and/or “noise” for exactly this kind of thing is common usage among the statistically literate and has been for more than a century. Apart from voicing a vague sense of discomfort with some wrongly imagined connotation here I simply can’t understand what you are trying to say.
I think the real underrating of the Orioles by the Fangraphs projections was on July 4, when they gave the Os only a 50% chance of making the playoffs. On that date they had the third best record in the AL and a 2-game lead over their closest pursuers, the Yankees and Astros, and a 4-game lead over the Blue Jays. Yet Fangraphs thought all of those teams were more likely to make the playoffs, anywhere from 61% to 75%.
I’m not an Orioles fan, but I noted their rise last season especially after Rutschman started playing. By mid-August 2022 both the Os and Red Sox were too far back to have a decent chance at the playoffs, but the Os were 3.5 games ahead (using stats as of August 15) — but the Fangraphs projections gave the Red Sox a much higher playoff probability, 13.6% to 4.6%!
The Red Sox were stick-a-fork-in-them done by that point in the season, everyone knew they were going through the motions as indeed happened the rest of the season. Whereas the Os wanted to, and did, keep on their new-found winning ways.
I conjecture that the Rest of Season projections should put more weight on this season’s stats than they currently do. Or maybe even more weight on the more recent within-season stats. The Fangraphs as well as the BP projections seem to hold on a little too stubbornly to their pre-season levels.
IIRC, either Ben or Dan looked into this recently (like in the last 2 years) and found that preseason projections were more accurate than in season performance for projecting ROS results through like mid-August. I think that was adjusting for personnel changes (so trades and injuries) but not in-season performance, but I might be misremembering.
Just in the current season, on July 1st (roughly the halfway point of the season) the Rangers were projected for a .508 ROS winning % despite having the 3rd best record in baseball at the time. Since they they’ve gone 33-35. The D’Backs had the 4th best record, but were projected to go .505 the rest of the way, their actual record is 30-38. The Orioles had the 5th best record and were projected for a .476 ROS winning %, they’ve gone 47-23 since.
All of those were young breakout teams that greatly outperformed expectations in the first half that the projections didn’t believe in. Since then two of them have played in line with expectations, while the Orioles have won at an even better clip. I’m not sure there is any clear thing that you could point to at that point and say the Orioles were for real while the D’Backs and Rangers weren’t.
I love the power rankings, not least because it causes folks to spend time complaining when they could be enjoying their teams’ improbable success.
If you flip the 1 run outcomes the birds record switches to 4 games under 500. they win every coin flip. extremely lucky team with dog-S pitching will get bounced first series of poffs
True. But, not really inconsistent with the article and the discussion. The things people are discussing, particularly bullpen quality and fielding, are just the things that would lead to a better than 50-50 record in 1-run games. Not this good, of course. There is no doubt that a good chunk of the Os overperformance last year and this is down to luck. Now, if it happens again next year, we’ll have to think about revisiting that conclusion. At some point, it becomes implausible to keep insisting it’s just luck.
The Orioles are 28-15 in 1-run games. Switching the outcomes puts them at 82-70, which is decidedly not 4 games under .500.
Although, a comment saying “extremely lucky team with dog-S pitching” doesn’t seem like someone trying to make a rational, or even true, take.
Fangraphs thinks the Orioles have had the 6th best pitching in MLB, and flipping the 1 run games would leave the Orioles 12 games over .500, but go off king
I was thinking about the offensive overperformance and I had an epiphany: the Orioles seem to do much better when facing a pitcher a second time. Anecdotally, pitchers seem to cruise for 2-3 innings, and then in the 4th or 5th, the O’s get a runner on, the pitcher has to pitch from the stretch for the first time that day, and their mechanics get thrown off sync and they allow more hits. And I went through the splits and that appears to be the case; .303 wOBA against starters the first time through, .346 2nd time through compared to a league average of .323. If this is a repeatable skill then it would explain why the Orioles are outperforming their underlying stats offensively. The O’s perform about how you’d expect them to against relievers, so that means that a disproportionate number of hits against them are coming in during a starter’s 2nd or 3rd time through the order. Compressing a team’s hits in 3 or so innings is going to lead to more runs scored versus an even distribution of hits.
This *feels* like a repeatable skill to me, though what feels right versus what is actually the case aren’t always aligned.
Is there convincing evidence that Orioles hitters happen to have the skill of hitting pitchers better the second time through the lineup more than folks who wear other uniforms? It would take more than 1 year’s worth of data to prove that.
Yeah this seems like a tenuous connection at best. Every team hits better the second time through the order and the difference between a good team and an avg team is pretty marginal. Its certainly not big enough to be able to attribute it to skill as opposed to just randomness.
Even if it was real how many extra Wins does 0.023 points of wOBA translate too? (thats the difference between the O’s and the league the 2nd TTTO) I’m guessing not enough to matter much.
Well, it’s about 15 runs difference for 1 qualified player between .323 and
347 wOBA, and the O’s have had ~1300 PAs the 2nd time thru the order, so thats about a 30 run improvement. But you are more likely to have advantageous sequencing if you are clustering more of your hits in 2 or 3 innings of every game.
One thing that has struck me as odd about Fangraphs’ RoS forecasts for team w/l records: even as the O’s baseruns-based w/l record improves over time, their RoS team forecast stays at ~.500. It seems to indicate a lack of (or too weak) updating of priors. I might be remembering things wrong tho
I just noticed the O’s RoS w/l forecast is finally above .500 (.513). This is definitely pretty recent.
Anyway, is there any empirical proof that having a super dominant closer (or just a strong bullpen) helps a team outperform its pytho record?
You are definitely remembering correctly. Until this week, the ROS projections for the Orioles were sub-.500 for every day of the season except a handful (when they were projected to be 1 game over .500 ROS) even when they were winning at a .630 pace through August. Wake up, open the app, and there’s a ROS projection of .490 or so for the Orioles, just like clockwork.
Why use just statcast for Defense? They rank much higher with other measures. They have something like top 5 in fielding percentage (I know) But they don’t make errors, they don’t let up passed balls (Rutschman) has 0 on the year). I know eye test is whatever but watching this team they don’t have a below average defense. I think this is where some/a lot of the difference is going.
I’m getting my Orioles hat out of the closet!
They’re the opposite of the Padres who are something like 0-11 in extra innings
It’s becoming an annual exercise at this point, dating all the way back to 2014 …
Pythag doesnt consider leverage, which means it underrates teams with, say, 2 of the best relievers in baseball. Wow this team with the closer with a 1.46 era and a setup man with a 1.94 era sure is getting “lucky” by winning a lot of close games!
There are rumors that 4-5 teams are cheating at the plate including the braves orioles rangers to name a few. As far as i know the Braves have been the only team caught this year which was posted on social media few months back.
The projections are largely right, but the Orioles are outperforming them for a reason. Roster has several minor leagues type players outperforming. Same as several Minor league type on the Rangers. The 1 yr turnarounds for several of these players on these teams are too good to be true. Maybe 1 player but not a whole roster.
Great article.
However, it begins by posing the following questions, edited by me:
“The Orioles have a tight grip on the AL East race. With time running out on the season, they have a 2.5 game lead on the Rays with the tiebreaker in hand….. So then why oh why do we at FanGraphs think they only have a 5.5% chance of winning the World Series, worse than the …… Rays….. ?”
The O’s are obviously overwhelming favorites to win the Division and get the bye, what with their lead, tiebreaker in hand and so few games left. How can they possibly have a lower chance of winning the World Series than the Rays? Clearly, nothing in the article implies that the projections are so down on the O’s as to make them less likely to win the World Series than a team that will very likely need to go through an extra round of playoffs.
I did a quick comparison of team OPS over the season when ahead and when behind. On average it is 28 points lower when teams are behind. For the As, Rangers, Astros, Brewers, Padres and Pirates it is more than 80 points lower. Eight teams have a bigger negative split than the largest positive split, which is the Dbacks with +0.071.
The nine teams with a positive split have a mean power rankings “luck” score of +3, the 21 others -1.3.
I doubt that this relative underperformance can be built into any prediction, but I found it striking.
I suspect that Baltimore’s league-leading BA with RISP has had a greater impact on W-L than has been somewhat glazed over here. I can’t say it’s predictive or sustainable, but I’m reminded of the 2018 Red Sox — who rode that video-assisted “skill” to a championship — and the overperforming 2013 Cardinals team that shattered the stat record and reached the World Series.
The two-sided question for O’s fans is how much clutch hitting is diminished by stronger playoff pitching, and is their own staff potent enough to have a similar impact on the opposition? Sans Bautista, I’m skeptical of the latter.
I have no issue with the projection system. It’s really, really hard to project “players will mesh really well with the coaching staff and develop better than expected”. So you get outliers with young teams, because of lack of data and the outsized impact of coaching development.
The primary issue is with the power ranking series, which needs a serious re-evaluation, as it is deeply flawed.
With a younger team I’d expect it to be more difficult to forecast how the team will perform. As highly touted as some of these prospects are it’d be unfair to assume anything elite. I would be curious how the formulas factor in minor league performance weighted against league averages to try and estimate their value.
I put $100 on the Orioles to make the playoffs before spring training. I also bet on the Diamondbacks, the Marlins, and the Pirates the same day. 2-3 or so months ago, I looked like a genius about to make $2500. but I’m still doing well. The Orioles alone profit me $350. but I’ll have $1300 if the Marlins and Backs go as well. These were the 5-8th sports bets in my 58-year lifetime. So you weren’t alone in believing in Baltimore.
So you’re saying that back in March you were able to get the Orioles at +750 just to make the playoffs? Not win the division? Interesting. What book was that with? Because I looked at each team’s odds prior to the start of the season and placed a few bets myself, and IIRC the O’s were only around +400 to make the playoffs. Those odds were too short for me so I decided to pass. I did, however, bet on the O’s last season to make the playoffs at +2200. Unfortunately I was a year too early…
no my understanding was a $100 bet paid $450. My profit was $350. I do not understand your math. Maybe you know something I don’t though because I rarely make these bets.
I have always reasoned that runs saved are a tiny bit better than runs scored towards winning (I think the Marlins and Brewers agree), but I do not have the stats skill to prove it. Logically teams lose games they score 10 runs in somewhat frequently. but they never lose a shutout. plus, more runs are in excess that are scored in a win than runs saved in a win. I once heard about an old timey game where the cubs scored 20 plus runs and lost. There are many seasons where the highest scoring team had a losing record (see history of the Rockies). There have been years when the team who gave up the fewest runs also had a losing record, but far less frequently. So, if a projection system treats all runs as the same, I’ll wager it’s not ideal. If a team is extreme at scoring or run prevention and not particularly strong the other way the projections will miss more on those teams. Just my useless thoughts.