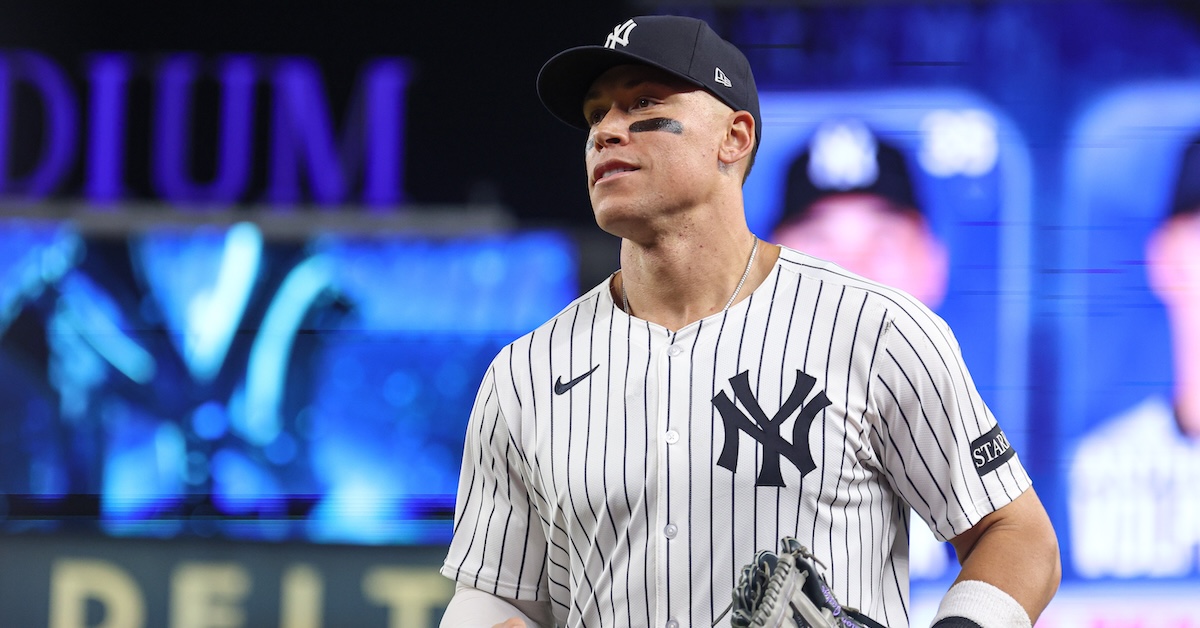
When Should You Intentionally Walk Aaron Judge?

If you’ve ever struck up a conversation with a stranger at the ballpark, you might have noticed that the FanGraphs readers are easy to spot. Let’s say you find yourself discussing the Yankees. A FanGraphs reader might ponder whether the 30-point gap between Paul Goldschmidt’s wOBA and xwOBA will catch up to him, while a non-reader is more likely to fret over whether Brian Cashman is too reliant on analytics when constructing the team’s roster. But sometimes, the two groups ask the same thing. So today, let’s consider one of those broad questions: Should teams be intentionally walking Aaron Judge more often?
Admit it. You’ve wondered. If you’re a Yankees fan, you’ve wondered just how long Judge is going to be allowed to hit in big spots. If you’re a fan of the team the Yankees are playing, you’ve wondered how your team’s manager ought to solve this impossible puzzle. And if you’re a neutral fan, well, Aaron Judge is the biggest story in baseball right now. He’s having one of the best offensive stretches in the history of the game. Don’t you want to know if there’s anything that can be done about it?
Ever since Barry Bonds broke the sport in the early 2000s, every hot streak in baseball comes with questions about the “Bonds treatment.” Now, that doesn’t necessarily mean 120 intentional walks, Bonds’ tally in 2004 and the single-season record. (It’s the single-season record by 52 walks. Second place? Barry Bonds. Third place? Barry Bonds.) The best non-Bonds total was Willie McCovey’s 45 in 1969. The most Judge has ever racked up in a single season is a measly 20. So the question isn’t whether teams should treat him like Bonds, because no, they shouldn’t. But should they treat him like McCovey? And more importantly, how should opposing managers handle Judge in a playoff game, when all the chips are on the table? Let’s do some math. Read the rest of this entry »