Author Archive

Reds and Mets Game the MLB Draft System

Baseball teams continue to search for whatever edge they can find when it comes to bringing cheap, talented players into their organizations. The draft is one of the easiest ways for teams to accumulate talent, as clubs take turns picking the best amateur players in the country, and the Commissioner’s office, as authorized by the CBA between the players and owners, tells teams how much they are allowed to spend. Most amateur players have very little leverage, and generally sign for the recommended slot amount. Because individual draft picks receive a slotted amount, but teams are allowed to spend their entire draft pool in whatever manner they choose, money often gets moved around pick-to-pick, with those players with less leverage receiving much less than the slot amount for their pick while those players with some leverage getting quite a bit more. This year, the Reds, Mets, White Sox, and Marlins all appear to be moving significant money around in an effort to manipulate the draft system to their benefit. Is it worth it though?

While every team moves money around in the draft, these four clubs stood out for drafting hard-to-sign prep players in the early rounds, then taking college seniors with multiple picks later in the first 10 rounds. Presumably, the college senior picks will sign for amounts significantly under their slot value (you can find all the slot values here), meaning the savings can be used to sign the prep players who threatened to go to college if their bonus demands are not met. Here are the teams, players, slot amounts, and the number of senior signs for each team.

Potential Overslot Draft Picks
Team Player Pick Slot Senior Signs
White Sox Andrew Dalquist 81 $755,300 6
Reds Tyler Callihan 85 $710,700 3
Mets Matthew Allan 89 $667,900 7
Marlins Evan Fitterer 141 $390,400 7

All four players are likely to require more than their draft slot provides in order to sign a contract with their drafting teams. Tyler Callihan has reportedly agreed to a deal for $1.5 million. Allan is rumored to have an asking price of about $3 million, which might be why the Mets selected seniors with seven picks in the first 10 rounds. The slot for Evan Fitterer is pretty low, requiring the Marlins to make sacrifices with many of their subsequent picks. We don’t yet know exactly what it will take to sign all of the players listed, but we do have an idea of how much value teams gave up in later rounds, as well as the expected value of the players who were picked. Read the rest of this entry »


Craig Edwards FanGraphs Chat–6/6/19

Read the rest of this entry »


Craig Kimbrel Is No Longer a Free Agent

Eight months ago, Craig Kimbrel declared for free agency. A lot has happened since then. There were rumors in November that Kimbrel wanted a six year deal. We don’t know what happened to Kimbrel’s demands or when. We don’t know what offers were made and then rejected, or not made because of those perceived demands. We don’t know if draft pick compensation was a legitimate concern or simply an excuse for teams to hide behind. What we do know is that Craig Kimbrel is no longer a free agent. Ken Rosenthal first reported that Kimbrel had agreed to a deal with the Chicago Cubs for three years and roughly $45 million, with Jeff Passan reporting Kimbrel will make $10 million this season and $16 million in each of the following two years with a $1 million buyout on a team option for 2022.

Every team could use Craig Kimbrel. The Red Sox — whose current saves leader, Ryan Brasier, has a 5.30 FIP and ERA over four as the team has struggled to stay above .500 — wasn’t interested in bringing Kimbrel back and paying the 75% tax on his salary. The Atlanta Braves — who are in a fight for first place with a below replacement level bullpen performance that is worse than every teams outside of Miami and Baltimore and payroll flexibility coming off a division title and new taxpayer-funded stadium — opted not to get involved. The Nationals — with an MLB-worst 6.66 bullpen ERA as they try to get back into playoff contention — chose to try and stay below the competitive balance tax. The Brewers — who watched Corey Knebel go down with a season-ending injury and watched their 2018 strength turn into a liability outside of Josh Hader — sat and watched Kimbrel go to their rival. Read the rest of this entry »


Regression Didn’t Come for Kyle Freeland

A year ago, Kyle Freeland had a very good season. For some, it was almost too good. Here at FanGraphs, Freeland put up a 3.67 FIP, and playing half his games in Colorado meant a 4.2 WAR in over 200 innings and one of the 10 best pitching seasons in the National League. Freeland’s ERA was even better than his FIP, and with a 2.85 mark, his RA/9WAR was 7.5, the fifth-best mark in all of baseball. The distance between his ERA and FIP likely created a gap between those who believed Freeland was one of the best pitchers in baseball and merely a good one. The latter group thought that Freeland was in for some regression this year. After a rough two months, including time on the injured list, Freeland has been dispatched to the minors. That’s not regression. Allow me to explain.

Before being sent down, Freeland had a 6.37 FIP, a 7.13 ERA, and had given up 16 homers in 12 starts after giving up 17 in all of 2018. After last season, it’s possible some were expecting another sub-three ERA, but doing so would have been unrealistic. Expecting some regression might have meant that Freeland’s BABIP would go up from the .285 where it was a year ago and his LOB% would go down from 83%. Those numbers wouldn’t affect his 3.67 FIP, but it might take his ERA closer to his FIP. Maybe Freeland’s 8.5% HR/FB would creep up closer to average, leading to a higher FIP and ERA. In fact, projections considered many of those factors and forecast Freeland for a roughly average season with an ERA and FIP around 4.50. If regression had come for Kyle Freeland, that might have been what it looked like. If Freeland were pitching just like last season, we might expect a similar FIP and worse ERA. The problem is that Freeland isn’t pitching like he did last season. This isn’t regression (or reversion). This is Kyle Freeland being not as good of a pitcher as he was a year ago.

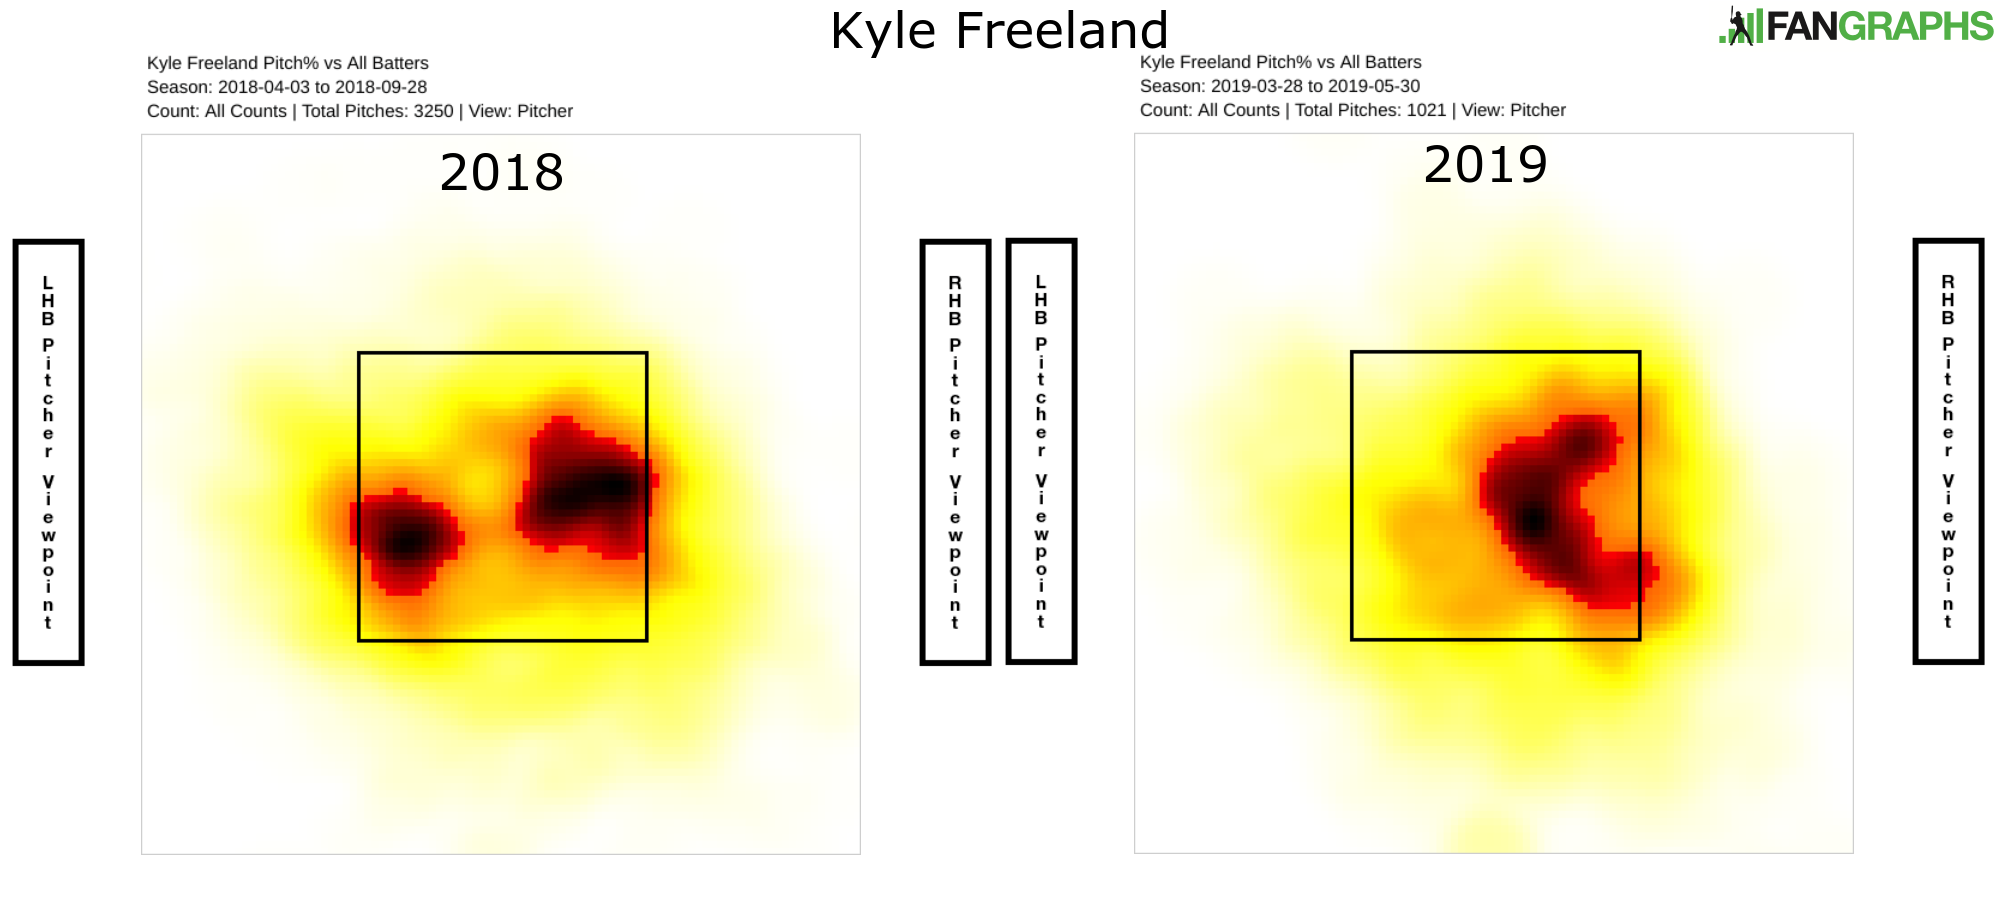
Freeland is a command lefty who excelled last season by pitching to his spots. In late 2018, Jeff Sullivan wrote about how good Freeland’s command had been all season, using multiple heat maps. We’ll engage in a similar exercise below, showing Freeland last year and this year. First, here are all of his pitches in 2019 compared to all of his pitches last season:

Read the rest of this entry »


The Most Exciting Team in Baseball

As a baseball fan, winning feels great and losing feels awful. When teams win in dull fashion, fans are generally content to take the wins even if they aren’t all that thrilling. The Astros, Twins, and Dodgers are blowing teams out on a regular basis, but those wins aren’t causing too much consternation. But on the other end of the spectrum are teams that lose a lot of games and fail to provide much excitement during those contests. These are the bad teams that fall behind early and don’t give too much reason in terms of wins and losses to keep following the game. By combining a team’s winning or losing ways with how important at-bats tend to be, we can determine the most exciting team in baseball, as well as the most miserable club.

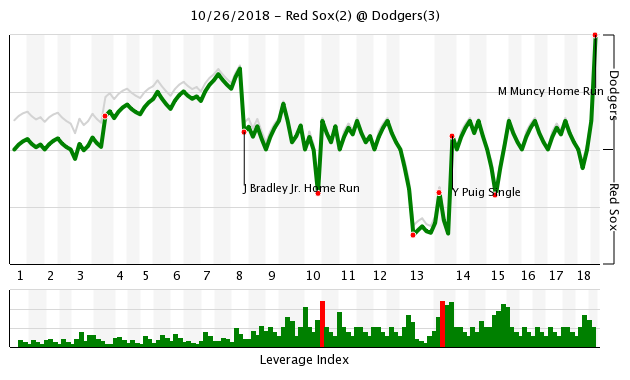
To determine how often teams have tension-inducing moments, we can take a look at Leverage Index (LI). Our glossary says “Leverage Index is essentially a measure of how critical a particular situation is. To calculate it, you are measuring the swing of the possible change in win expectancy.” A game’s LI starts at 1.0, and the more meaningful plate appearances gets, the higher the index rises; if plate appearances become less meaningful, the index goes lower. Leverage Index shows up on our Play Logs and is on the bottom of our Win Expectancy graphs. Here’s one for Game 3 of last year’s World Series:

The bars along the bottom identify the biggest moments of the game, even if something big doesn’t show up on the scoreboard. For teams, we are dealing with more than a thousand plays at this point in the season. If we take the average LI of every play, we can see if teams have a tendency to have a decent number of important moments during their games or if things are decided relatively early, with the players playing out games with little chance of changing the outcome. Read the rest of this entry »


Finding Cody Bellinger’s Weakness

It doesn’t take an ardent reader of FanGraphs or a great appreciator of advanced statistics to understand that Cody Bellinger is having an incredible season. Twenty home runs and a .377 batting average will get you noticed by anybody and everybody. However, appreciating the type of work and the numbers available at this site might aid in understandings and enjoying just how good Bellinger has been. Devan Fink wrote about it here not too long ago. Mike Petriello added his insight. Travis Sawchik’s analysis is out there. Sam Miller offered some context and so has Ginny Searle. If you favor more traditional outlets, Andy McCullough of the LA Times is on the case as well. Rather than build on the already good work of others, let’s take up a different task: Let’s try to get Cody Bellinger out.

As a pitcher, strike one is incredibly important. When pitchers get to 0-1 this season, batters are putting up a 63 wRC+, but if the hitter gets ahead 1-0, those swinging the bat have the advantage and put up a 128 wRC+. So what happens when a pitcher gets ahead of Cody Bellinger? It doesn’t matter at all. This season, Bellinger is putting up a 207 wRC+ in the 111 plate appearances when he falls behind on the first pitch. That mark slightly undersells the “advantage” of trying to get ahead of Bellinger, as he’s 10-for-18 on the first pitch with four homers, a triple, and two doubles. There really aren’t any counts where pitchers gain an advantage and keep it throughout a plate appearance against him.

Cody Bellinger By Count
Through* PA wRC+ Rank
0-1 111 207 1
1-0 108 186 28
0-2 38 169 2
1-1 99 183 4
2-0 54 194 68
1-2 61 108 14
2-1 66 202 26
2-2 55 129 19
3-2 36 284 2
*Numbers include PA results after the designated count has been reached.

Getting to a 1-2 or 2-2 count is better than not, but he’s still been one of the best in the game in those counts, and his 127 wRC+ with two strikes ranks fourth in baseball this season. Bellinger has been pretty close to the same great hitter in any count. When the count has been 0-2 this season, he has just one swinging strikeout on pitches outside of the zone, and on the 15 pitches in the zone, he’s swung at 13 and only whiffed twice with five fouls and three hits in six batted balls. Read the rest of this entry »


Craig Edwards FanGraphs Chat – 5/30/2019

Read the rest of this entry »


How Anthony Rizzo is Beating the Shift

Even though he’s just 29 years old, the last few seasons of Anthony Rizzo’s career have looked a lot like a player in decline. At its most basic, Rizzo’s offensive production looked like this:

He hit for a 155 wRC+ back in 2014, dropped 10 points, held steady for a season, dropped 10 points, and then dropped 10 points again. The simplest of graphs doesn’t always tell the story, though, and so far this season, Rizzo is hitting as well as he’s ever has. In a less simplistic view, here’s Rizzo’s 50-game rolling wRC+ since 2014. Every point represented below shows roughly one-third of a season to help eliminate a slump over a few weeks or some fluky results:

Even here, we seem to see a long slow creep downward, with the highs not quite as high and the lows a bit lower. Where the difference is compared to the yearly numbers is in the 2018 movement. There is a huge valley to start the season with a massive peak higher than anything Rizzo has done since 2015. The two evened out and resulted in a somewhat disappointing year before we get to a small valley to start this season with another good peak, both of which look similar to Rizzo’s profile prior to 2018. When we break out some of Rizzo’s numbers, consistency appears more prevalent than a decline. Read the rest of this entry »


Jorge Polanco Puts PED Suspension Behind Him

Heading into spring training ahead of the 2018 season, there was a fair bit of optimism regarding Jorge Polanco despite a so-so 2017 campaign. He earned a starting job in 2017, but some early season struggles spiraled after a death in the family. He lost his starting position and heading into August, his 47 wRC+ was the worst in baseball among those players with at least 300 plate appearances. Polanco basically salvaged his season over those final two months by putting up a .317/.377/.553 slash line with 10 homers and a 145 wRC+ in 234 plate appearances. At 24 years old, he looked like he was building on his solid prospect status as part of a young Twins core expected to contend. An 80-game suspension for PEDs announced in spring 2018 robbed Polanco of the first half of games and the latter half of the season was rather uneventful, with a decent 110 wRC+ and 1.3 WAR. Through two months of the 2019 season, Polanco has been the best player on the team with the best record in baseball.

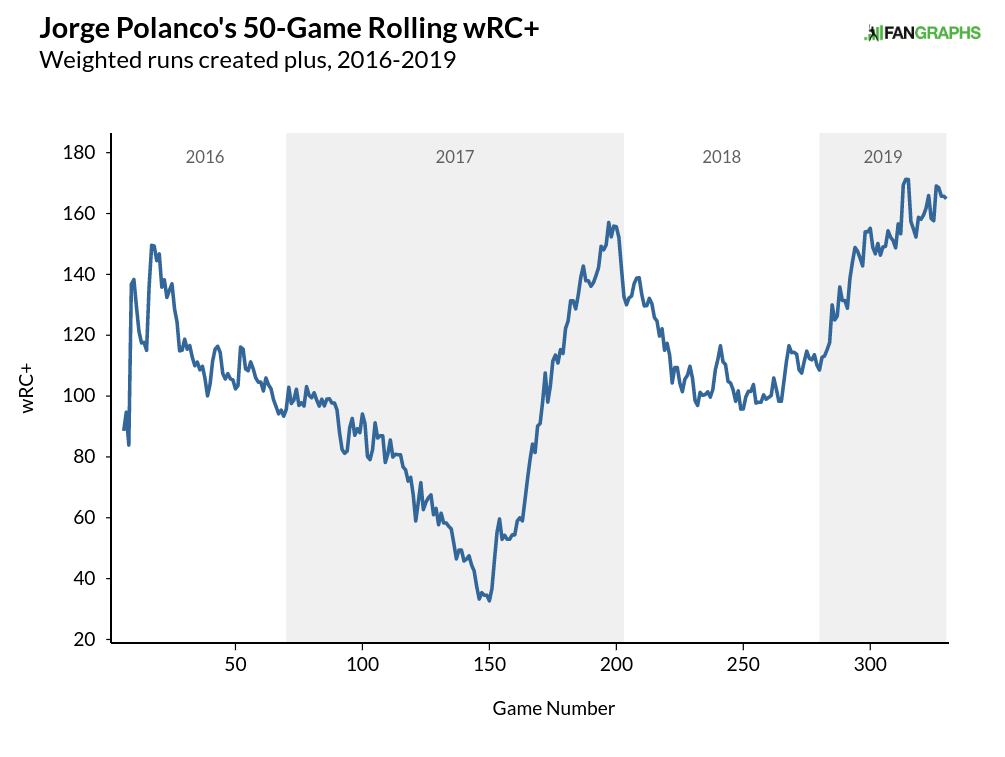
Jorge Polanco is hitting a robust .335/.405/.583 with a 160 wRC+ and a 2.6 WAR. That ranks eighth in all of baseball and is already half a win better than his preseason projections. After that decent half-season in 2018, it’s fair to call this season’s performance a big surprise, though it wouldn’t be fair to say he’s never done this before. Below you’ll find Polanco’s 50-game rolling wRC+ since the the 2016 season when he first got a real shot at playing time:

Read the rest of this entry »


The Team-By-Team Draft Cost of Signing Dallas Keuchel or Craig Kimbrel

We don’t know exactly why Dallas Keuchel and Craig Kimbrel didn’t sign with teams during the winter and early spring like the other prominent free agents did. It’s possible that early posturing around large contract demands pushed some teams away and caused them to explore other options. It’s possible there were just too many teams that weren’t sufficiently interested in adding good players at a reasonable cost, even if Keuchel and Kimbrel’s demands had come down. We do know that neither signed before the season, or in April, and that coming up on the end of May, both players are still looking for a team.

What we might have heard over the last few months is that teams are waiting until after the draft in June to sign Keuchel or Kimbrel so as to avoid losing a draft pick. Over the last decade, as the game has gotten younger and younger players have gotten cheaper relative to veterans, teams have placed greater emphasis on draft picks. Ahead of the last CBA, one of the bigger issues for players was the free agentcompensation system, in which teams made qualifying offers to free agents and then received a first round pick (or something close to it) when those free agents signed elsewhere. One of the major changes in the new CBA was a change to that system designed to make free agents more attractive by lessening the penalty for signing free agents attached to a qualifying offer. While Keuchel and Kimbrel aren’t ironclad proof the system didn’t work, they are a couple of key pieces of evidence. A breakdown of the penalties provides further reasoning.

To understand why the system hasn’t worked, it helps to look at the penalties. Here are the rules from MLB:

Any team that signs a player who has rejected a qualifying offer is subject to the loss of one or more Draft picks. However, a team’s highest first-round pick is exempt from forfeiture, which is the most notable change that went into affect with the new system. Three tiers of Draft-pick forfeiture — which are based on the financial status of the signing team — are in place to serve as a penalty for signing a player who rejected a qualifying offer:

• A team that exceeded the luxury tax in the preceding season will lose its second- and fifth-highest selections in the following year’s Draft, as well as $1 million from its international bonus pool for the upcoming signing period. If such a team signs multiple qualifying-offer free agents, it will forfeit its third- and sixth-highest remaining picks as well.

Examples: A team with one pick in each round of the 2019 Draft would lose its second- and fifth-round picks. A team with two first-round picks and one pick in each subsequent round would lose its second-highest first-round pick and its fourth-round pick.

• A team that receives revenue sharing will lose its third-highest selection in the following year’s Draft. If it signs two such players, it will also forfeit its fourth-highest remaining pick.

Examples: A team with one pick in each round of the 2019 Draft would lose its third-round pick. A team with two first-round picks and one pick in each subsequent round would lose its second-round pick.

• A team that neither exceeded the luxury tax in the preceding season nor receives revenue sharing will lose its second-highest selection in the following year’s Draft, as well as $500,000 from its international bonus pool for the upcoming signing period. If it signs two such players, it will also forfeit its third-highest remaining pick and an additional $500,000.

Examples: A team with one pick in each round of the 2019 Draft would lose its second-round pick. A team with two first-round picks would lose its second-highest first-round pick.

Determining exactly which picks can be forfeited is a little tricky, as essentially all picks count when determining a team’s second, third, or fourth pick, but compensatory picks from not signing a player the previous season, as well as the market/revenue picks at the end of the first and second rounds, are not subject to forfeiture. That said, since the market/revenue comp picks can be traded, if one of those picks is traded to another team, it is no longer protected. For example, Oakland was awarded the 40th pick in this year’s draft. That pick would have been a protected pick for the club, but since they traded it to Tampa Bay in the Jurickson Profar deal, it becomes subject to potential forfeiture for the Rays if they were to sign Dallas Keuchel or Craig Kimbrel.

To provide concrete examples, the table below shows the pick every team would give up for signing Keuchel or Kimbrel right now, along with the slot value for that pick (which can be found here), and the present value of the pick based on my research. Also included is the value of the international money penalty based Kiley McDaniel’s research, with one dollar of international spending estimated at five times that amount in value.

A note about this table: Houston and Boston are assumed to sign their own free agent, and thus not get a compensatory pick, which is the value listed below. In reality, that pick is now worth considerably less, as it is far less likely to happen. If Boston or Houston were to sign the other team’s free agents, the cost would be significantly higher.

Penalty for Signing Dallas Keuchel or Craig Kimbrel
Pick for FA Slot Amount Present Value of Pick International Value Lost Extra Cost of FA
NYY 38 $1,952,300 $8.1 M $2.5 M $10.6 M
TEX 41 $1,813,500 $7.4 M $2.5 M $9.9 M
ARI 33 $2,202,200 $9.3 M $9.3 M
CHW 45 $1,650,200 $6.7 M $2.5 M $9.2 M
SFG 51 $1,436,900 $5.8 M $2.5 M $8.3 M
TOR 52 $1,403,200 $5.7 M $2.5 M $8.2 M
NYM 53 $1,370,400 $5.5 M $2.5 M $8.0 M
LAA 55 $1,307,000 $5.3 M $2.5 M $7.8 M
TBR 40 $1,856,700 $7.6 M $7.6 M
STL 58 $1,214,300 $4.9 M $2.5 M $7.4 M
CHC 64 $1,050,300 $4.3 M $2.5 M $6.8 M
PHI 91 $647,300 $3.8 M $2.5 M $6.3 M
WSH 94, 183 $884,200 $6.3 M $6.3 M
LAD 78 $793,000 $3.8 M $2.5 M $6.3 M
MIN 54 $1,338,500 $5.4 M $5.4 M
PIT 57 $1,243,600 $5.0 M $5.0 M
ATL 60 $1,157,400 $4.7 M $4.7 M
BAL 79 $780,400 $3.8 M $3.8 M
KCR 80 $767,800 $3.8 M $3.8 M
MIA 46 $1,617,400 $6.6 M $3.8 M
DET 83 $733,100 $3.8 M $3.8 M
SDP 84 $721,900 $3.8 M $3.8 M
CIN 85 $710,700 $3.8 M $3.8 M
SEA 76 $818,200 $3.8 M $3.8 M
COL 100 $581,600 $3.8 M $3.8 M
CLE 101 $577,000 $3.8 M $3.8 M
OAK 104 $560,000 $3.8 M $3.8 M
HOU 79* $780,400 $3.8 M $2.5 M $3.8 M
MIL 133 $422,300 $2.8 M $2.8 M
BOS 138* $402,000 $2.5 M $2.5 M

For no team is the extra cost greater than the amount guaranteed to Matt Harvey this offseason and for half the teams, the cost is around what Daniel Descalso or Jordy Mercer received. These are not large sums. This list isn’t meant to provide a justification for a team signing or not signing any particular free agent, but it does show that there are pretty significant differences in the penalties teams face. The amounts of money we are talking about shouldn’t be the deciding factor in determining whether or not to sign a free agent, and “We are unwilling to forfeit a draft selection to sign Player X” is actually a prohibited phrase under the CBA, whether on or off the record. Teams can and do factor in the value of a draft pick when making an offer. The argument that teams horde draft picks as things to be held at all costs rings false when Cleveland, Cincinnati, Milwaukee, Oakland, and St. Louis have all traded early-round draft picks in the current draft alone.

A handful of teams would incur additional penalties if they signed another free agent in the form of competitive balance taxes. An extra $18 million in salary would result in only a few million in penalties for teams like the Yankees and Cubs, though the Red Sox would pay an additional $15 million if they added the same amount to their roster. As for why the new qualifying offer system didn’t provide the improvements players expected, we can look at how the old rules applied compared to the current system. Under the old system, teams gave up their first pick so long as it wasn’t in the top 10. For teams picking in the middle of the first round, this constituted a pretty sizable amount of potential value lost, particularly under a system with a hard draft cap and the inability to pay more for greater talent later.

Using this year’s draft as an example, here is the value teams would give up under the old system versus the new system. Some of the penalties above might not match those below, as trades, qualifying offers, and free agent signings weren’t assumed below so we could get a better theoretical understanding of the differences.

Draft Pick Penalty Values In CBA Compared to Old CBA
Old CBA New CBA Difference
BAL $7.2 M $3.8 M -$3.4 M
KCR $6.9 M $3.8 M -$3.1 M
CHW $6.7 M $9.2 M $2.5 M
MIA $8.8 M $6.6 M -$2.2 M
DET $6.4 M $3.8 M -$2.6 M
SDP $6.3 M $3.8 M -$2.5 M
CIN $8.1 M $6.1 M -$2.0 M
TEX $7.4 M $9.9 M $2.5 M
ATL $14.1 M $4.7 M -$9.4 M
SFG $5.8 M $8.3 M $2.5 M
TOR $22.2 M $8.2 M -$14.0 M
NYM $21.1 M $8.0 M -$13.1 M
MIN $20.2 M $7.8 M -$12.4 M
PHI $19.2 M $7.8 M -$11.8 M
LAA $18.4 M $7.8 M -$10.6 M
ARI $17.6 M $9.3 M -$8.3 M
WSH $16.8 M $12.5 M -$4.3 M
PIT $16.1 M $5.0 M -$11.1 M
STL $15.4 M $7.4 M -$8.0 M
SEA $14.8 M $3.8 M -$11.0 M
TBR $13.6 M $7.6 M -$6.0 M
COL $13.0 M $3.8 M -$9.2 M
CLE $12.5 M $3.8 M -$8.7 M
LAD $12.0 M $6.8 M -$5.2 M
CHC $11.1 M $6.8 M -$4.3 M
MIL $10.7 M $4.3 M -$6.4 M
OAK $10.3 M $4.2 M -$6.1 M
NYY $10.1 M $10.6 M $0.5 M
HOU $9.5 M $6.5 M -$3.0 M
BOS $7.0 M $8.9 M $1.9 M
AVERAGE $12.3 M $6.7 M -$5.6 M

The penalty was lessened, but for teams picking in the top 10, it was virtually unchanged, and for teams paying the competitive balance tax, it was the same or worse. The gap would be even smaller if the Cubs, Yankees, and Dodgers were over the competitive balance tax as they have been fairly recently. While the most substantial improvements in terms of lessening the penalty come right in the middle of the draft, those teams generally still have the biggest penalties, with teams at the end of the draft not seeing much of a change. If draft picks played a big role in free agency prior to the current CBA, there isn’t that much reason to think the new CBA constitutes a big step forward, as the number of teams significantly affected isn’t that great and most of those teams were still left with penalties approaching eight figures.

Whether or not it is a sound decision to sign Dallas Keuchel or Craig Kimbrel at their current asking prices, it is important to understand the exact cost of signing either at this point in the baseball calendar. There is certainly a credible argument to be made that for the teams that might need those players now, the cost of their missed production over two months of the season outweighs the penalties above, and perhaps by a significant margin. There is always a need for starting pitchers and relievers, and most teams had a pretty good idea if they would be contending this season. If these players were available for the same price now as they were at the beginning of the season, which we don’t know, then not signing them then was a poor choice for most teams. Now the missed production is a sunk cost, and the penalties for the draft pick, when signing a player only gets you another week of their services, weigh more heavily. Even still, the costs aren’t great and shouldn’t be too difficult for any team to justify whether it is for this season or into the future.