Daily Graphing – Chris Ray
With B.J. Ryan and Jorge Julio’s departure from the Orioles, it looks like Chris Ray will get a shot at closing games. Ryan saved 36 games last year, blowing only 5 saves with an 2.43 ERA. Those are some pretty big shoes for Ray to fill in his sophomore season. After being called up from AA in mid-June, he had an excellent rookie season, throwing just over 40 innings with a 2.66 ERA. Let’s see if he has the stuff to handle full time closer duties.
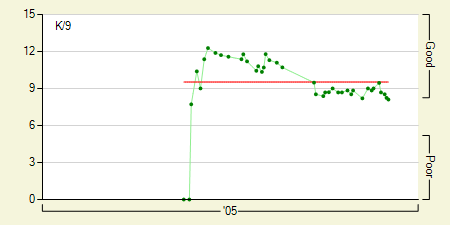
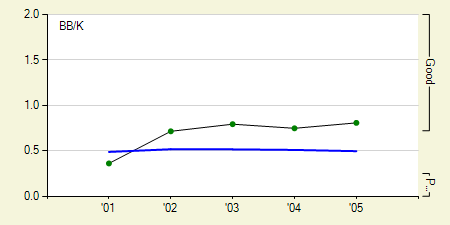
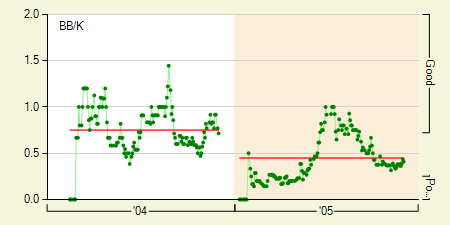
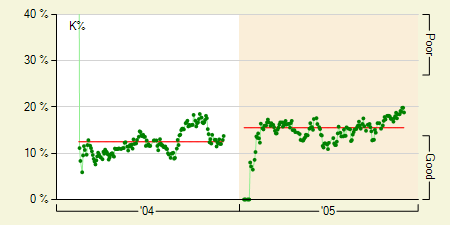
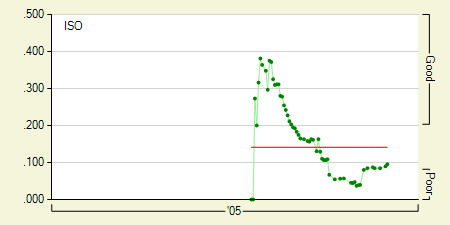
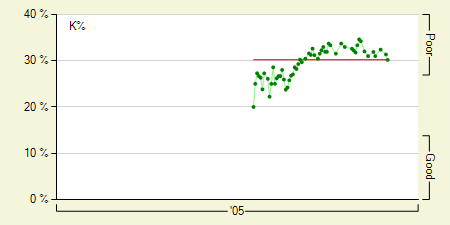
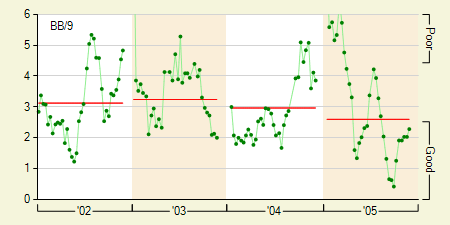
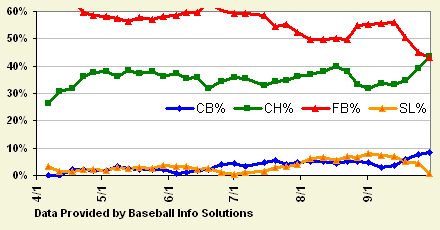
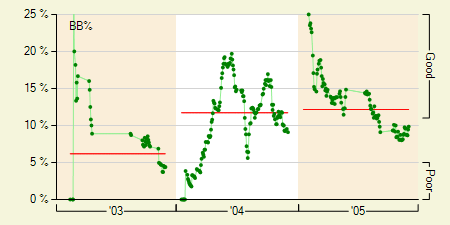
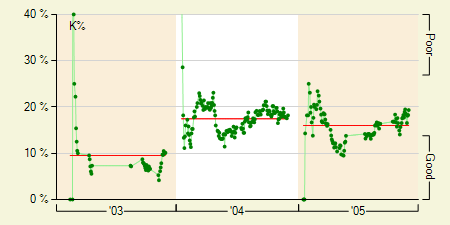
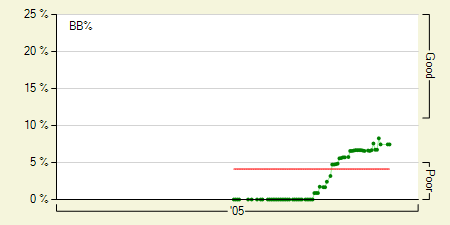
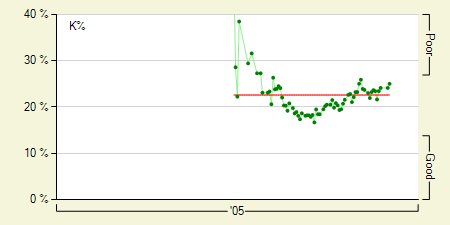
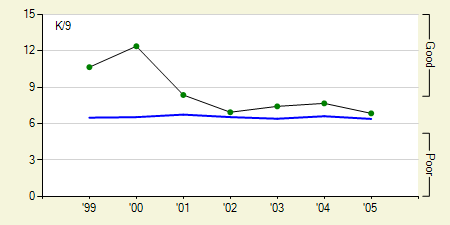
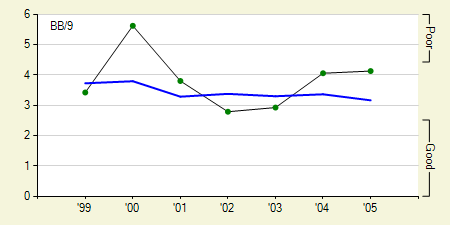
He has an excellent strikeouts per 9 innings (K/9) of 9.52 which is certainly closer worthy. He relies heavily on his mid-90’s fastball which tops out at 99 mph. Occasionally he’ll mix in his slider and he also has an 85 mph changeup which he doesn’t throw all that often. He started off the year with some excellent control, but as the season wore on, his walks per 9 innings (BB/9) crept up to unacceptable levels.
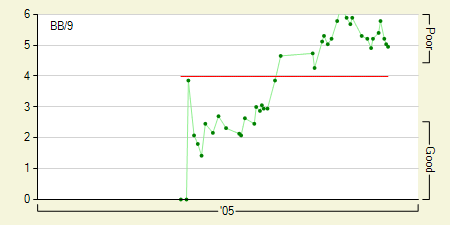
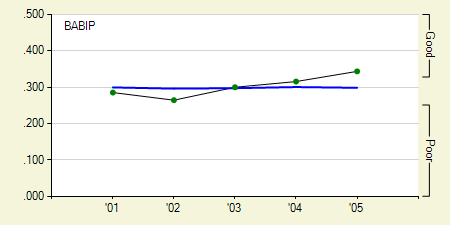
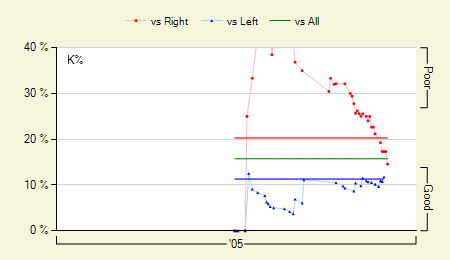
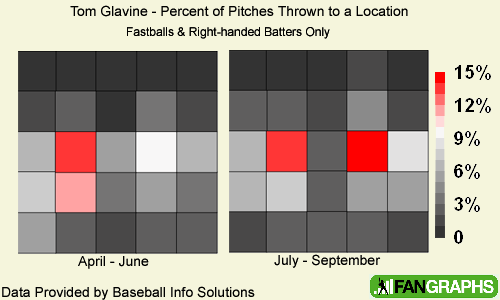
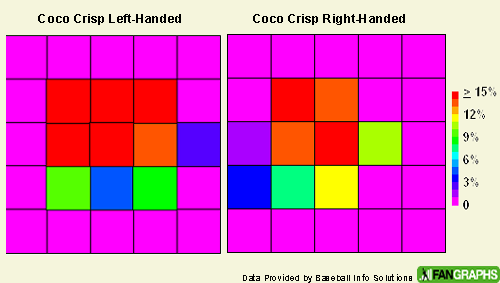
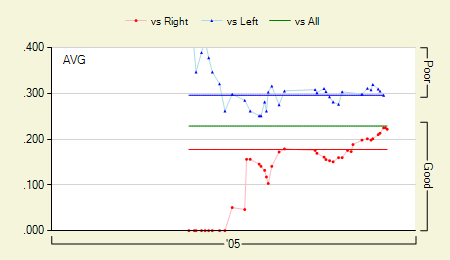
In his brief minor league career, his highest BB/9 was 3.06 which is quite good and with his K/9 as high as it is, he can afford to have a slightly higher walk rate. He did experience a bit of trouble with left-handed batters as they batted .298 against him opposed to .177 of right-handed batters.
In all honestly, it probably wouldn’t hurt if he waited another season before taking over as a full time closer, but it looks like he’s the Orioles best option at this point. He certainly appears to have the right stuff to close out games and if he can recapture his minor league walk rate he should be primed for a good season. I’m sure there will be a few bumps in the road, but with a little leeway, he should be able to hang onto the job all year long. I can certainly think of a few higher profile closers who will probably be out of a job before Chris Ray.