The first game of the 2025 postseason played out exactly as scripted, plus or minus a few crazy bounces. In the Wild Card series between the Tigers and the Guardians, the aces looked like aces and the offenses looked, well, inoffensive.
Tarik Skubal, who will be picking up his second straight Cy Young in a month or so, carved up the Guardians to the tune of one (barely) earned run over 7 2/3 innings. Gavin Williams, who put up a 3.06 ERA and allowed just six runs over his final five regular season starts, returned the favor, allowing two unearned runs over six innings and change. The two starters combined for 22 strikeouts, with 14 of them coming from Skubal, who earned the win and gave Detroit a 1-0 series lead. Read the rest of this entry »
Well, you asked for more of the American League Central. Or at least, I assume you asked for more of the American League Central. Major League Baseball definitely thinks you want more of the American League Central; why else would the league schedule all three Wild Card games between the Tigers and the Guardians for 1:08 PM Eastern? That’s prime time (assuming you’re a middle schooler who’s home with strep throat). The only division without a 90-game winner is sending two teams to the playoffs, and the Guardians and Tigers will spend three days in Cleveland fighting over the honor of facing the Mariners in the ALDS. That may not be enough to dethrone the Red Sox and the Yankees in terms of scheduling, but it’s a repeat of last year’s thrilling ALDS matchup, which went the full five games and ended with the unlikeliest outcome of all: Tarik Skubal losing a game.
The two teams couldn’t be coming into the Wild Card round on more different trajectories. The Tigers ended their series quietly with a loss to the Red Sox on Sunday. That loss handed the division title to the Guardians, who went on to beat the Rangers with a walk-off homer in the 10th inning just for funsies:
At the All-Star break, the Tigers had the best record in baseball, while the Guardians ranked 22nd. Since the All-Star break, the Guardians have the best record in baseball; the Tigers rank 21st. I can keep going. Read the rest of this entry »
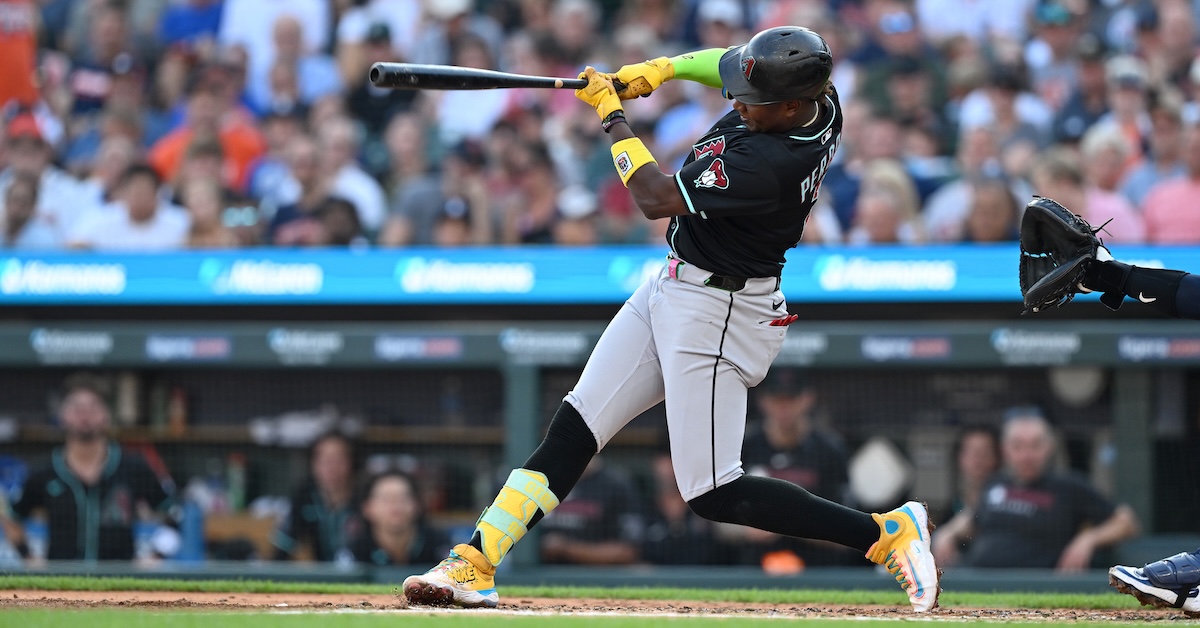
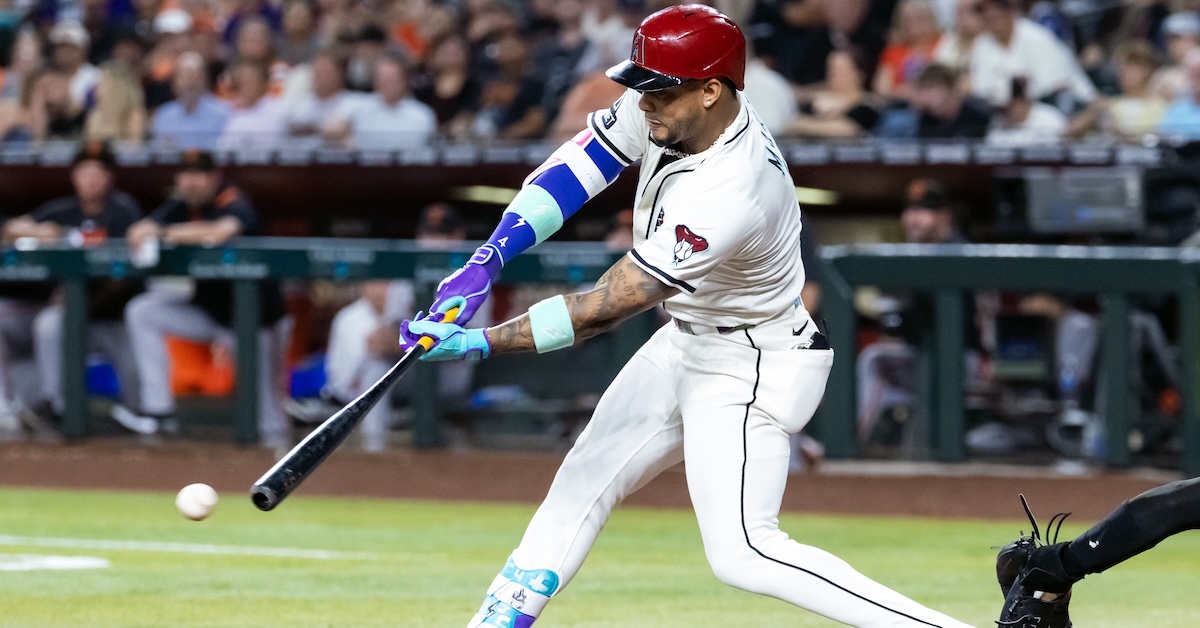
It sure seems like the Diamondbacks knew something the rest of us didn’t. Back in February, when Arizona signed shortstop Geraldo Perdomo to a four-year contract extension to keep him around through the 2029 season, I wrote, “I think the Diamondbacks are paying for floor rather than ceiling. However he gets there, if Perdomo keeps performing like a two-win player, the contract will work out well for both sides.” Perdomo was coming off a knee injury and two straight seasons of absolutely average offensive performance. It may have looked like the Diamondbacks were comfortable with that level of production, but the 2025 season has put things in an entirely new light.
Perdomo has been unequivocally one of the best players in baseball. He leads all National League position players in bWAR, and if not for Shohei Ohtani, he would have a very good argument for the MVP. Geraldo Perdomo, whom I first wrote about because he was a great test case for players with extremely low exit velocities. Geraldo Perdomo, whose offensive approach I summed up earlier this year as, “Try with all your might to avoid swinging.” Geraldo Perdomo, whose 12th-percentile hard-hit rate represents a career-high! That guy has 6.7 WAR. That guy has 19 home runs after coming into this season with a combined 14 for his major league career, which began in 2021. That guy is running a 138 wRC+ and none of the advanced numbers is saying it’s because of batted ball luck. Perdomo really has been a great hitter. We’ve been all over the story. Michael Baumann has written about him twice, I’ve broken down his breakout and documented one of his trademark swingless plate appearances. Now that October is near, we need to acknowledge how big a deal it is that Perdomo has kept this going all season long.
Perdomo has gotten bigger and stronger. He’s changed his mechanics from both sides of the plate. He’s somehow chasing and whiffing even less than he did last season, and he’s somehow doing so while lifting the ball more, swinging a bit harder, and hitting the ball a bit harder. We’ve broken down all those points in the articles I linked to above, so I’m not going cover that ground again. I’m here to show you one graph that cracks me up.
This is from the last paragraph of my article back in February: “I am so, so curious to see what it would look like if Perdomo were to start attacking the ball. He’s still young, and I really do think it’s possible that he has the capacity to be more than an average hitter.” I’m not trying to say I called this. I definitely did not. One sentence later, I wrote “Still, I don’t think we should expect that going forward.” But Perdomo really did start attacking the ball in his own way, so I can now show you what it looks like.
In terms of average exit velocity, it doesn’t look like all that much. He’s running a career-high 87.6 mph, up half a tick from last season. That’s still only enough to put him in the 19th percentile. However, you know better than to just look at average EV and call it a day. His 90th-percentile exit velocity jumped from 100.4 mph to 101.5. That’s a bigger jump, but in terms of percentiles, it only moves him from the 14th to the 18th. So, uh, that doesn’t look like that much either.
It’s impressive that Perdomo can swing harder, lift the ball more with a steeper swing, and maintain his absurdly high contact and squared-up rates. Regardless of where you’re starting out, that’s not normally how things work. But it’s also not enough to earn him respect. For all the reasons in the previous paragraph, pitchers still aren’t afraid of Perdomo, like at all. He ranks fifth among qualified players in zone rate. He’s seen 873 pitches over the heart of the plate. That’s the most in the game, and nobody else is even close. But Perdomo has the best hard-hit rate of his career by a wide margin, and that does matter. He’s never going to break the power scale, but let me show you Tom Tango’s graph for the thousandth time.
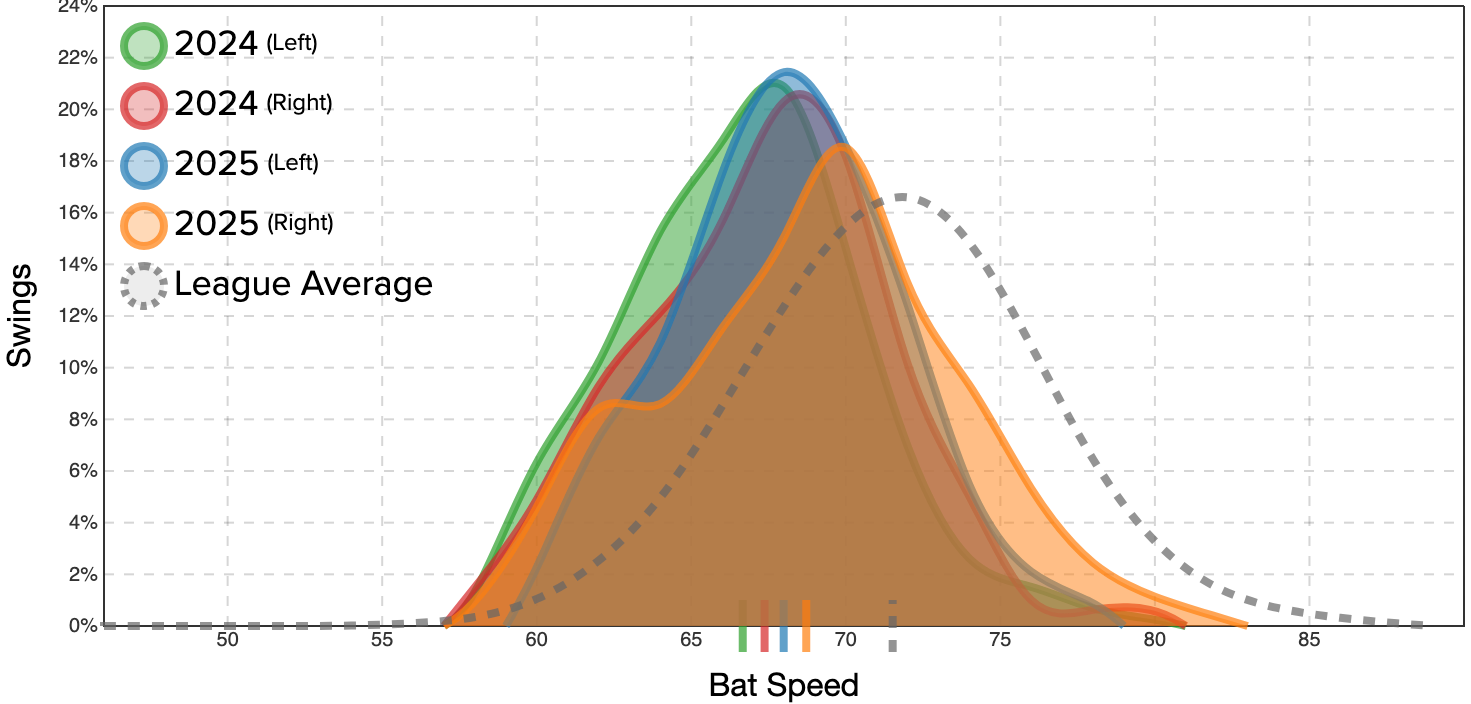
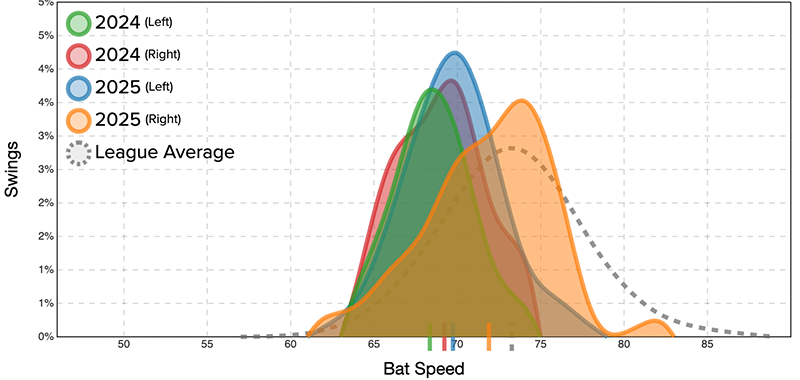
Going from a 25.8% hard-hit rate to a 31.5% hard-hit rate means crossing that threshold way more often. Even if you’re just barely crossing it, it’s still a big deal. There are way more hits on the right side of the line. The odds have changed on all those pitchers who are content to let Perdomo put the ball in play. Perdomo is still not a big, powerful guy, but he’s got a new A-swing. Here’s Baseball Savant’s distribution graph of his bat speed. This is for all swings.
Perdomo’s right-handed numbers from the 2025 season are in orange in the front. It’s still not as fast as the dotted line that represents the league average, and even though its peak is more than 1 mph higher than the peaks of the previous seasons, its shape doesn’t look all that different. It’s just that the tails on either side are fatter. That’s really noticeable on the left of the graph. Perdomo isn’t taking fewer super-weak, 57-63 mph swings than he did in previous seasons. What he’s cut down on are the medium-speed swings, and he’s getting off more fast swings than ever before. In other words, when he knows he has a chance to hit the ball hard, he’s making sure he does it. I know that looks pretty subtle here, and the difference between the green and blue areas that represent his 2024 and 2025 stats batting left-handed is even smaller. But now we’re getting to the graph I really want to show you, the one that has me cackling. Here’s the same exact thing, except it only shows the swings that result in hard-hit balls.
Well that’s different! Look how far the 2025 distributions are from the 2024 ones. The blue left-handed peak is roughly 2 mph faster than it was in 2024, and the orange right-handed peak is 5 mph faster! All of a sudden, Perdomo is getting his getting his money’s worth. He’s still happy to take a slow swing and put the ball in play – that’s why the tail on the left side of even this graph extends farther than in any of the previous seasons. But not only is he kicking into high gear more often, it’s a higher gear than he ever had before. Perdomo still doesn’t have the top-end bat speed to keep up with the league average on the right side of the chart, but he’s way above that dotted distribution line until we get to 77 mph or so. He’s more than doubled his fast-swing rate from 2024. That’s what it looks like when Perdomo starts attacking the ball, and it’s even more fun than we could’ve hoped.
As you surely know, Michael Baumann has been writing about MeatWaste for two weeks now. Specifically, he’s been writing about who is great at hitting pitches in the Meatball and Waste portions of the strike zone, according to Statcast’s Attack Zones diagram. Those are hitter’s pitches. The meatball zone right down the middle (zone five in the diagram below) is where batters crush the baseball, and the waste zone far away from the strike zone is where they have no trouble laying off pitches that are certain to be called balls. Baumann wrote about how the Brewers are great as a team at capitalizing on those pitches last week, and then today he ran down the individual MeatWaste leaderboard, a phrase I didn’t know I needed in my life until Tuesday.
This is useful information with a delightfully repulsive name, and it made me wonder about the opposite leaderboard. MeatWaste tells you who’s crushing hitter’s pitches, but let’s find out who’s excelling against pitcher’s pitches. Technically, that isn’t the opposite of MeatWaste. MeatWaste makes up just nine of Statcast’s 33 attack zones. The true opposite would include the other 24 that make up the Chase, Shadow, and Heart zones (except for zone five, the spot right over the very middle). It would also look very, very similar to the list of the best hitters in the game.
This list isn’t telling us anything we don’t already know because we’re looking at too much of the zone. If we want the opposite of MeatWaste, we need to look at the edges of the strike zone, where swing decisions are difficult and loud contact is hard to come by. Statcast calls this the shadow zone, and it includes any pitch within one baseball’s width (or 2.9 inches) of the edge of the strike zone.
What do we call the opposite of MeatWaste? Is it meat that’s the opposite of waste, like filet mignon? If we acknowledge vegetables as the opposite of meat (though you could make a strong argument for pudding), does that mean it’s veggie waste, like edamame shells? Or does that mean it’s the opposite of both meat and waste, like an artichoke heart? In the end, I decided to keep it simple and just follow Statcast’s taxonomic principles. These aren’t Meatballs, they’re Shadowballs, and if you know anyone who goes by that nickname, I urge you to explain in the comments how they came by it. Read the rest of this entry »
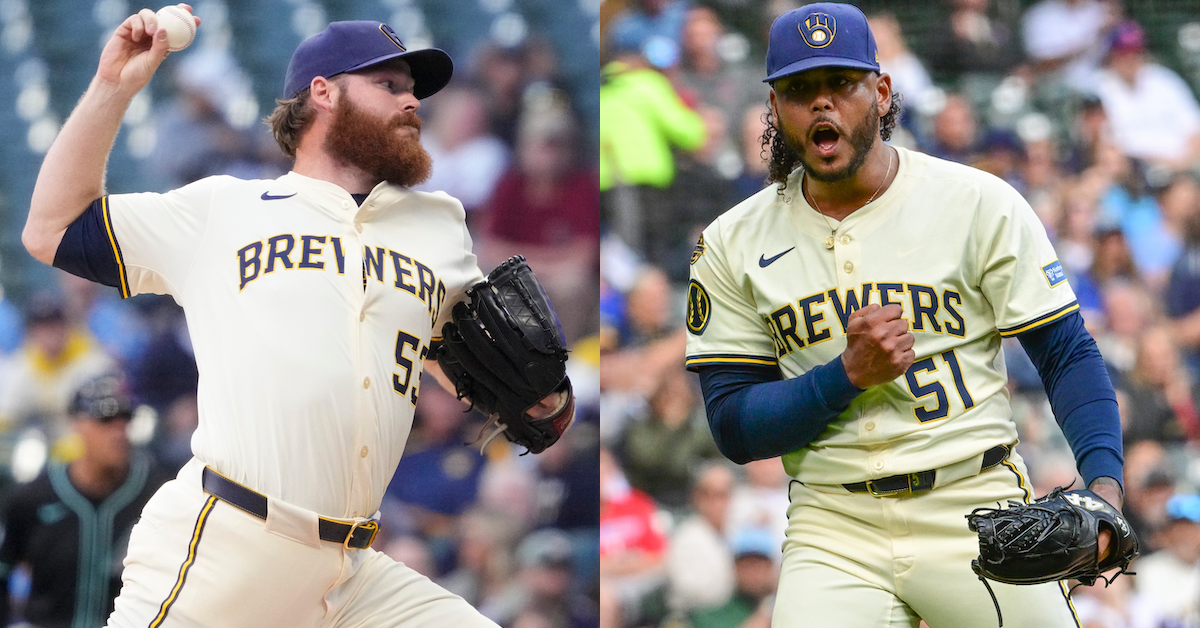
Freddy Peralta is having arguably the greatest season of his excellent eight-year career. The right-hander has ridden a career-best 2.69 ERA to a career-high 16 wins. However, I used the word arguably for a reason. Peralta’s 3.64 FIP is just the fourth best of his career, and his 3.93 xFIP is tied with 2024 for his fifth best. There’s a gap of 0.95 runs per nine innings between his FIP and his ERA. When you multiply that times his actual innings total of 163 2/3, FIP thinks he should’ve given up just over 17 more earned runs than he actually has allowed. None of this is surprising. Pitchers underperform or overperform their peripherals all the time. The interesting thing is that Statcast says that no pitcher has benefitted as much from the defense behind him as Peralta. When he’s has been on the mound, the Brewers defense has been worth just under 14 fielding runs. It’s neither this simple or this clean-cut, but it’s easy to combine these two numbers and make an inference: Defense can explain more than 80% of the difference between Peralta’s FIP and ERA.
On the other end of the spectrum is Peralta’s teammate Brandon Woodruff, who returned from shoulder surgery in July and has gone 6-2 over 11 starts and 59 2/3 innings. He’s posted a 3.32 ERA, 3.26 FIP, and 3.40 xFIP. In other words, FIP thinks Woodruff has gotten exactly what he’s deserved. However, Woodruff’s xERA is a scant 2.27. When you combine all those numbers, it means Statcast thinks several batted balls that should have resulted in outs instead fell in for non-homer base hits. The difference is a bit over six runs. Coincidentally or not, Statcast says the Milwaukee defense has been at its worst behind Woodruff, costing him just under five runs, once again just about 80% of the gap between an ERA estimator and his actual ERA.
That’s why we’re talking about Peralta and Woodruff. No two teammates have a bigger gap between the fielding run value of the defense behind them. It’s nearly an 18-run gap! It’s jarring. With 26 FRV, Statcast thinks the Brewers have the fourth-best team defense in the game, but somehow none of that brilliance has been shining on Woodruff. We’re going to use Statcast data to break down, as best we can, the reasons behind it. Hopefully, the comparison will show the various ways a team can provide defensive value. Let’s start with the catching numbers. Read the rest of this entry »
Keegan Matheson has a beard. Let’s start there. Matheson is MLB.com’s Blue Jays beat writer and he has a beard. It’s a big, glorious, pointy beard, and it’s attached to his face and everything.
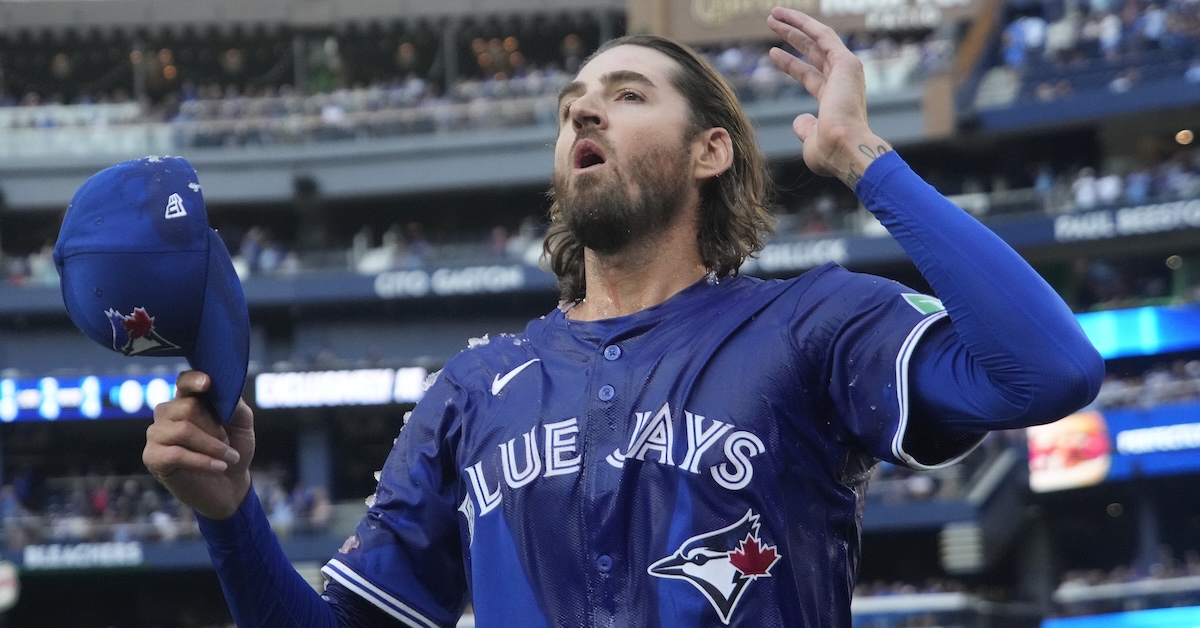
Blue Jays starter Kevin Gausman has a beard too. It’s not glorious like Matheson’s. The right-hander usually opts for a few days’ growth, but in recent weeks, he’s been going a step further. It’s still patchy in the cheeks. Closeups show you individual hairs splayed in whichever direction their whimsy takes them. All the same, more often than not, Gausman has been moving beyond stubble status and into the beginnings of beard territory. Gausman has also been pitching quite well lately, running a 2.25 ERA and 3.00 FIP over his past 10 starts.
Last Thursday, Matheson watched Gausman mow down the Astros, pitching a shutout with nine strikeouts, two walks, and one hit, and made the connection. “The nerds won’t tell you this because their charts won’t show it,” he posted on Bluesky, “but Kevin Gausman’s recent hot streak has a direct correlation to him embracing a beard. Something to monitor.” Read the rest of this entry »
Vincent Carchietta, Joe Nicholson, Kirby Lee-Imagn Images
Aaron Judge stands alone. Well, Aaron Judge usually stands alone. This year, he’s got company. Judge leads all players with 8.3 WAR. Shohei Ohtani is right behind him with 7.8 total WAR (6.5 as a hitter and 1.4 as a pitcher), and Cal Raleigh is right behind him with 7.6. With a difference of less than three-quarters of a win, that’s an extremely tight race to be baseball’s WAR leader. It got me wondering how often these races are that tight, so I hit the spreadsheets. I pulled the top three WAR-getters in each season since 1901 and checked to see whether this year’s race is an outlier, and if so, just how out there it is compared to seasons past. The short answer is yes, this race is really tight by pretty much any historical standard.
Before we get into it, I’ve got to make a couple notes on the data and methodology here. First, I used FanGraphs WAR, both because I work here and because I’m a FanGraphs fan. (I’m also a fan of FanGraphs’ graphs, which makes me FanGraphs graphs fan. I could keep going.) Ohtani leads baseball in WARP, Baseball Prospectus’ version of WAR. As Ginny Searle wrote on Wednesday over at BP, Judge leads Raleigh by much more in both Baseball Reference WAR (which doesn’t incorporate pitch framing) and WARP (because DRC+ thinks Raleigh’s deserved offensive performance is slightly below his actual performance). Still, we’re going with fWAR, or as we refer to it here at FanGraphs, WAR.
Second, no matter which version you use, you’re really not supposed to dice WAR up like this. It’s a great stat that captures a lot, but it has error bars like any stat, and there are probably bits of value players produce that we can’t measure. If you’re selecting an MVP or comparing any two players based on fractions of a win, you’re probably doing it wrong. But I double-checked, and it turns out that nobody’s going to fire me for handling WAR slightly irresponsibly. Today, we’ll have some fun doing it wrong. Read the rest of this entry »
NEW YORK — It’s hard to stay under the radar when you play at Yankee Stadium, but Cody Bellinger is giving it his best shot.
Splitting time between all three outfield positions, the 30-year-old Bellinger is quietly putting up the second-best season of his entire career. With 4.6 WAR entering play Wednesday, he ranks 18th among all position players. Drafted out of high school in 2013, Bellinger debuted with the Dodgers at age 21 in 2017 and immediately looked like a star. He took home Rookie of the Year honors with a four-win campaign, won the MVP in 2019, and then saw his career derailed by a fractured fibula and multiple shoulder dislocations. The Dodgers non-tendered him after he ran a combined 69 wRC+ in 2021 and 2022, and he signed a pillow contract with the Cubs for 2023. He got back on track with a 136 wRC+ and 4.4 WAR, signed a three-year deal to stay in Chicago, and then got traded to New York after he took a step back in 2024. That step back is starting to look like a blip.
This season, Bellinger been the most valuable Yankee not named Aaron Judge. His 129 wRC+ ranks fifth among the team’s regulars, and he’s tied with Austin Wells for the lead with nine fielding runs. Bellinger’s 28 home runs are his most since his 2019 MVP season.
He is having an interesting year at the plate. In some ways, he looks the same as he has for the past three seasons. Deserved Runs Created Plus, a Baseball Prospectus metric that measures deserved performance rather than actual results, had him at 106 in 2023 and 111 in his down 2024 campaign. This season, he’s at 108. In other words, DRC+ thinks Bellinger has performed at pretty much the same level for the past three seasons, despite the dip in his actual performance and his xwOBA last season. That’s the first big piece of news here. DRC+ thought Bellinger’s step back last year was undeserved, and the fact that he’s returned to his 2023 performance level makes that easier to believe. As Dan Szymborski wrote earlier this week, Bellinger has put himself in position to decline his 2026 option and look for a new deal. The idea that, under the hood, he’s been this good for three years in a row makes him that much more attractive a target if he ends up hitting the open market come November. Read the rest of this entry »
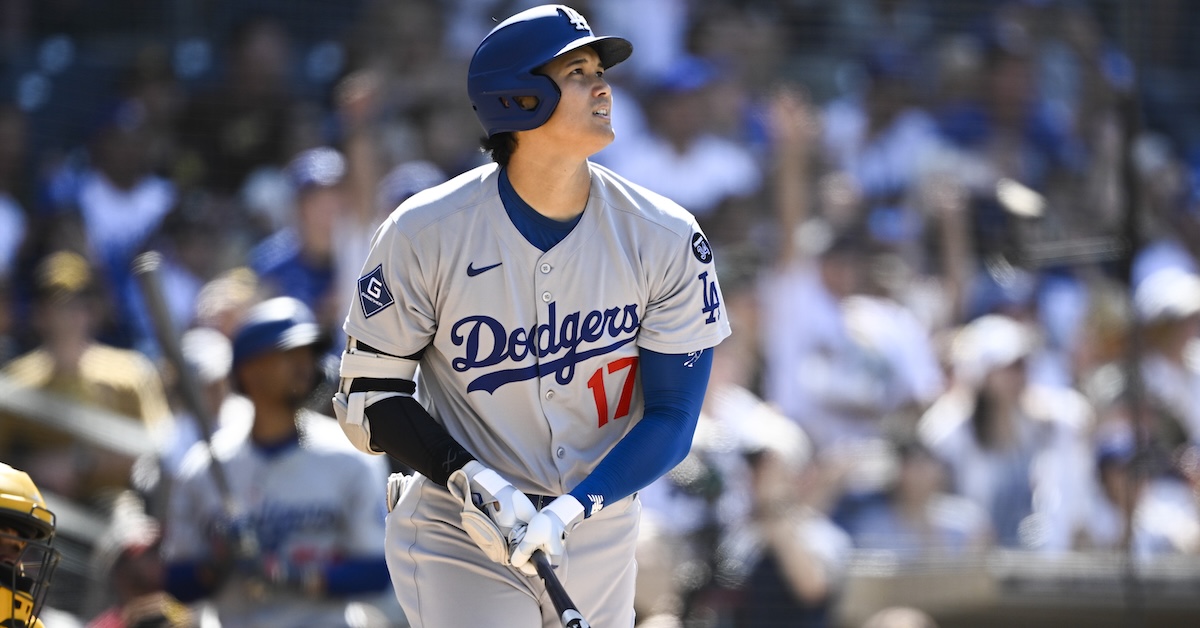
To no one’s surprise, Shohei Ohtani is having a big season. His 170 wRC+ is second only to Aaron Judge with 192. He’s on pace to tie his career high of 54 home runs. He leads all of baseball with 127 runs scored. Oh, and he’s started doing that pitching thing again. Don’t let his 3.75 ERA fool you. He’s only made 12 appearances and thrown 36 innings, but his 2.47 expected ERA, 2.17 FIP, and 2.53 expected FIP are all career-bests. His average fastball velocity is up. He’s striking out as many batters as ever while slashing his walk rate and avoiding hard contact. There’s no shortage of reasons to write about Ohtani, but our subject today is his spot in the lineup.
Last Tuesday, Ohtani hit his 46th home run. It left his bat at 120 mph, making it the hardest-hit ball of his entire career. I wrote a whole article about it. It was also his 100th home run as a Dodger (in just his second year as a Dodger!). Lost amid all that hoopla was a different milestone. I neglected to mention at the time that it was Ohtani’s 42nd home run of the season from the leadoff spot, which set a new record. It’s the most ever. He also homered twice on Sunday, to push the record to 44. Should we watch all three of those recent home runs? I think it’s best that we do.
The old record was not particularly old. It belonged to Ronald Acuña Jr., who conducted his scorched earth 2023 campaign against the pitchers of the world while batting first for the Braves. In fact, eight of the top 10 seasons have come in the past nine years, five of them in the past four years. That shouldn’t necessarily come as a shock. Home run power has increased over the course of baseball history, and lineup optimization has become the norm over the last several years. Teams are stacking their best hitters in the first and second spots, and the best hitters tend to hit homers. Here’s the top 10 according to our friends at Stathead: Read the rest of this entry »
Are you a fan of a team in playoff position? Are you tearing your hair out because their bullpen has been completely unable to get anybody out over the past couple weeks? Is this starting to get creepy? Does it feel as if I’m staring straight into your very soul? Worry not. I’m just playing the odds. Below is a table that shows bullpen performance over the last 14 days, but only for the 13 teams with at least a 12% chance of making the playoffs. I’ve highlighted the teams whose ERA ranks in the bottom half of the league over that stretch:
Bullpens Over the Last 14 Days
Team
ERA Rank
ERA
FIP Rank
FIP
Red Sox
5
3.40
7
3.37
Mariners
12
4.08
1
2.79
Dodgers
13
4.11
10
3.51
Astros
14
4.27
15
3.98
Phillies
15
4.29
14
3.88
Tigers
16
4.34
25
5.29
Rangers
17
4.46
5
3.28
Brewers
18
4.67
6
3.29
Padres
20
4.70
22
4.63
Mets
21
5.03
13
3.64
Yankees
23
5.23
2
2.93
Cubs
25
5.26
17
4.21
Blue Jays
26
5.28
19
4.29
There are the Red Sox in fifth place, looking solid with a 3.40 ERA. But, uh, this not exactly an encouraging sign for all these playoff teams. That’s a lot of yellow. Boston is the only team in the top 10; no one else has a bullpen ERA below 4.00. Only five of these teams are even in the top half of the league. The Mets, Yankees, Cubs, and Blue Jays all have ERAs over 5.00.
The Brewers are tied with the Twins for the league lead with five blown saves in the past two weeks. The Blue Jays and Phillies each have four. Just a reminder: The Brewers have the best record in baseball, and the Blue Jays and Phillies are tied for the second best. All of sudden, none of them can close out a game to save their lives.
Once again, I need to disavow any supernatural influence here. I don’t think there’s a paranormal reason that seemingly every good baseball team’s bullpen is in a rut. It’s mostly a coincidence. If we look at FIP, things are much more reasonable. Six of our 13 teams are in the top 10, and only four are in the bottom half of the league. That’s pretty much what you’d expect. Most of the good teams have strong bullpens. This is a short stretch, a small sample of innings, and a volatile cohort to start with. The Brewers’ bullpen has an excellent 3.29 FIP over the past two weeks, but it’s blown five saves anyway. Stuff happens.
I’ll break down the four teams at the bottom of the table along with a couple others I found noteworthy due to injury reasons, or because I’m worried about them heading into the playoffs, but that’s mostly what I wanted to tell you. All the bullpens seem to be blowing up right now. It’s weird. If you’re tearing your hair out because we’re in September and your bullpen can’t hold on to a lead, relax. First, there may be enough time to right the ship. Second, whoever you’re facing in the playoffs can’t hold a lead right now either, unless it’s the Red Sox (who gave up eight runs in a bullpen game last night, presumably because that’s what all the cool kids are doing).
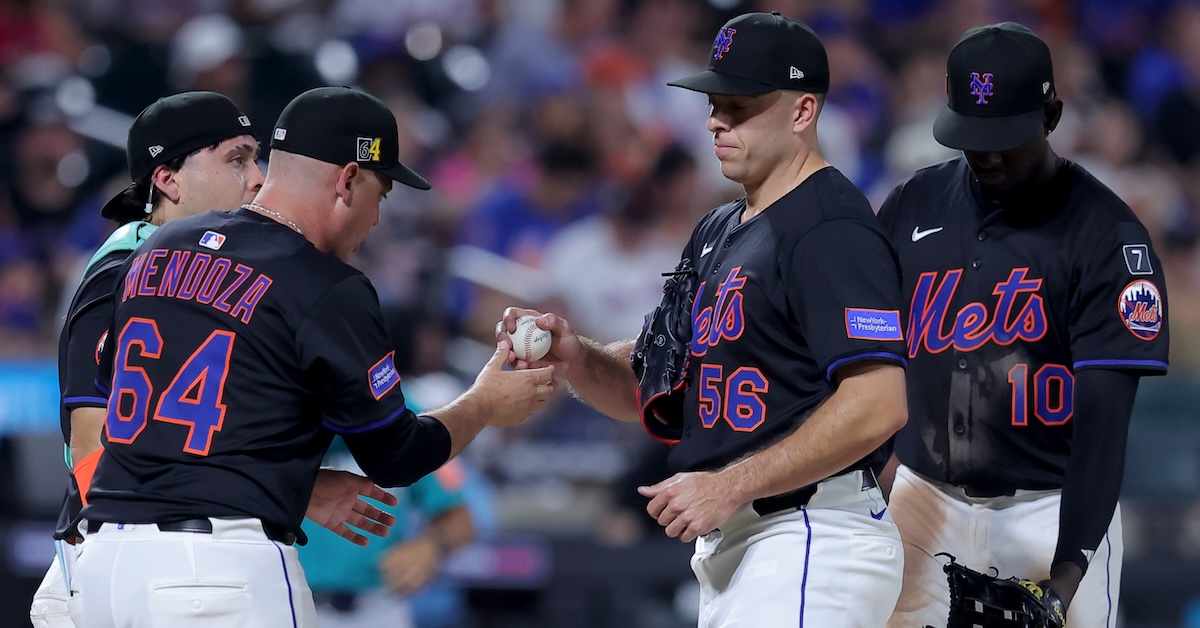
Mets
The Mets lead the league with a whopping six relievers on the IL right now: Reed Garrett, Drew Smith, Danny Young, A.J. Minter, Max Kranick, and Dedniel Núñez. Smith, Minter, Kranick, and Garrett had all been pitching well before their injuries. That’s four good relievers lost, and only Garrett has a chance to return this season. That’s how the Mets ended up claiming Wander Suero, who has thrown just 6 1/3 major league innings in the last two seasons combined, from the Braves off waivers yesterday. Suero has a 1.35 ERA and 2.63 FIP over 46 2/3 innings in Triple-A Gwinnett, and he will get the chance to prove that’s not a fluke. The Mets called him up less than half an hour ago to take the spot of the struggling Kodai Senga, who has been optioned to Syracuse.
More than that, Ryan Helsley has been completely ineffective since the deadline trade that brought him to New York from St. Louis. He had a 3.00 ERA and 3.56 FIP as a Cardinal, and he has a 11.45 ERA and 6.50 FIP as a Met. Helsley said last week that he thinks he’s been tipping pitches. With any luck, he’ll get that sorted out. If he does that and Garrett comes back pitching well, they’ll join Tyler Rogers, lefties Brooks Raley and Gregory Soto, and closer Edwin Díaz, all of whom are putting up good numbers this season. Somehow the Mets could still put together a solid bullpen going into the playoffs.
Dodgers
The Dodgers’ relievers rank third in the majors with 5.2 WAR this season, but that’s mostly because they’ve been asked to throw 570 1/3 innings, the most in baseball. At the moment, RosterResource says they’re tied with the Brewers at five injured relievers, one behind the Mets. They lost Evan Phillips to Tommy John surgery in May, deadline acquisition Brock Stewart went on the IL with shoulder inflammation almost immediately after the trade, and Alex Vesia strained an oblique on August 21. Jack Dreyer, Justin Wrobleski, and Ben Casparius are the only relievers on the team with FIPs below 3.50. Tanner Scott and Kirby Yates are load-bearing pieces who have taken major steps back and lost time to injury besides, and yet the Dodgers are still one of the higher teams on the list. After missing time with forearm tightness earlier in the season, Blake Treinen has allowed just two runs in his last 12 appearances, and his ERA is down to 3.00.
Yankees
The headliner here is the 5.60 ERA that Devin Williams has put up this season, but as Michael Baumann wrote earlier today, the underlying numbers aren’t that bad. They’re maybe even good. The Yankees lost Jake Cousins to Tommy John surgery in June and Jonathan Loáisiga to a flexor strain in August. Brent Headrick is also on the IL after taking a line drive off his pitching arm. The Yankees have also suffered blowups from Paul Blackburn and Yerry De los Santos. They pulled the plug on deadline acquisition Jake Bird almost immediately. He had a 4.73 ERA and and 3.50 FIP in Colorado before the deadline, but he got into just three games for the Yankees, allowing six runs over two innings before being optioned to Triple-A, where he has continued to struggle. Luke Weaver has been bitten by the home run bug lately, allowing four in his last seven appearances for an ERA of 5.14. However, his average exit velocity over that stretch is lower than it’s been the rest of the season, and he’s run a 2.53 xFIP. It seems more like bad luck than anything.
Fernando Cruz and David Bednar have been lights-out, Tim Hill is still a groundball machine, and Camilo Doval hasn’t allowed a run in his last five appearances. Over the entire season, the Yankees bullpen has a 3.93 xFIP, tied for second-best in baseball. Over the past two weeks, they’ve got the second-best FIP despite the hideous ERA. It’s hard to imagine them making a run without Williams and Weaver (The Deadly W’s) turning things around, but this isn’t necessarily a disastrous ‘pen either.
Cubs
By most metrics, the Cubs bullpen has been right in the middle of the pack this year. In the past two weeks, its 3.05 xFIP is the third best in baseball. So why are the ERA and FIP so ugly? That’s the danger of playing in homer-friendly Wrigley Field in August. Over that stretch, 21.1% of their fly balls have gone for home runs, second only to the Rockies (and not coincidentally, they recently spent a three-game series in Colorado). Drew Pomeranz and Taylor Rogers have put up good seasons, but have each given up a couple of homers in recent weeks, and because the Cubs have relied on their bullpen less than just about any other team over that stretch, those mistakes have been magnified. Nothing that’s happened in the past two weeks has made me change my opinion of this relief corps.
Phillies
Philadelphia’s bullpen has been an issue all year long. Free agent signings Joe Ross and Jordan Romano have not worked out at all, putting up a combined -0.5 WAR over 86 appearances and 93 2/3 innings. The good news is that the bullpen looks very different now. The Phillies released Ross, and Romano hit the IL with middle finger inflammation. They signed David Robertson in free agency in July, traded for Jhoan Duran at the deadline, and got star lefty José Alvarado back from an 80-game PED suspension on August 20. Alvardo has looked very rusty since his return and won’t be available for the playoffs, but Robertson and Duran have been excellent. Together with Matt Strahm, Orion Kerkering, and Tanner Banks, the Phillies should have a serviceable, if shallow, bullpen going into October. With Zack Wheeler out and Aaron Nola struggling, the rotation may be the bigger concern.
Blue Jays
How much time do you have? The Blue Jays had the worst bullpen in baseball in 2024, and if nothing else, they looked primed to bounce back. They non-tendered Jordan Romano. They signed the excellent Jeff Hoffman, traded for Nick Sandlin, brought back Yimi García and Ryan Yarbrough, and took flyers on arms like Amir Garrett, Jacob Barnes, and Richard Lovelady. And they have bounced back. They rank in the middle of the pack in both ERA and FIP, and seventh in xFIP. Lately, though, they just can’t seem to get outs.
They released Yarbrough before the season. The fliers they took haven’t worked out, nor have in-house guys like Chad Green, Zach Pop, and Erik Swanson. They’ve lost major pieces, with both Sandlin and García out for the season. Other injuries forced Easton Lucas and Eric Lauer into starting roles, where they’ve performed significantly worse. Hoffman put up three ugly performances in the last week of August, though he’s looked much better in the past week. Although the underlying numbers aren’t bad, deadline acquisition Louis Varland has a 6.91 ERA in 15 appearances as a Blue Jay.
If Hoffman can keep things straightened out, if Varland’s luck can turn around, if Lucas and Lauer can get back in the bullpen, if the arms that got them here – Yariel Rodríguez, Brendon Little, Braydon Fisher – can keep doing what they’re doing, the Blue Jays could have a decent bullpen going into the playoffs. But that’s a lot of ifs.