On Tuesday night, the Astros came away with a big win against the Dodgers, but they suffered an even bigger loss, as an ankle injury in batting practice resulted in Carlos Correa being pulled before the game. The exact extent of the injury was not initially known, with the shortstop/third baseman scheduled to visit a specialist today, but Brian McTaggart of MLB.com reported late this morning that Correa will have surgery and miss the rest of the 2026 season:
Astros source: Carlos Correa will have surgery on his left ankle and will be out for the season. A devastating injury blow for the Astros.
This didn’t seem like the sort of mild sprain that’s healed by a bag of ice and a weekend spent watching old episodes of Top Chef with your foot elevated. Indeed, the initial returns Tuesday night were already pretty concerning, with McTaggart reporting that “the expectation was that Correa would be sidelined indefinitely.” Correa’s injury is to his left ankle, not his right, which appears to have been the source of worry when both the Mets and Giants put the kibosh on signing him in 2022 following team physicals. Read the rest of this entry »
I don’t think many would quibble with me too harshly if I characterized the last two seasons for the Atlanta Braves as dreary disappointments. In 2024, the Braves were generally believed to challenge the Dodgers for the title of best team in baseball. This held true for about six weeks, but for the rest of the season, they suffered myriad injuries and played .500 ball, barely hanging onto a wild card spot before quickly being dispatched by the Padres. Going into 2025 with the hope for a healthier, bounce-back season, nothing of the sort happened. Atlanta finished at 76-86, the franchise’s first losing season since 2017. Expectations coming into this season were more muted. While the Braves were expected to be competitive (the FanGraphs projections were more optimistic than ZiPS), the excitement was certainly dampened compared to the previous two years.
So far in 2026, the Braves have defied the pundits and computers, dominating the NL East and sporting the best record in baseball, at 25-11. Their 8 1/2-game lead in the NL East isn’t an insurmountable one, but it’s quite impressive for this point in the season. No other division leader has more than a two-game lead right now! As crucially, the two teams expected to be Atlanta’s fiercest competition, the Phillies and Mets, are a bit farther behind, at 9 1/2 and 11 1/2 games back, respectively. Naturally, the success of the Braves and the struggles of Philadelphia and New York have changed how the final standings project to shake out.
ZiPS Median Projected Standings – NL East
Team
W
L
GB
Pct
Div%
WC%
Playoff%
WS Win%
80th
20th
Atlanta Braves
93
69
—
.574
68.4%
17.2%
85.6%
9.7%
100.8
85.7
Philadelphia Phillies
85
77
8
.525
20.8%
31.9%
52.7%
4.8%
92.3
78.0
New York Mets
79
83
14
.488
5.8%
17.5%
23.3%
1.3%
85.6
71.9
Miami Marlins
76
86
17
.469
4.8%
14.9%
19.6%
0.6%
84.6
70.0
Washington Nationals
67
95
26
.414
0.2%
0.9%
1.1%
0.0%
73.5
59.5
That’s quite a sea change from the start of the season. Of course, Atlanta isn’t projected to keep playing this well the rest of the way. We’re only a little over a month into the season, and we should expect some regression from the Braves as they play more games.
But just because things will normalize some does not mean that nothing has changed. I’m not convinced that Dominic Smith is a 157 wRC+ guy, or that Martín Pérez is the first person in history to figure out the secret to maintaining a sub-.200 BABIP, but there are other things about this team that I’m quite ready to believe. Matt Olson has had very big seasons before, and when healthy, Chris Sale is one of the best pitchers in baseball. Ozzie Albies isn’t going to hit .330 for the season, but he did amass the second-most WAR as a second baseman from 2018 to 2023, behind only Jose Altuve, so we have seen enough from him in the past to believe this is a true comeback campaign rather than an early-season mirage.
To get a better idea of what’s real and what’s fake, here are the ZiPS projections for the hitters currently on Atlanta’s Depth Charts roster, compared to their preseason projections.
ZiPS Projections – Braves Hitters Now vs. Preseason
Even being skeptical of a few players, there are a lot more advancers than decliners here. Of all major league hitters currently projected to get plate appearances over the rest of the season, the Braves have nine of the top 100, more than you would expect from random chance. Only three players — Austin Riley, Ronald Acuña Jr., and Mike Yastrzemski — have taken big hits, but they are still projected to be real contributors, though I’m a bit worried about Riley personally.
How does that compare to other teams? Using the rest-of-season Depth Charts playing time projections and applying both the up-to-date projections and the preseason ones to that projected playing time, we can get an idea of which teams have had something change and which teams have not.
ZiPS Projections – Team Hitters Now vs. Preseason
Name
Rest-of-Season wRC+
Preseason wRC+
Diff
Braves
112.2
108.9
3.3
Astros
107.5
105.3
2.1
Cardinals
100.9
99.3
1.6
Yankees
115.8
114.4
1.4
Cubs
111.4
110.1
1.3
Guardians
102.3
101.1
1.2
Tigers
106.0
105.0
1.0
Pirates
103.8
103.2
0.6
Marlins
100.1
99.5
0.6
White Sox
98.2
97.7
0.4
Nationals
94.9
94.6
0.3
Rays
99.3
99.2
0.1
Diamondbacks
102.6
102.5
0.1
Dodgers
120.3
120.3
0.1
Brewers
103.9
103.9
0.0
Mariners
112.2
112.9
-0.7
Angels
97.9
98.5
-0.7
Rockies
91.5
92.3
-0.7
Royals
101.9
102.7
-0.8
Blue Jays
106.2
107.1
-0.9
Orioles
112.9
113.9
-0.9
Twins
104.6
105.9
-1.3
Athletics
108.6
110.1
-1.5
Reds
99.8
101.5
-1.8
Rangers
105.4
107.3
-1.9
Phillies
106.8
108.7
-1.9
Padres
107.5
109.7
-2.2
Red Sox
101.2
103.5
-2.3
Giants
104.3
107.3
-3.0
Mets
110.3
114.4
-4.0
Atlanta’s offensive projection has improved more than that of any other team, so it isn’t just smoke and mirrors producing these results. At the risk of veering off topic, the 14-22 Astros’ having the second-most improved offensive projection is quite an awkward data point for the team’s struggling pitching staff. Conversely, even if you’re generally confident that the Phillies and Mets (and Red Sox) will right the ship, the projections are less optimistic than they were in March.
Let’s repeat the exercise with the pitchers:
ZiPS Projections – Braves Pitchers Now vs. Preseason
ZiPS is confident that Atlanta’s offensive improvements are legitimate, but it’s considerably less so when it comes to the pitching staff. I’ve already made a crack about Pérez, but ZiPS is also skeptical about Bryce Elder’s strides. Overall, it still sees the rotation as risky, though it is more bullish on several of the team’s relievers.
(For those curious, the most improved hitter and pitcher in baseball, from a projection standpoint, is Chase DeLauter and Mason Miller, respectively.)
ZiPS Projections – Team Pitchers Now vs. Preseason
Team
Rest-of-Season ERA+
Preseason ERA+
Diff
Padres
102.9
100.3
2.5
Yankees
104.3
101.9
2.4
Phillies
115.5
113.3
2.2
Brewers
105.5
103.3
2.2
Dodgers
111.4
109.6
1.8
Blue Jays
109.2
107.4
1.8
Mets
105.0
103.3
1.7
Marlins
101.3
99.8
1.5
Angels
95.2
94.0
1.3
White Sox
91.6
90.4
1.2
Pirates
111.5
110.5
1.1
Rockies
96.5
95.5
1.0
Tigers
107.8
107.0
0.8
Cubs
100.2
99.6
0.5
Mariners
104.7
104.5
0.1
Rangers
95.5
95.4
0.0
Twins
102.7
102.8
-0.2
Braves
106.9
107.2
-0.4
Giants
105.2
105.6
-0.4
Guardians
109.4
109.9
-0.5
Reds
96.3
96.8
-0.5
Diamondbacks
106.8
107.4
-0.6
Orioles
101.6
102.3
-0.7
Astros
104.3
105.3
-1.0
Athletics
94.2
95.2
-1.0
Rays
105.1
106.3
-1.2
Cardinals
97.7
99.0
-1.4
Nationals
89.8
91.1
-1.4
Royals
101.0
102.6
-1.6
Red Sox
108.5
110.6
-2.1
It’s kind of funny to see the Phillies so high up on this list, but they have allowed a .349 BABIP over 35 games, a freakishly high number that can’t possibly be sustained. One can see why the Yankees and Padres have been so strong in the early going, though their success is a story for another day.
Is the NL East race actually over? The projections and Betteridge’s law of headlines say no. But it is true that the Braves have flipped the script. It’s not as over for the Mets or Phillies as the vibes indicate, but if they are going to mount a comeback, they better start fairly soon. If not, they’ll quickly run out of calendar.
“Throw the bums out!” is a rich American tradition. While most used in the context of the messiness of that whole democracy thing, it’s also applicable to sports. When you’re a fan, especially a passionate one, and things are going horribly wrong for your favorite team, there’s a real sense of wanting the perpetrators of these crimes against excellence to be figuratively carted out in tumbrels and to meet their makers like Danton or Robespierre. And heads do roll in baseball when things are going badly, because someone has to take responsibility for a team’s crapitude, and it’s not going to be the team’s owner. Most often, it’s someone public-facing, as fans will not be appeased by the firing of some relatively anonymous staffer in operations. Since general managers and team presidents get first priority to hold the axe (but not always), and individual coaches don’t usually have wide-enough authority to take responsibility for the whole team, that leaves managers as the common sin eaters.
The moment of catharsis happens, and lo and behold, teams play a lot better, vindicating the demise of the ex-manager. It certainly feels that way, and it’s not the craziest idea in the world to think that there’s something to it. While you would expect teams in the midst of a spate of sucking to be underplaying their talent level rather than overplaying it, when you drive by an accident with a car that’s been unfortunately integrated into a telephone pole, it’s also quite likely that the driver had something to do with it.
Two managers have already been fired this season, after their large-payroll teams with championship aspirations got off to awful starts. Surprisingly, Alex Cora was first to go, as Red Sox chief baseball officer Craig Breslow canned not just Cora, but also anyone on the coaching staff considered to be one of Cora’s guys, on Saturday night after the team started the season 10-17. Then, on Tuesday, the Phillies fired Rob Thomson after they began the year 9-19, a woeful start that included a 10-game losing streak. Four years ago, Thomson became one of the most successful midseason replacement managers ever, as he steered a sinking Phillies ship back from a 22-29 start all the way to the World Series. Mets manager Carlos Mendoza can’t be comfortable about his job security right now, despite the team’s insistence that his job is safe. Read the rest of this entry »
The Houston Astros have a knack for disappointing Aprils. Despite usually being projected as the favorite or second favorite in the AL West every year for the last decade, the last time the Astros didn’t have a losing record at some point in the second half of April was 2019. But year after year, they’ve tended to get a powerful second wind. Excluding 2020, for obvious reasons, they haven’t finished with fewer than 87 wins in a season since 2016; overall, Houston has the second-most wins in baseball since the start of the 2017 season. During those previous mediocre starts, the projections have stood by the Astros. This time… not so much.
To see the last time the Astros started this dreadfully, you don’t have to go back very far. In 2024, they hit their nadir after 26 games, at 7-19. I wrote then, as I do now, about the hole they were digging for themselves. Though it was still an uphill battle to come back in the AL West — they in fact did, handily — the projections never turned sour. ZiPS projected the Astros to win 88 games going into that season, and despite their 7-16 record at the time I wrote that article, the computer still thought they’d continue to win games at the previously predicted rate.
ZiPS Median Projected Standings – AL West (4/22/24)
Team
W
L
GB
Pct
Div%
WC%
Playoff%
WS Win%
80th
20th
Texas Rangers
86
76
—
.531
41.0%
18.3%
59.3%
5.1%
94.1
79.2
Seattle Mariners
85
77
1
.525
30.7%
19.2%
50.0%
3.8%
92.1
77.4
Houston Astros
83
79
3
.512
23.1%
17.9%
41.0%
3.5%
90.3
75.2
Los Angeles Angels
75
87
11
.463
5.1%
7.1%
12.2%
0.4%
82.3
67.3
Oakland A’s
61
101
25
.377
0.1%
0.1%
0.2%
0.0%
68.6
53.6
SOURCE: Me
ZiPS does not have the same optimism that it had in 2024.
ZiPS Median Projected Standings – AL West (4/27/26)
Team
W
L
GB
Pct
Div%
WC%
Playoff%
WS Win%
80th
20th
Seattle Mariners
87
75
—
.537
48.9%
18.2%
67.1%
7.0%
93.5
80.3
Texas Rangers
83
79
4
.512
28.3%
20.2%
48.5%
2.7%
90.3
76.5
Athletics
79
83
8
.488
15.8%
15.6%
31.3%
0.9%
87.0
72.5
Houston Astros
75
87
12
.463
5.0%
8.0%
13.0%
0.5%
81.7
68.1
Los Angeles Angels
72
90
15
.444
1.9%
3.5%
5.4%
0.1%
78.1
65.0
Source: Yeah, still me
This time around, ZiPS doesn’t even think Houston is a .500 team the rest of the way, let alone one that’ll end up close to its projected record in the preseason. The Astros had a relatively deep rotation in 2024, especially compared to today, and at the time, basically all of their starters were injured. But ZiPS thought enough pitching would filter back in over the coming weeks to get the team back on track. However, in 2026, ZiPS only loves one Houston pitcher, Hunter Brown, and just a few days ago, general manager Dana Brown said Brown won’t be back until June, and that’s if there are no setbacks.
Projecting the Astros to have a sub-.500 record isn’t something that ZiPS does often. While I don’t have rest-of-season projections for every calendar date ever, I do have monthly updates, and the last time they were projected to finish with a losing record was the 2015 preseason, when they had a 77-85 projection for the year. Pinpointing the actual date by running a few more simulations, the last time before 2026 that Houston was projected to be a losing team over the rest of a season was almost exactly 11 years ago, on April 26, 2015, when a win over the Oakland Athletics improved the team’s record to 10-7 and its rest-of-season projected winning percentage to .49927.
The 2026 Astros have been this bad even as their offense has performed extremely well. They lead the American League with 5.21 runs per game, and their 118 wRC+ ranks fourth in baseball, to go along with 5.7 WAR from their position players, also good for fourth in the majors. Considering this, the Astros shouldn’t bank on an offensive surge to turn their season around. Instead, if Houston is going to make up ground in the standings, its pitching is going to have to improve.
If you’ve ever had the misfortune to follow election night coverage, you might have seen the various news desks give benchmarks for a particular candidate to beat in counties or in states to be on target to win. I can do the same kind of thing with ZiPS, so I asked it to benchmark what ERAs Houston’s pitching staff would have to hit to give the team a 50% chance of making the playoffs.
ZiPS Rest-of-Season ERA Benchmarks – Houston Astros
TLDR: To be a coin flip to make the playoffs, if the offense performs as expected, the Astros need their pitching staff to collectively outperform their projected ERAs by about half a run per nine innings. This is true whether or not you use the ZiPS projections or the combined Steamer/ZiPS Depth Charts projections. Just to illustrate how hard that is for a team to do, I prorated the preseason 2025 ZiPS projected ERAs to the actual innings pitched, and compared those to the final team ERAs for that year.
ZiPS 2025 Team ERA Projections, Projected vs. Actual
Team
Team ERA
Projected ZiPS ERA
Diff
Texas Rangers
3.49
4.33
-0.83
Milwaukee Brewers
3.59
4.07
-0.48
Cincinnati Reds
3.86
4.35
-0.48
Kansas City Royals
3.73
4.17
-0.43
Chicago White Sox
4.28
4.63
-0.35
Pittsburgh Pirates
3.76
4.09
-0.33
San Diego Padres
3.64
3.91
-0.26
Chicago Cubs
3.81
4.00
-0.19
Boston Red Sox
3.72
3.91
-0.19
Cleveland Guardians
3.70
3.88
-0.18
Philadelphia Phillies
3.79
3.96
-0.17
New York Yankees
3.91
4.01
-0.11
Houston Astros
3.86
3.88
-0.02
Tampa Bay Rays
3.94
3.94
0.00
San Francisco Giants
3.84
3.80
0.04
New York Mets
4.04
3.94
0.10
Detroit Tigers
3.97
3.85
0.13
Los Angeles Dodgers
3.95
3.81
0.14
Seattle Mariners
3.87
3.68
0.19
Miami Marlins
4.60
4.34
0.26
St. Louis Cardinals
4.30
4.04
0.26
Toronto Blue Jays
4.19
3.87
0.32
Athletics
4.71
4.28
0.43
Los Angeles Angels
4.89
4.44
0.45
Baltimore Orioles
4.62
4.00
0.62
Minnesota Twins
4.55
3.88
0.67
Arizona Diamondbacks
4.49
3.81
0.68
Atlanta Braves
4.36
3.65
0.71
Washington Nationals
5.35
4.55
0.80
Colorado Rockies
5.99
4.85
1.14
Only a single team, the Texas Rangers, outperformed its ERA projections by more than half a run. The Brewers and Reds came close, but they fell a bit further back when adjusting for the fact that ZiPS thought the league-wide ERA would be 0.12 higher than it actually was.
Now, consider the very real possibility that the Houston offense doesn’t merely perform as expected, but hits its 75th-percentile projection instead. The pitching would still have to beat its projections by 0.33 runs per game, meaning that even in a rosy scenario like this for the lineup, this team would still be an underdog.
On a fundamental level, the Astros need to find better pitchers from among the guys who aren’t currently envisioned by Depth Charts as contributors, and they need to find them right now. Ethan Pecko is the most interesting of the internal options, and as a fellow Towson native, I can’t help but root for him. He’s currently working back from thoracic outlet syndrome, and though he’s been very good on his minor league rehab assignment, he’s not likely to be up until later this summer. When he does return, he wouldn’t be enough by himself to fix this pitching staff, even if he had a Chase Burns-esque debut. AJ Blubaugh and Colton Gordon don’t project as instant game-changers, either. Houston would likely need to acquire some pitching, but from where? This has been an odd season so far, in that many of the worst teams (Astros, Red Sox, Mets, Phillies, Blue Jays, Royals) were expected to be contenders. That means there aren’t a lot of teams looking to be early sellers. But even if there were, these other underperforming clubs would likely be fierce competition for those players on the block.
Time is not on Houston’s side, in the short or long term. The short-term challenge is obvious, but the long-term one is nearly as daunting. The Astros are second in baseball in wRC+ from players over 30 years old (129), with Jose Altuve and Christian Walker both at ages when imminent decline is highly likely. Their two key offensive players in their 20s, Jeremy Peña and Yordan Alvarez, are free agents after 2027 and 2028, respectively. At the end of last season, our prospect team ranked Houston’s farm system 29th out of 30 teams. The best solution might be to do a bit of retooling, perhaps by trading anyone unsigned past this year. Then, assuming there’s a pre-lockout window to make some free agent signings as there was in 2021, absolutely blitz the top guys available with extremely generous one-year offers, with the hope that many of those players will want to get a second look at free agency in a hopefully normal winter after the 2027 season. But truth be told, this doesn’t really feel like something the Astros would do.
However it shakes out, this may be the most crucial period of Brown’s stint as GM. The Houston Astros are in a precarious position, and none of the options look particularly appealing. Some problems simply don’t have good solutions, and if they can’t conjure one up, we may be looking at the end of a moderately successfully dynasty in Houston.
Dan Szymborski: Here! Sorry, I had a weird problem getting int
12:15
thelwynn: The Mets are back, how long until they are in first place?
12:15
Dan Szymborski: It’s hard to say. The Mets will get to first place if there’s sufficient time remaining in the season for another tragic downfall
12:15
Farhandrew Zaidman: Evergreen question – is Shohei a better hitter or pitcher?
12:15
Dan Szymborski: Probably still hitter
12:15
Judge, speed demon: It’s pretty funny Judge’s “slow” start is 9 HR and a 163 OPS+ with 5 steals. With Ohtani and Soto probably taking it easy because of pitching and injury, maybe he’s the next huge slugger with surprising SB totals (he usually does steal 10-15 a year)
“It seems that the long arc of time has finally bent to my whims,” said the man, sundering the veil of silence in which he had cloistered himself. The luxurious, sovereign growth around his mouth stirred and parted once more as its owner granted himself a fleeting moment of almost rapturous satisfaction. “Those worthy of my ambitions have finally revealed themselves, and now I am compelled to do naught but grind the ambitions of my enemies into pale dust,” he intoned to the unadorned darkness, steepling his fingers in sacerdotal triumph.
At least, that’s what happened in the disordered mind of Dan Szymborski, curious for months where Lucas Giolito would end up in 2026. Since the end of the offseason, with Giolito unsigned, he’s been a source of speculation as the grand Plan B whenever a pitcher has been lost to injury, almost as if he were lying in wait. The rumors finally materialized into fact on Wednesday, as the San Diego Padres signed him to a one-year deal with a mutual option for the 2027 season.
If Giolito had been waiting for a perfect fit, the team with which he’d make the biggest impact, he was correct to join the Padres. In fact, given the rumors that had popped up, I had already started writing a slightly different piece before reality quite rudely interfered; in it, I used ZiPS to estimate his effect on the playoff probabilities for each team in baseball. And the Padres just happened to rank number one in ZiPS-projected Giolito impact, with their playoff probability shifting from 55% to 65% upon his acquisition, ahead of the Cubs (+8.1%), Athletics (+7.9%), Astros (+6.9%), and Braves (+6.4%), in terms of the size of the bump.
San Diego’s rotation has been quite solid in 2026, with a 3.53 ERA in the early going, and 2.4 WAR, placing it eighth in baseball. But there were dangers that the front office could not ignore. While there’s a lot more reason to be optimistic about Randy Vásquez now that his changeup and curveball appear to have evolved into whiff machines, Nick Pivetta’s injury was still extremely unwelcome news given the team’s rather thin depth. At the moment, it looks like Pivetta’s flexor strain will not require season-ending surgery, but he isn’t going to be back anytime soon.
Pivetta’s injury left the Padres to fight with the Dodgers for the NL West title with an almost non-existent margin for error in their rotation. Before his injury, they were already banking on Walker Buehler, a big enough risk that he signed with them on a minor league deal, and Germán Márquez, who hasn’t been both healthy and good since 2021. Griffin Canning is coming back from a significant Achilles injury and hasn’t pitched since June, and there’s no firm timetable yet for Joe Musgrove’s return from the Tommy John surgery he had 18 months ago. Yu Darvish is certainly not going to be back in 2026, or possibly ever. Keeping up with the Dodgers isn’t an easy task, so there are only so many wins you can concede while you wait and hope for some good injury news on one of these fronts.
The simple truth about Giolito is that he’s clearly no longer the pitcher he was when he got Cy Young votes each year from 2019 through 2021. If he were, he probably would have signed a contract north of $150 million during the offseason, instead of waiting to be a reinforcement for a contender in need. Even so, last year represented a successful comeback season for him, as he missed 2024 with internal brace surgery to repair his UCL. Giolito previously had full Tommy John surgery immediately after being drafted in the first round by the Nationals in 2012, those elbow questions being responsible for his falling to the 16th pick.
It’s true that last season was a successful return for Giolito, but there are some important caveats to that statement. His 3.41 ERA in 26 starts was certainly solid, but dark things lurked in his peripheral numbers. His FIP was a more middling 4.17, and his 7.5 K/9 represented a 20% drop-off from his 2022-2023 numbers and a third off his peak. Statcast’s xERA was especially negative, giving him a 5.01 for 2025, and though the ZiPS version was kinder, the zERA of 4.55 was hardly top-free-agent material. The goal here isn’t to add an ace — though I can’t imagine San Diego would object if he channeled his best years — but to get an arm capable of throwing some dependably league-average innings. And I think the Padres have a good chance of getting that.
ZiPS Projection – Lucas Giolito
Year
W
L
S
ERA
G
GS
IP
H
ER
HR
BB
SO
ERA+
WAR
2026
7
7
0
4.31
26
26
137.7
134
66
20
53
124
95
1.5
2027
5
6
0
4.39
22
22
110.7
107
54
16
42
98
93
1.1
The mutual option has real value to the Padres. If Giolito performs well, he would be a natural fit for their rotation next season should Michael King exercise his an opt-out. (The exact values of Giolito’s option are not yet public.) It’s hard to gauge this kind of thing in a projection, but it’s at least nice that signing Giolito also removes him as an option should the Dodgers or another contender, such as the Cubs, find themselves in dire straits, rotation-wise.
Does signing Giolito drastically change the story of the 2026 San Diego Padres? Probably not, but he’s a supporting character, and if the Padres are able to topple the Big Blue Empire on their seventh try and take the NL West crown, he will likely play a role in writing that happy ending.
With big expectations entering the season, the New York Mets got off to a reasonably solid start; through their first 11 games, they had a 7-4 record and a half-game lead in the NL East. Since then, though, things have gone… less well. And after getting swept by the Chicago Cubs over the weekend, the team is now sitting on an 11-game losing streak, a skid that has dropped them into last place in the NL East, a full 8 1/2 games behind the Atlanta Braves. So, just how doomed are the Mets?
While you can’t win a pennant in April, you can certainly lose one. As my colleague Jay Jaffe noted last week, when the Mets’ losing streak stood at a mere eight games, the offense bears a large share of the blame. They’ve scored just 19 runs since the streak began, and have managed even three runs in just two of those games. The Royals, the next-worst offense over their last 11 games, have scored more than 50% more runs than the Mets (31 to 19), and considering they’re 2-9 over that stretch, it’s not like they’re cruising either. The loss of Juan Soto to a strained calf muscle is significant, but it’s hard to pin the team’s offensive woes solely on that. Their 1.7 runs per game is about three runs off both the 4.7 they scored last year and what ZiPS projected for this year, and no hitter in history has made that big of a difference. Read the rest of this entry »
Dan Szymborski: AI is getter better at making fun of me, BTW.
12:02
Guest: Vegas had notably much worse ratings on the Twins than both ZIPS and PECOTA (not to mention the fans). Has anything you’ve seen in the Twins playing what has been pretty good baseball so far justified that much higher projection in your mind?
12:03
Dan Szymborski: Well, Taj Bradley’s been really darn good, I mean sub two FIP
12:04
Dan Szymborski: and Mick Abel has been really solid too (and one of the boom picks)
12:04
Dan Szymborski: I’m not confident at all they’re this good, but I think this was always a team in the .500 vicinity
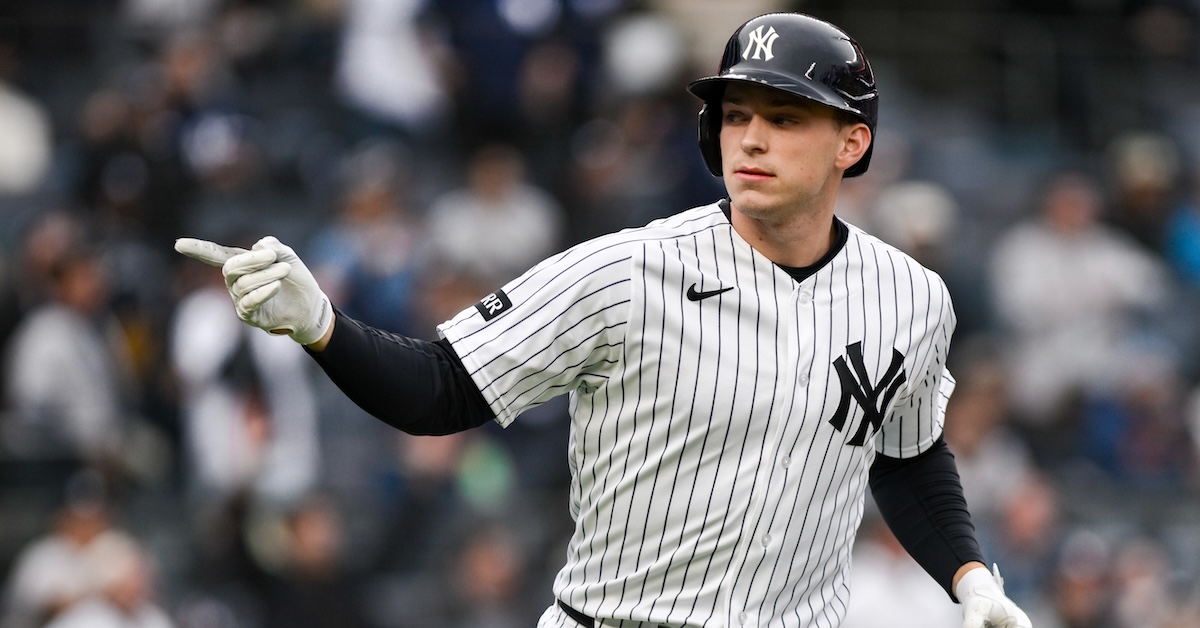
Coming into the season, the ZiPS projections generally saw the Yankees as having lower divisional odds than standings based on other projection systems and methodologies. One of the biggest reasons for that was, paradoxically, one of the best things a baseball team can possess: Aaron Judge with a signed contract. Since ZiPS attempts to simulate the effects of injuries, including season-ending ones, the Yankees offense took an absolutely brutal hit any time Judge was absent. In the system’s current season simulations, that effect has been mitigated somewhat by the improved projections of one man: first baseman Ben Rice.
Judge’s courtroom is a terrifying dystopia in which defendant pitchers find scant justice and almost sure punishment. And while this judge is typically content to handle executions himself, it’s Rice who has been operating the guillotine the most frequently in 2026. Through the first three weeks of the season, Rice has put up a .362/.500/.745 line, good for a league-leading 241 wRC+, and has already hit the 1-WAR mark.
Naturally, when you have an OPS nearing 1.300, a good number of things have probably gone your way, certainly more than have gone against you. Rice’s batting average, fourth in baseball among qualifiers, is naturally helped quite a lot by a .500 BABIP, which has yet to prove sustainable at the big league level. But what makes Rice’s season so amazing is that even if you take some of the helium out of his seasonal line, it still tells the story of a batter who might be emerging as one of baseball’s elite offensive talents. Read the rest of this entry »
Kyle Manzardo: I have the largest difference between xBA and real BA among qualified batters, is there hope for me or am I broken?
12:03
Dan Szymborski: I think you’ll be fine
12:03
Guest: “more tools than can be found at a Florida spring break kegger” just give Dan the Pulitzer now
12:03
Dan Szymborski: Pulitzer Prize for B- Snark
12:04
Guest: it’s April and it remains to be seen if he’s replacement level, average, or better, but is it too early to say Jordan Walker is meaningfully better than he was 2024-25?