2019 ZiPS Projections – Los Angeles Angels

After having typically appeared in the hallowed pages of Baseball Think Factory, Dan Szymborski’s ZiPS projections have now been released at FanGraphs for more than half a decade. The exercise continues this offseason. Below are the projections for the Los Angeles Angels, allegedly of Anaheim.
Batters
You may have heard of Mike Trout; he’s pretty good. I’m amazed that Andrelton Simmons still seems to be underrated by the media and fans. When was the last time a shortstop with a crazily hyped glove was underrated? You’d almost think that he was Adam Everett or Mark Belanger or Omar Vizquel when in fact he’d have been worth just under eight WAR over the last two seasons if he were a league-average defensive shortstop. Simmons has already snuck into the Top 50 all-time by my colleague Jay Jaffe’s JAWS metric, just a season from catching Dave Concepcion, Rafael Furcal, Vizquel, and the fringe Hall of Famer Rabbit Maranville. ZiPS projects Simmons to finish his career as the No. 14 shortstop by JAWS, just behind Derek Jeter and Barry Larkin, and just ahead of Bobby Wallace and Lou Boudreau. Andrelton is a superstar.
Albert Pujols is no longer a major league-caliber baseball player. He’s collected his 3000th hit and his 600th home run, but pretending that Pujols, at his best one of the greatest hitters of our generation, deserves a spot on the roster, let alone significant playing time, is becoming increasingly untenable. At some point, the Angels have to approach him with a plan to make as graceful and quick an exit from his playing career as they can manage, because in a world where the team was serious about fielding the best possible roster, they would be contemplating Pujols’ unconditional release. Even the creators of AfterMASH only needed two seasons to figure out they could only taint M*A*S*H’s legacy. The Angels have let three hitters go overseas this winter who project as more useful than Pujols (Jefry Marte, Jabari Blash, and the much-maligned Jose Miguel Fernandez).
I wouldn’t be quick to think of Shohei Ohtani’s offensive performance as fluky; in some ways, it’s just a natural power improvement from his previous year in Japan. ZiPS translated Ohtani’s final two seasons in Japan at .289/.356/.485, which looks a lot like his .285/.361/.564 with the Angels, with the power growth you hope to see from a talented young player with relatively few professional at-bats (he’s only at 1536 total now). ZiPS thinks he’ll have a lower average than in 2018, but he’s a real major league hitter.
Pitchers
If the Angels could keep all five of their starting pitchers healthy, the rotation would at least be acceptable. Problem is, essentially the entire rotation has an injury history, and many of its members have an extensive one. What’s frustrating about the Angels is that they have such highs in certain areas, but also several holes they’ve barely made a meaningful effort to go about fixing. ZiPS doesn’t see very high ceilings for any of the pitchers actually on the roster. If any team needed to go after Jake Arrieta last year or Dallas Keuchel this year, it’s the Angels. It would only take a few injuries for the Angels to have to turn to Dillon Peters or JC Ramirez (after he returns), which no contending team should be excited about.
Bench and Prospects
And here is why the Angels will fall short of the ZiPS seasonal simulation of the win total on their depth chart: the team’s plan B’s are absolutely atrocious around the field. The exceptions in the short-term are Jose Suarez and Griffin Canning, though I expect the Angels to give both a consolidation year at Triple-A (Suarez is still very young and Canning still has relatively little professional experience). Let’s put it this way: NRI Jarrett Parker is projected as the team’s fourth-best outfielder.
Things will get better. Jo Adell’s long-term projections are bananas, and the upside projections for Jahmai Jones and Brandon Marsh are at least…an apple? With a Brennon, two Brandons, and a Brendon in the projections, the Angels might as well sign Brennan Boesch to complete the set. The farm system has been steadily improving, but if the Angels want to stop wasting the prime of the best player they have ever had, and possibly will ever have, they really need to do better than dip a toe into free agency while they wait for the prospects to save them.
One pedantic note for 2019: for the WAR graphic, I’m using FanGraphs’ depth chart playing time, not the playing time ZiPS spits out, so there will be occasional differences in WAR totals.
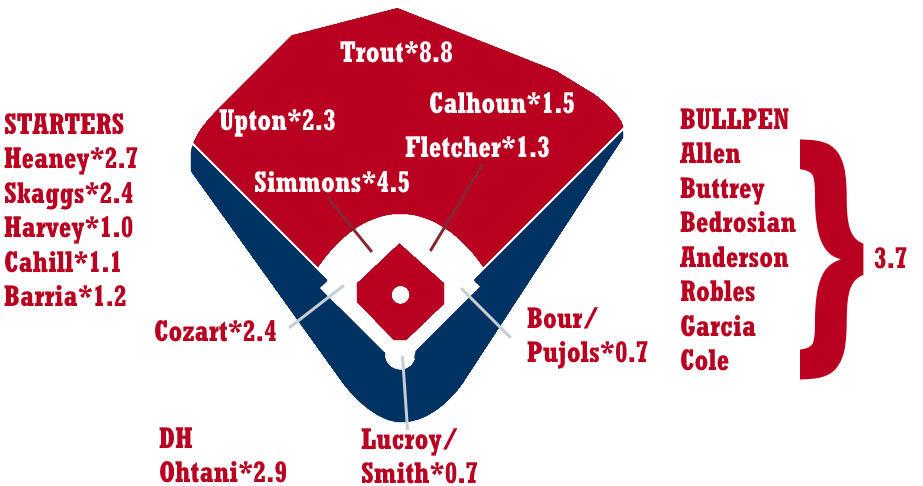
Ballpark graphic courtesy Eephus League. Depth charts constructed by way of those listed here at site.
| Player | B | Age | PO | G | AB | R | H | 2B | 3B | HR | RBI | BB | SO | SB | CS |
|---|---|---|---|---|---|---|---|---|---|---|---|---|---|---|---|
| Mike Trout | R | 27 | CF | 145 | 495 | 105 | 144 | 26 | 4 | 38 | 92 | 118 | 134 | 25 | 5 |
| Andrelton Simmons | R | 29 | SS | 150 | 561 | 66 | 156 | 28 | 3 | 10 | 66 | 37 | 51 | 11 | 3 |
| Shohei Ohtani | L | 24 | DH | 120 | 330 | 56 | 89 | 19 | 1 | 20 | 63 | 37 | 111 | 9 | 3 |
| Justin Upton | R | 31 | LF | 141 | 518 | 76 | 122 | 23 | 1 | 28 | 85 | 61 | 180 | 9 | 3 |
| Zack Cozart | R | 33 | 3B | 90 | 339 | 48 | 84 | 17 | 3 | 11 | 36 | 31 | 62 | 2 | 1 |
| Jabari Blash | R | 29 | RF | 112 | 352 | 55 | 76 | 16 | 1 | 22 | 59 | 46 | 147 | 5 | 4 |
| Kole Calhoun | L | 31 | RF | 140 | 520 | 72 | 124 | 22 | 3 | 18 | 68 | 54 | 133 | 5 | 2 |
| David Fletcher | R | 25 | 2B | 128 | 520 | 57 | 132 | 25 | 4 | 5 | 44 | 25 | 65 | 10 | 3 |
| Justin Bour | L | 31 | 1B | 120 | 381 | 45 | 90 | 14 | 1 | 21 | 69 | 52 | 113 | 1 | 0 |
| Jose Miguel Fernandez | L | 31 | 1B | 114 | 416 | 51 | 108 | 19 | 0 | 12 | 47 | 30 | 52 | 2 | 2 |
| Jonathan Lucroy | R | 33 | C | 120 | 413 | 43 | 102 | 18 | 2 | 7 | 46 | 32 | 69 | 1 | 0 |
| Luis Rengifo | B | 22 | SS | 132 | 544 | 66 | 130 | 24 | 7 | 9 | 51 | 46 | 106 | 27 | 16 |
| Jo Adell | R | 20 | CF | 99 | 408 | 50 | 89 | 19 | 3 | 16 | 52 | 23 | 140 | 11 | 4 |
| Jarrett Parker | L | 30 | LF | 85 | 275 | 36 | 58 | 10 | 1 | 13 | 39 | 29 | 116 | 4 | 3 |
| Wilfredo Tovar | R | 27 | SS | 116 | 399 | 40 | 95 | 16 | 1 | 5 | 32 | 22 | 62 | 14 | 7 |
| Jefry Marte | R | 28 | 1B | 106 | 319 | 41 | 73 | 15 | 1 | 14 | 45 | 25 | 77 | 4 | 2 |
| Jose Briceno | R | 26 | C | 89 | 312 | 31 | 66 | 11 | 1 | 10 | 33 | 14 | 80 | 3 | 2 |
| Zach Houchins | R | 26 | 3B | 113 | 434 | 46 | 96 | 17 | 2 | 14 | 52 | 21 | 108 | 2 | 3 |
| Kevan Smith | R | 31 | C | 84 | 289 | 30 | 73 | 12 | 0 | 5 | 31 | 15 | 49 | 0 | 0 |
| Ben Revere | L | 31 | LF | 90 | 310 | 39 | 82 | 11 | 3 | 3 | 24 | 16 | 31 | 12 | 3 |
| Taylor Ward | R | 25 | 3B | 127 | 486 | 58 | 109 | 15 | 0 | 13 | 49 | 49 | 133 | 9 | 1 |
| Ryan Schimpf | L | 31 | 2B | 101 | 341 | 46 | 69 | 13 | 1 | 17 | 54 | 42 | 152 | 1 | 2 |
| Cesar Puello | R | 28 | LF | 90 | 315 | 41 | 74 | 13 | 1 | 7 | 32 | 28 | 89 | 8 | 4 |
| Dustin Garneau | R | 31 | C | 73 | 246 | 26 | 50 | 11 | 0 | 7 | 27 | 18 | 64 | 0 | 2 |
| Julian Leon | R | 23 | C | 70 | 243 | 29 | 45 | 9 | 0 | 8 | 27 | 27 | 97 | 0 | 2 |
| Tommy La Stella | L | 30 | 3B | 104 | 195 | 21 | 47 | 9 | 0 | 3 | 19 | 19 | 34 | 0 | 1 |
| Chris B. Young | R | 35 | RF | 75 | 181 | 24 | 38 | 8 | 1 | 7 | 19 | 18 | 50 | 2 | 1 |
| Michael Hermosillo | R | 24 | CF | 104 | 382 | 46 | 82 | 16 | 3 | 10 | 38 | 31 | 125 | 11 | 8 |
| Roberto Pena | R | 27 | C | 59 | 203 | 17 | 43 | 7 | 0 | 3 | 15 | 8 | 41 | 0 | 1 |
| Peter Bourjos | R | 32 | CF | 118 | 290 | 33 | 63 | 12 | 5 | 5 | 25 | 16 | 79 | 3 | 4 |
| Matt Thaiss | L | 24 | 1B | 124 | 516 | 59 | 120 | 24 | 4 | 12 | 56 | 40 | 123 | 6 | 5 |
| Albert Pujols | R | 39 | 1B | 114 | 455 | 42 | 110 | 16 | 0 | 15 | 69 | 26 | 69 | 1 | 0 |
| Sherman Johnson | L | 28 | 3B | 104 | 363 | 40 | 70 | 15 | 2 | 6 | 31 | 41 | 112 | 7 | 3 |
| Brennon Lund | L | 24 | CF | 106 | 441 | 47 | 100 | 15 | 3 | 6 | 37 | 31 | 126 | 16 | 5 |
| Jared Walsh | L | 25 | 1B | 119 | 456 | 53 | 98 | 25 | 1 | 16 | 56 | 34 | 164 | 1 | 1 |
| Jahmai Jones | R | 21 | 2B | 126 | 520 | 60 | 113 | 19 | 5 | 12 | 49 | 43 | 150 | 19 | 8 |
| Eric Young Jr. | B | 34 | CF | 122 | 388 | 44 | 83 | 13 | 4 | 5 | 32 | 27 | 94 | 16 | 6 |
| Bo Way | L | 27 | CF | 100 | 358 | 33 | 79 | 10 | 3 | 1 | 22 | 22 | 78 | 10 | 9 |
| Stephen McGee | R | 28 | C | 55 | 170 | 19 | 30 | 7 | 0 | 4 | 15 | 23 | 70 | 0 | 0 |
| Jose Rojas | L | 26 | 1B | 110 | 426 | 45 | 96 | 18 | 2 | 11 | 45 | 23 | 112 | 6 | 5 |
| Jack Kruger | R | 24 | C | 99 | 405 | 39 | 88 | 15 | 1 | 5 | 30 | 24 | 100 | 7 | 4 |
| Brandon Marsh | L | 21 | CF | 119 | 499 | 56 | 103 | 19 | 4 | 11 | 49 | 44 | 191 | 10 | 5 |
| Connor Justus | R | 24 | SS | 118 | 428 | 44 | 75 | 13 | 2 | 6 | 30 | 44 | 142 | 6 | 7 |
| David MacKinnon | R | 24 | 1B | 117 | 423 | 50 | 85 | 17 | 1 | 5 | 33 | 60 | 127 | 0 | 0 |
| Roberto Baldoquin | R | 25 | SS | 81 | 302 | 24 | 60 | 7 | 2 | 2 | 20 | 15 | 92 | 4 | 5 |
| Brandon Sandoval | R | 24 | RF | 101 | 383 | 37 | 85 | 10 | 2 | 3 | 24 | 25 | 105 | 14 | 10 |
| Brendon Sanger | L | 25 | RF | 106 | 379 | 41 | 76 | 15 | 1 | 8 | 35 | 41 | 121 | 4 | 3 |
| Player | PA | BA | OBP | SLG | OPS+ | ISO | BABIP | RC/27 | Def | WAR | No. 1 Comp |
|---|---|---|---|---|---|---|---|---|---|---|---|
| Mike Trout | 628 | .291 | .433 | .590 | 180 | .299 | .328 | 10.1 | 1 | 8.3 | Willie Mays |
| Andrelton Simmons | 608 | .278 | .325 | .392 | 97 | .114 | .292 | 4.9 | 17 | 4.2 | Luke Appling |
| Shohei Ohtani | 370 | .270 | .343 | .515 | 133 | .245 | .347 | 6.6 | 0 | 2.2 | Carlos May |
| Justin Upton | 588 | .236 | .321 | .446 | 109 | .210 | .303 | 5.1 | 1 | 2.1 | Bob Bailey |
| Zack Cozart | 378 | .248 | .315 | .413 | 99 | .165 | .274 | 4.7 | 3 | 1.5 | Rick Schu |
| Jabari Blash | 407 | .216 | .317 | .455 | 110 | .239 | .295 | 4.9 | 1 | 1.5 | Karl Pagel |
| Kole Calhoun | 583 | .238 | .312 | .396 | 94 | .158 | .287 | 4.4 | 5 | 1.4 | Jacque Jones |
| David Fletcher | 556 | .254 | .293 | .346 | 76 | .092 | .282 | 3.8 | 7 | 1.2 | Alberto Gonzalez |
| Justin Bour | 437 | .236 | .327 | .444 | 111 | .207 | .279 | 5.2 | -2 | 1.1 | Paul Sorrento |
| Jose Miguel Fernandez | 453 | .260 | .316 | .392 | 95 | .132 | .273 | 4.5 | 3 | 0.7 | Jim Bowie |
| Jonathan Lucroy | 455 | .247 | .304 | .351 | 81 | .104 | .282 | 3.9 | -2 | 0.7 | Tony Pena |
| Luis Rengifo | 601 | .239 | .306 | .358 | 83 | .119 | .282 | 3.8 | -6 | 0.6 | D’Angelo Jimenez |
| Jo Adell | 439 | .218 | .269 | .397 | 81 | .179 | .290 | 3.8 | 0 | 0.5 | Matt Kemp |
| Jarrett Parker | 308 | .211 | .292 | .396 | 88 | .185 | .308 | 3.9 | 2 | 0.4 | Damon Mashore |
| Wilfredo Tovar | 427 | .238 | .280 | .321 | 66 | .083 | .271 | 3.2 | 4 | 0.3 | Alex Prieto |
| Jefry Marte | 351 | .229 | .293 | .414 | 93 | .185 | .259 | 4.3 | -1 | 0.3 | Ricky Freeman |
| Jose Briceno | 330 | .212 | .246 | .349 | 62 | .138 | .252 | 2.9 | 4 | 0.3 | Jim Horner |
| Zach Houchins | 461 | .221 | .260 | .366 | 71 | .145 | .263 | 3.2 | 5 | 0.2 | Clay Bellinger |
| Kevan Smith | 313 | .253 | .298 | .346 | 78 | .093 | .289 | 3.7 | -3 | 0.2 | Joe Azcue |
| Ben Revere | 330 | .265 | .301 | .348 | 79 | .084 | .286 | 4.1 | 2 | 0.1 | Tike Redman |
| Taylor Ward | 543 | .224 | .299 | .335 | 76 | .111 | .282 | 3.6 | -4 | 0.0 | Carlos Villalobos |
| Ryan Schimpf | 391 | .202 | .297 | .396 | 89 | .194 | .302 | 3.9 | -9 | 0.0 | Shanie Dugas |
| Cesar Puello | 359 | .235 | .316 | .349 | 84 | .114 | .306 | 3.9 | -2 | -0.1 | Domingo Michel |
| Dustin Garneau | 271 | .203 | .263 | .333 | 64 | .130 | .246 | 2.8 | 0 | -0.1 | Chad Moeller |
| Julian Leon | 280 | .185 | .282 | .321 | 67 | .136 | .268 | 2.8 | -2 | -0.1 | Nicholas Derba |
| Tommy La Stella | 217 | .241 | .313 | .333 | 80 | .092 | .278 | 3.6 | -4 | -0.2 | Johnny Burnett |
| Chris B. Young | 203 | .210 | .287 | .381 | 83 | .171 | .250 | 3.7 | -2 | -0.2 | Mike Devereaux |
| Michael Hermosillo | 432 | .215 | .290 | .351 | 76 | .136 | .291 | 3.4 | -4 | -0.2 | Xavier Paul |
| Roberto Pena | 216 | .212 | .248 | .291 | 49 | .079 | .252 | 2.4 | 3 | -0.2 | Pedro Grifol |
| Peter Bourjos | 312 | .217 | .265 | .345 | 67 | .128 | .282 | 3.0 | 1 | -0.2 | Dewayne Wise |
| Matt Thaiss | 564 | .233 | .291 | .364 | 80 | .132 | .283 | 3.6 | 2 | -0.4 | Willie Upshaw |
| Albert Pujols | 486 | .242 | .284 | .376 | 81 | .134 | .256 | 3.8 | 0 | -0.4 | Ray Knight |
| Sherman Johnson | 411 | .193 | .279 | .295 | 59 | .102 | .261 | 2.8 | 0 | -0.5 | Mike Hickey |
| Brennon Lund | 482 | .227 | .285 | .315 | 66 | .088 | .304 | 3.3 | -4 | -0.5 | Chris Duffy |
| Jared Walsh | 498 | .215 | .272 | .379 | 78 | .164 | .297 | 3.5 | 1 | -0.5 | Jay Kirkpatrick |
| Jahmai Jones | 572 | .217 | .282 | .342 | 72 | .125 | .282 | 3.4 | -8 | -0.6 | Desi Relaford |
| Eric Young Jr. | 425 | .214 | .271 | .307 | 60 | .093 | .270 | 3.0 | -1 | -0.6 | Calvin Murray |
| Bo Way | 392 | .221 | .275 | .274 | 53 | .053 | .280 | 2.4 | 4 | -0.7 | Anthony Iapoce |
| Stephen McGee | 196 | .176 | .281 | .288 | 58 | .112 | .271 | 2.7 | -6 | -0.7 | Jeff Ontiveros |
| Jose Rojas | 455 | .225 | .267 | .354 | 70 | .129 | .281 | 3.2 | 4 | -0.7 | Larry Barnes |
| Jack Kruger | 435 | .217 | .267 | .296 | 56 | .079 | .277 | 2.7 | -2 | -0.7 | Mike Knapp |
| Brandon Marsh | 547 | .206 | .272 | .327 | 65 | .120 | .310 | 3.0 | -2 | -0.7 | Xavier Paul |
| Connor Justus | 487 | .175 | .267 | .257 | 46 | .082 | .246 | 2.1 | 3 | -0.9 | Niuman Romero |
| David MacKinnon | 494 | .201 | .306 | .281 | 65 | .080 | .275 | 2.9 | -1 | -1.1 | Dustin Yount |
| Roberto Baldoquin | 324 | .199 | .242 | .255 | 38 | .056 | .279 | 1.9 | 1 | -1.2 | Jason Bowers |
| Brandon Sandoval | 413 | .222 | .272 | .282 | 54 | .060 | .298 | 2.5 | 2 | -1.4 | Brent Bish |
| Brendon Sanger | 426 | .201 | .282 | .309 | 64 | .108 | .272 | 2.9 | -7 | -1.7 | Alex Miranda |
| Player | T | Age | W | L | ERA | G | GS | IP | H | ER | HR | BB | SO |
|---|---|---|---|---|---|---|---|---|---|---|---|---|---|
| Andrew Heaney | L | 28 | 10 | 8 | 3.95 | 28 | 28 | 161.7 | 163 | 71 | 23 | 38 | 148 |
| Tyler Skaggs | L | 27 | 8 | 7 | 3.94 | 22 | 22 | 112.0 | 113 | 49 | 12 | 36 | 100 |
| Jose Suarez | L | 21 | 5 | 5 | 4.18 | 26 | 26 | 116.3 | 110 | 54 | 16 | 46 | 115 |
| Jaime Barria | R | 22 | 10 | 9 | 4.39 | 31 | 31 | 145.7 | 151 | 71 | 20 | 46 | 106 |
| Griffin Canning | R | 23 | 8 | 7 | 4.33 | 23 | 23 | 114.3 | 111 | 55 | 14 | 47 | 99 |
| Shohei Ohtani | R | 24 | 6 | 5 | 3.79 | 15 | 15 | 78.3 | 67 | 33 | 9 | 36 | 94 |
| Cody Allen | R | 30 | 5 | 4 | 3.50 | 66 | 0 | 64.3 | 53 | 25 | 7 | 26 | 74 |
| Trevor Cahill | R | 31 | 8 | 8 | 4.28 | 22 | 22 | 111.3 | 108 | 53 | 15 | 47 | 96 |
| Matt Harvey | R | 30 | 7 | 8 | 4.56 | 27 | 24 | 132.3 | 144 | 67 | 21 | 30 | 101 |
| Ty Buttrey | R | 26 | 3 | 3 | 3.88 | 49 | 2 | 67.3 | 61 | 29 | 6 | 32 | 71 |
| John Lamb | L | 28 | 4 | 4 | 4.63 | 19 | 19 | 83.7 | 89 | 43 | 13 | 30 | 74 |
| Patrick Sandoval | L | 22 | 5 | 6 | 4.75 | 24 | 19 | 102.3 | 103 | 54 | 16 | 45 | 90 |
| Cam Bedrosian | R | 27 | 5 | 5 | 3.88 | 67 | 0 | 60.3 | 59 | 26 | 7 | 22 | 56 |
| Alex Meyer | R | 29 | 4 | 4 | 4.43 | 16 | 11 | 63.0 | 59 | 31 | 7 | 34 | 62 |
| Felix Pena | R | 29 | 5 | 6 | 4.73 | 24 | 22 | 123.7 | 129 | 65 | 20 | 45 | 112 |
| Luis Garcia | R | 32 | 3 | 3 | 3.81 | 63 | 0 | 56.7 | 56 | 24 | 4 | 23 | 51 |
| Dillon Peters | L | 26 | 7 | 9 | 4.74 | 24 | 22 | 117.7 | 133 | 62 | 16 | 38 | 77 |
| Justin Anderson | R | 26 | 3 | 3 | 4.10 | 61 | 0 | 63.7 | 57 | 29 | 6 | 38 | 68 |
| Taylor Cole | R | 29 | 3 | 3 | 4.19 | 53 | 0 | 73.0 | 68 | 34 | 10 | 33 | 73 |
| Noe Ramirez | R | 29 | 5 | 5 | 4.19 | 61 | 0 | 73.0 | 68 | 34 | 11 | 28 | 77 |
| Ivan Pineyro | R | 27 | 6 | 7 | 4.81 | 25 | 19 | 116.0 | 128 | 62 | 18 | 31 | 83 |
| Joe Gatto | R | 24 | 6 | 8 | 5.00 | 25 | 25 | 113.3 | 123 | 63 | 10 | 67 | 67 |
| Matt Ramsey | R | 29 | 3 | 2 | 4.08 | 39 | 1 | 46.3 | 44 | 21 | 5 | 20 | 45 |
| Blake Wood | R | 33 | 3 | 3 | 3.95 | 52 | 0 | 54.7 | 53 | 24 | 5 | 24 | 52 |
| Jim Johnson | R | 36 | 4 | 3 | 4.03 | 59 | 0 | 58.0 | 60 | 26 | 5 | 19 | 44 |
| Hansel Robles | R | 28 | 4 | 4 | 4.17 | 63 | 0 | 69.0 | 65 | 32 | 9 | 31 | 67 |
| Nick Tropeano | R | 28 | 5 | 7 | 4.98 | 17 | 17 | 86.7 | 92 | 48 | 16 | 35 | 74 |
| John Curtiss | R | 26 | 3 | 3 | 4.30 | 48 | 0 | 60.7 | 56 | 29 | 7 | 31 | 60 |
| JC Ramirez | R | 30 | 7 | 9 | 4.94 | 22 | 22 | 125.7 | 137 | 69 | 20 | 46 | 87 |
| Dylan Unsworth | R | 26 | 5 | 7 | 5.07 | 22 | 16 | 103.0 | 120 | 58 | 18 | 21 | 59 |
| Keynan Middleton | R | 25 | 2 | 2 | 4.24 | 50 | 0 | 51.0 | 49 | 24 | 7 | 22 | 51 |
| Jeremy Rhoades | R | 26 | 6 | 7 | 4.52 | 52 | 0 | 71.7 | 77 | 36 | 10 | 22 | 52 |
| Miguel Almonte | R | 26 | 3 | 4 | 5.25 | 32 | 9 | 58.3 | 61 | 34 | 9 | 30 | 49 |
| Junichi Tazawa | R | 33 | 2 | 3 | 4.94 | 48 | 0 | 47.3 | 51 | 26 | 8 | 17 | 40 |
| Deck McGuire | R | 30 | 6 | 8 | 5.22 | 31 | 19 | 110.3 | 116 | 64 | 20 | 48 | 90 |
| Akeel Morris | R | 26 | 3 | 3 | 4.82 | 50 | 0 | 61.7 | 60 | 33 | 7 | 38 | 56 |
| Luis Madero | R | 22 | 5 | 7 | 5.31 | 22 | 22 | 98.3 | 114 | 58 | 17 | 32 | 60 |
| Jesus Castillo | R | 23 | 6 | 9 | 5.31 | 23 | 22 | 101.7 | 119 | 60 | 17 | 34 | 56 |
| Ralston Cash | R | 27 | 4 | 6 | 4.92 | 46 | 0 | 64.0 | 64 | 35 | 9 | 36 | 60 |
| Williams Jerez | L | 27 | 2 | 3 | 5.06 | 50 | 0 | 69.3 | 72 | 39 | 11 | 34 | 64 |
| Zac Ryan | R | 25 | 4 | 5 | 4.95 | 40 | 0 | 63.7 | 64 | 35 | 6 | 44 | 50 |
| Jake Jewell | R | 26 | 3 | 4 | 5.17 | 50 | 0 | 54.0 | 59 | 31 | 8 | 28 | 39 |
| Daniel Procopio | R | 23 | 2 | 2 | 5.40 | 37 | 0 | 53.3 | 50 | 32 | 6 | 46 | 53 |
| Forrest Snow | R | 30 | 5 | 8 | 5.69 | 27 | 17 | 104.3 | 119 | 66 | 24 | 35 | 82 |
| Osmer Morales | R | 26 | 4 | 6 | 5.82 | 26 | 20 | 102.0 | 114 | 66 | 21 | 49 | 80 |
| Luis Pena | R | 23 | 6 | 9 | 6.03 | 24 | 24 | 109.0 | 120 | 73 | 21 | 66 | 88 |
| Ryan Clark | R | 25 | 4 | 7 | 6.39 | 39 | 7 | 76.0 | 90 | 54 | 18 | 37 | 58 |
| Player | TBF | K/9 | BB/9 | HR/9 | BABIP | ERA+ | ERA- | FIP | WAR | No. 1 Comp |
|---|---|---|---|---|---|---|---|---|---|---|
| Andrew Heaney | 682 | 8.24 | 2.12 | 1.28 | .300 | 105 | 95 | 4.00 | 2.5 | Mark Redman |
| Tyler Skaggs | 483 | 8.04 | 2.89 | 0.96 | .307 | 106 | 95 | 3.88 | 1.7 | Steve Trout |
| Jose Suarez | 503 | 8.90 | 3.56 | 1.24 | .294 | 100 | 100 | 4.30 | 1.5 | Bill Pulsipher |
| Jaime Barria | 630 | 6.55 | 2.84 | 1.24 | .290 | 95 | 105 | 4.57 | 1.5 | Don Welchel |
| Griffin Canning | 504 | 7.79 | 3.70 | 1.10 | .291 | 96 | 104 | 4.53 | 1.3 | Walt Terrell |
| Shohei Ohtani | 335 | 10.80 | 4.14 | 1.03 | .299 | 106 | 94 | 3.70 | 1.2 | Kerry Wood |
| Cody Allen | 270 | 10.35 | 3.64 | 0.98 | .286 | 119 | 84 | 3.57 | 1.1 | Turk Wendell |
| Trevor Cahill | 489 | 7.76 | 3.80 | 1.21 | .288 | 94 | 106 | 4.66 | 1.1 | Bob Buhl |
| Matt Harvey | 566 | 6.87 | 2.04 | 1.43 | .301 | 89 | 113 | 4.48 | 0.9 | Josh Towers |
| Ty Buttrey | 294 | 9.49 | 4.28 | 0.80 | .302 | 107 | 93 | 3.76 | 0.8 | Clay Bryant |
| John Lamb | 367 | 7.96 | 3.23 | 1.40 | .308 | 90 | 111 | 4.58 | 0.7 | Trey Moore |
| Patrick Sandoval | 454 | 7.92 | 3.96 | 1.41 | .293 | 88 | 114 | 4.92 | 0.6 | Bill Krueger |
| Cam Bedrosian | 259 | 8.35 | 3.28 | 1.04 | .301 | 107 | 93 | 3.95 | 0.6 | Jim Acker |
| Alex Meyer | 281 | 8.86 | 4.86 | 1.00 | .297 | 94 | 106 | 4.39 | 0.6 | Chris Oxspring |
| Felix Pena | 542 | 8.15 | 3.27 | 1.46 | .304 | 85 | 117 | 4.68 | 0.6 | Dennis Burtt |
| Luis Garcia | 246 | 8.10 | 3.65 | 0.64 | .311 | 106 | 95 | 3.54 | 0.6 | Kevin Gryboski |
| Dillon Peters | 521 | 5.89 | 2.91 | 1.22 | .305 | 85 | 118 | 4.73 | 0.5 | Jeff Mutis |
| Justin Anderson | 286 | 9.61 | 5.37 | 0.85 | .300 | 102 | 98 | 4.22 | 0.5 | Marc Pisciotta |
| Taylor Cole | 320 | 9.00 | 4.07 | 1.23 | .291 | 99 | 101 | 4.49 | 0.5 | Ruddy Lugo |
| Noe Ramirez | 315 | 9.49 | 3.45 | 1.36 | .294 | 99 | 101 | 4.36 | 0.4 | Jim Dougherty |
| Ivan Pineyro | 505 | 6.44 | 2.41 | 1.40 | .301 | 84 | 119 | 4.72 | 0.4 | Steve Lemke |
| Joe Gatto | 528 | 5.32 | 5.32 | 0.79 | .300 | 83 | 120 | 5.07 | 0.4 | Rick Berg |
| Matt Ramsey | 202 | 8.74 | 3.88 | 0.97 | .300 | 102 | 98 | 4.03 | 0.4 | Gabriel Dehoyos |
| Blake Wood | 239 | 8.56 | 3.95 | 0.82 | .308 | 102 | 98 | 3.86 | 0.4 | Roger McDowell |
| Jim Johnson | 251 | 6.83 | 2.95 | 0.78 | .304 | 100 | 100 | 3.84 | 0.4 | Fred Gladding |
| Hansel Robles | 301 | 8.74 | 4.04 | 1.17 | .293 | 97 | 103 | 4.38 | 0.3 | Ruddy Lugo |
| Nick Tropeano | 384 | 7.68 | 3.63 | 1.66 | .297 | 84 | 120 | 5.16 | 0.3 | Mark Thompson |
| John Curtiss | 269 | 8.90 | 4.60 | 1.04 | .293 | 97 | 103 | 4.40 | 0.3 | Terry Bross |
| JC Ramirez | 556 | 6.23 | 3.29 | 1.43 | .295 | 82 | 123 | 5.08 | 0.3 | Dick Fowler |
| Dylan Unsworth | 447 | 5.16 | 1.83 | 1.57 | .297 | 82 | 122 | 5.03 | 0.3 | Daniel Griffin |
| Keynan Middleton | 223 | 9.00 | 3.88 | 1.24 | .298 | 95 | 105 | 4.35 | 0.2 | Wayne Nix |
| Jeremy Rhoades | 312 | 6.53 | 2.76 | 1.26 | .299 | 92 | 109 | 4.60 | 0.2 | Mike Draper |
| Miguel Almonte | 265 | 7.56 | 4.63 | 1.39 | .299 | 79 | 126 | 5.17 | -0.1 | Regular Bob Gibson |
| Junichi Tazawa | 208 | 7.61 | 3.23 | 1.52 | .303 | 84 | 119 | 4.80 | -0.1 | Jason Childers |
| Deck McGuire | 494 | 7.34 | 3.92 | 1.63 | .292 | 77 | 129 | 5.37 | -0.1 | Michael Smith |
| Akeel Morris | 282 | 8.17 | 5.55 | 1.02 | .298 | 84 | 119 | 4.80 | -0.2 | Heathcliff Slocumb |
| Luis Madero | 439 | 5.49 | 2.93 | 1.56 | .299 | 76 | 132 | 5.34 | -0.2 | Matt O’Brien |
| Jesus Castillo | 456 | 4.96 | 3.01 | 1.50 | .297 | 76 | 132 | 5.40 | -0.2 | Matt O’Brien |
| Ralston Cash | 291 | 8.44 | 5.06 | 1.27 | .301 | 82 | 122 | 4.93 | -0.2 | Ryan Henderson |
| Williams Jerez | 313 | 8.31 | 4.41 | 1.43 | .305 | 82 | 122 | 5.01 | -0.3 | Jimmy Hamilton |
| Zac Ryan | 298 | 7.07 | 6.22 | 0.85 | .299 | 82 | 123 | 5.07 | -0.3 | Lloyd Allen |
| Jake Jewell | 249 | 6.50 | 4.67 | 1.33 | .300 | 81 | 124 | 5.41 | -0.3 | Sean Green |
| Daniel Procopio | 255 | 8.94 | 7.76 | 1.01 | .299 | 75 | 134 | 5.38 | -0.5 | Heathcliff Slocumb |
| Forrest Snow | 465 | 7.07 | 3.02 | 2.07 | .299 | 73 | 137 | 5.75 | -0.5 | Jason Roach |
| Osmer Morales | 467 | 7.06 | 4.32 | 1.85 | .299 | 71 | 140 | 5.88 | -0.6 | Jeff Schmidt |
| Luis Pena | 511 | 7.27 | 5.45 | 1.73 | .300 | 69 | 145 | 6.02 | -0.9 | Joel Santo |
| Ryan Clark | 353 | 6.87 | 4.38 | 2.13 | .305 | 63 | 159 | 6.32 | -1.3 | Phil Dumatrait |
Disclaimer: ZiPS projections are computer-based projections of performance. Performances have not been allocated to predicted playing time in the majors — many of the players listed above are unlikely to play in the majors at all in 2019. ZiPS is projecting equivalent production — a .240 ZiPS projection may end up being .280 in AAA or .300 in AA, for example. Whether or not a player will play is one of many non-statistical factors one has to take into account when predicting the future.
Players are listed with their most recent teams, unless I have made a mistake. This is very possible, as a lot of minor-league signings go generally unreported in the offseason.
ZiPS’ projections are based on the American League having a 4.29 ERA and the National League having a 4.15 ERA.
Players who are expected to be out due to injury are still projected. More information is always better than less information, and a computer isn’t the tool that should project the injury status of, for example, a pitcher who has had Tommy John surgery.
Both hitters and pitchers are ranked by projected zWAR — which is to say, WAR values as calculated by me, Dan Szymborski, whose surname is spelled with a z. WAR values might differ slightly from those which appear in full release of ZiPS. Finally, I will advise anyone against — and might karate chop anyone guilty of — merely adding up WAR totals on a depth chart to produce projected team WAR.
 Dan Szymborski