2026 ZiPS Projections: New York Mets

For the 22nd consecutive season, the ZiPS projection system is unleashing a full set of prognostications. For more information on the ZiPS projections, please consult this year’s introduction, as well as MLB’s glossary entry. The team order is selected by lot, and the penultimate team is the New York Mets.
Batters
The Mets are a bit like an intellectual character in a 19th Century Russian novel. They’re well-read enough to understand why life just isn’t working, and while they make changes every winter, it always seems to come with the precognition that something will go horribly wrong, and there’s little recourse but to observe their own downfall. Yankees fandom is more transactional, and depending on how the season turns out, you either cheer the empire or curse Brian Cashman. Rooting for the Mets is existential; you go into every season with hope, but an unquenchable feeling that something will go horribly or maybe even comically wrong. Meaning as a Mets fan does not come from celebrating the team’s achievements, but the act of enduring and returning, year after year, with the knowledge that preparation offers no escape. Mets fans essentially become annotators of doomed worlds.
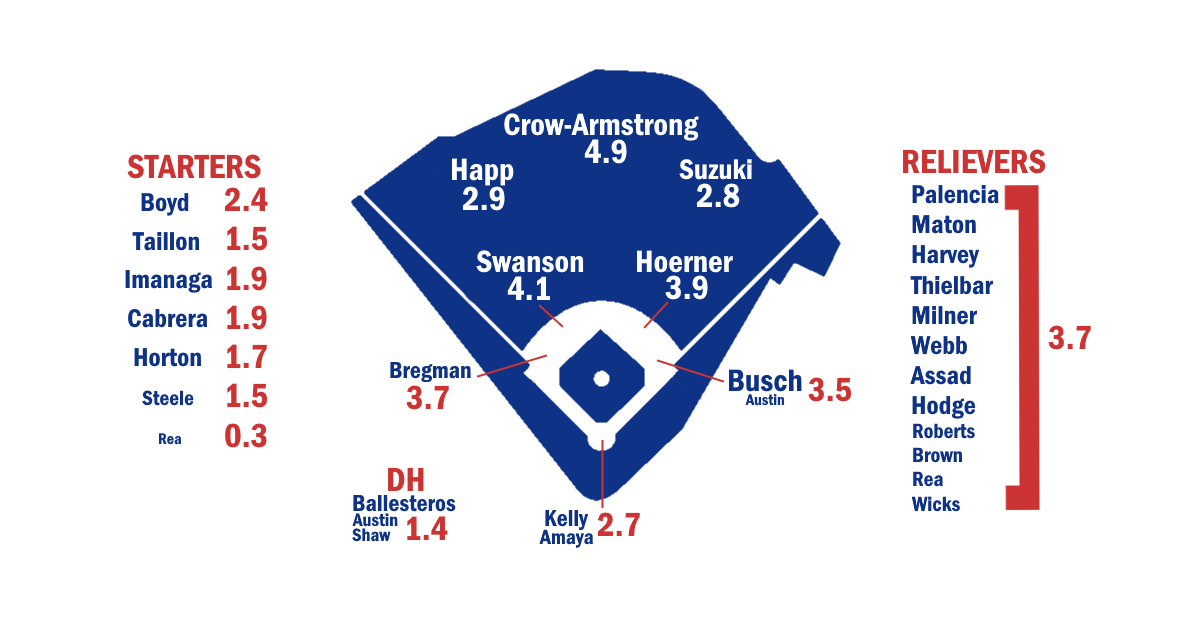
If every moment of Mets triumph is matched with an equal measure of Mets tragedy, the lineup may be in for some dark times when the worm turns. I actually think I’d rather have Pete Alonso for his deal than Jorge Polanco for his if I were the Mets, but the projections suggest that I might be wrong. Either way, this lineup looks extremely solid as a whole. Starting with two players, Juan Soto and Francisco Lindor make up for a lot of sins. But there aren’t really a lot of sins in the lineup. ZiPS thinks Bo Bichette is more valuable at third base than he was at shortstop, and he certainly has All-Star potential. ZiPS also forecasts decent bounce-back seasons for offseason trade acquisitions Luis Robert Jr. and Marcus Semien. Francisco Alvarez is coming off a near .800 OPS season, and under the new rules encouraging stolen bases, Luis Torrens’ value has increased because of his ability at preventing them, making him more than capable at holding up the lighter end of a catching tandem.
The DH situation isn’t amazing, with Mark Vientos getting the bulk of the plate appearances there, but only a few teams really get a ton of WAR from that spot anyway. Carson Benge certainly has upside, and while it’s not a particularly exciting projection, it’s not a bad forecast for a guy who hasn’t hit Triple-A pitchers yet. Brett Baty showed in 2025 that he can hit well enough to provide solid depth for the Mets. Jett Williams was also good depth in the infield, but he didn’t have a clear path to actual playing time in the majors in 2026 outside of a reserve role, so the Mets sent him to Milwaukee on Wednesday night as part of a trade to the get right-handed pitchers Freddy Peralta and Tobias Myers.
Pitchers
ZiPS expects the Mets’ pitching to be pretty good, giving the staff a bit of a bump from last year’s preseason projections. And that was before the trade for Peralta, who was the Brewers’ the most valuable pitcher. While Peralta’s not really a sub-three ERA guy — ZiPS thinks he’s legitimate a low-BABIP pitcher, but .243 is damned hard to maintain — he’s still an excellent pitcher who is a huge addition to New York’s rotation. Clay Holmes isn’t an ace, and he bled a couple strikeouts when he transitioned from the bullpen to the rotation, but his 2025 also demonstrates that his conversion to starting wasn’t just a mad scientist’s latest crazy plan. Nolan McLean looks like a much stronger bet going into 2026 than he did at this time last year, and while Jonah Tong didn’t have instant success in the majors, he also greatly boosted his stock, though we may not see a lot of it in the majors in 2026 unless the team is hit by injuries. Last year, David Peterson didn’t match his 2.90 ERA from 2024, but that never should have been the expectation anyway, and he’s a fairly dependable no. 2 starter type. Kodai Senga’s return went generally well, aside from nobody checking how the ghost fork graphic at the stadium would interact with a strikeout tally.
Sean Manaea ought to get back to effectively eating innings in 2026, and though he’s certainly not the headliner, the acquired Myers is a reasonable option to have in reserve. ZiPS is less excited once we get past Myers, to guys like Christian Scott and Cooper Criswell. But on the plus side, ZiPS thinks there’s a real chance that Jonathan Pintaro’s command will improve just enough for him to have a breakout in 2026.
ZiPS views the Mets as having an above-average bullpen, but one that’s below baseball’s elite. Maybe it’s just cognitive dissonance on my part, but I still have some worries about Devin Williams despite all the objective data suggesting he’s a great bounce-back candidate. And he is, but 2025 will still be in the back of my mind plus, you know, the Mets. Luke Weaver is a good bullpen no. 2 and fallback closer option, and A.J. Minter was at his Mintest last season. Brooks Raley gets a strong projection as well, and ZiPS is unaware of my extreme bias in favor of side-armers; Raley is more low three-quarters, but he’s at least side-arm adjacent. Criswell gets a significantly better projection as a reliever than as a starter. My silicon counterpart is rather meh on the rest of the bullpen, except for maybe Huascar Brazobán, but it still looks like a highly cromulent unit.
Despite last season’s collapse, ZiPS projects the Mets as a highly competitive team in the NL East, and one the league shouldn’t dismiss. Now, come September, six Mets could need Tommy John surgery, or maybe Juan Soto and Francisco Lindor are destined to get trapped inside a leatherbound book given to Carlos Mendoza by a library maintenance worker who looks suspiciously like M.R. James. But predictive algorithms and fuzzy clustering methods allow us to peek only so far behind the veil of fate.
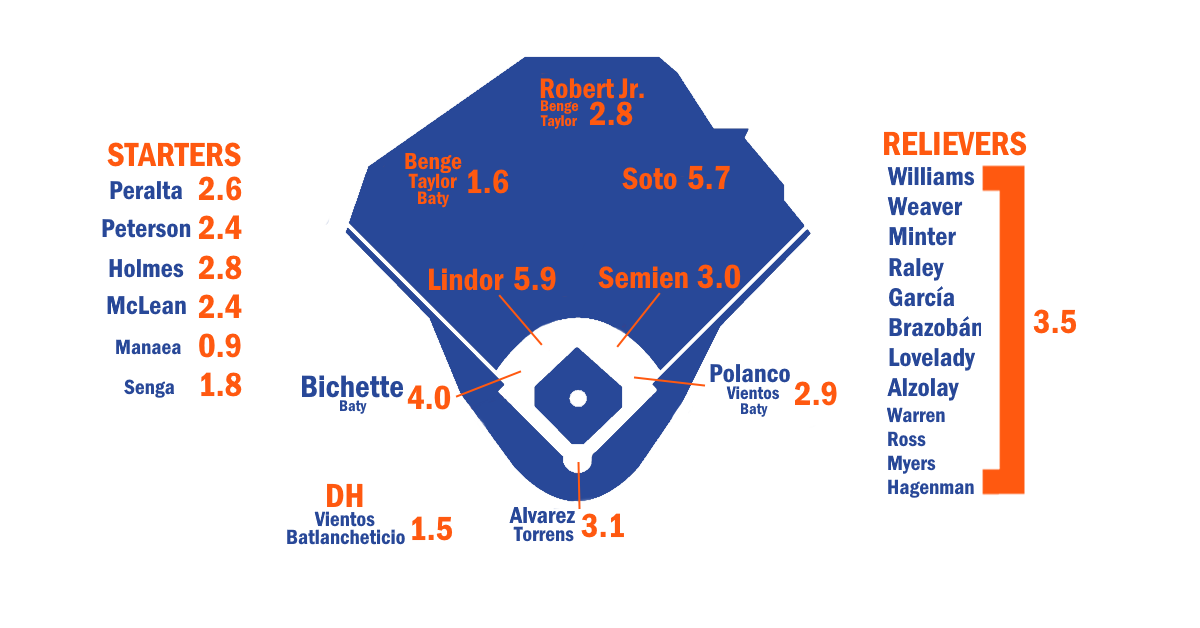
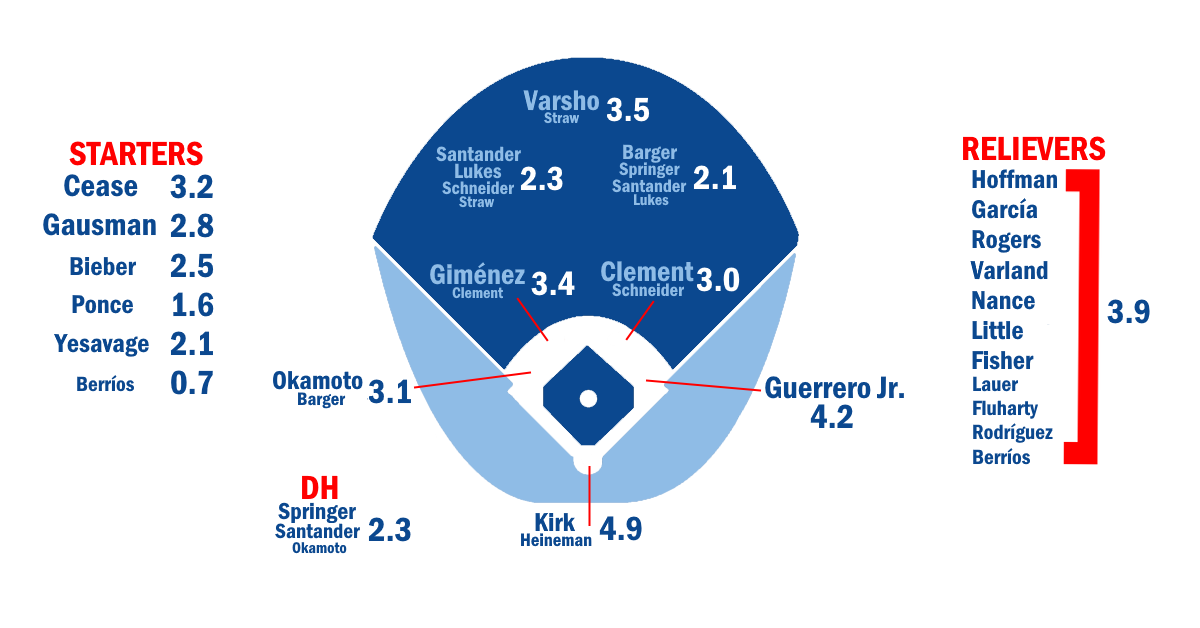
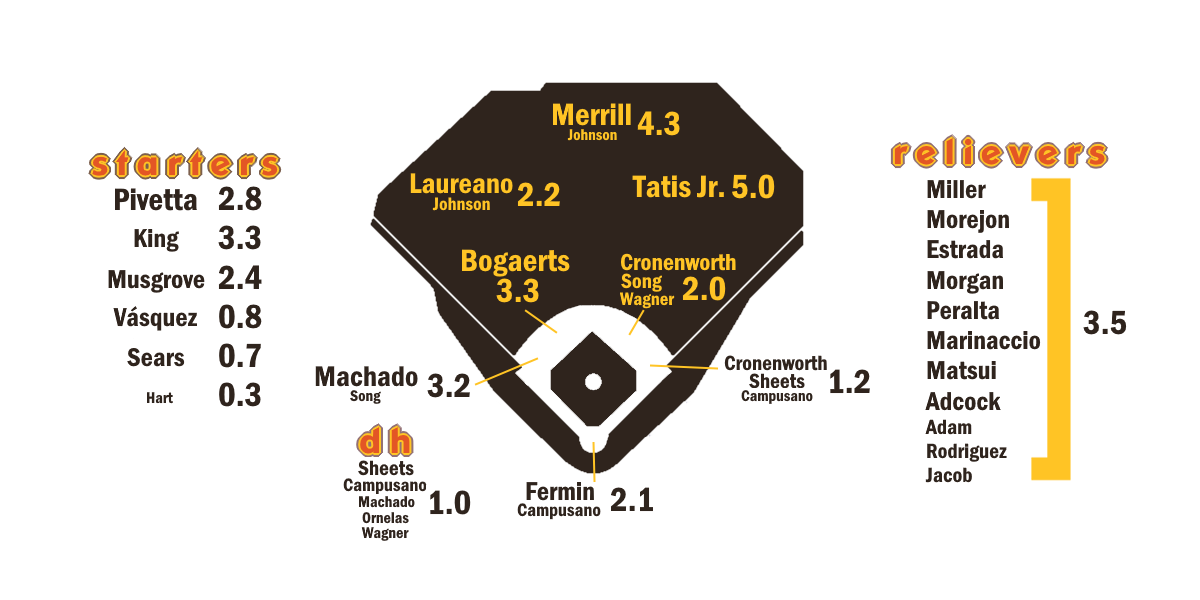
Ballpark graphic courtesy Eephus League. Depth charts constructed by way of those listed here. Size of player names is very roughly proportional to Depth Chart playing time. The final team projections may differ considerably from our Depth Chart playing time.
| Player | B | Age | PO | PA | AB | R | H | 2B | 3B | HR | RBI | BB | SO | SB | CS |
|---|---|---|---|---|---|---|---|---|---|---|---|---|---|---|---|
| Juan Soto | L | 27 | RF | 670 | 538 | 109 | 146 | 23 | 1 | 37 | 103 | 124 | 116 | 23 | 3 |
| Francisco Lindor | B | 32 | SS | 672 | 596 | 102 | 157 | 30 | 1 | 27 | 90 | 58 | 121 | 23 | 4 |
| Bo Bichette | R | 28 | 3B | 598 | 555 | 73 | 163 | 31 | 1 | 17 | 80 | 37 | 97 | 5 | 4 |
| Marcus Semien | R | 35 | 2B | 581 | 521 | 80 | 127 | 21 | 2 | 17 | 69 | 52 | 93 | 9 | 2 |
| Brett Baty | L | 26 | 3B | 471 | 426 | 59 | 107 | 16 | 1 | 19 | 61 | 39 | 115 | 5 | 1 |
| Francisco Alvarez | R | 24 | C | 441 | 392 | 53 | 92 | 15 | 1 | 21 | 64 | 41 | 118 | 1 | 0 |
| Jorge Polanco | B | 32 | 1B | 473 | 419 | 56 | 106 | 18 | 0 | 21 | 69 | 45 | 93 | 4 | 2 |
| Luis Robert Jr. | R | 28 | CF | 470 | 428 | 59 | 102 | 19 | 0 | 18 | 69 | 35 | 127 | 24 | 6 |
| Mark Vientos | R | 26 | 3B | 527 | 480 | 59 | 121 | 22 | 2 | 22 | 77 | 37 | 137 | 1 | 0 |
| Jacob Reimer | R | 22 | 3B | 518 | 461 | 74 | 108 | 27 | 3 | 15 | 70 | 41 | 123 | 6 | 2 |
| Ronny Mauricio | B | 25 | 3B | 460 | 429 | 54 | 104 | 18 | 1 | 15 | 53 | 27 | 117 | 13 | 4 |
| Jose Siri | R | 30 | CF | 358 | 327 | 50 | 66 | 14 | 1 | 14 | 47 | 23 | 131 | 12 | 3 |
| Carson Benge | L | 23 | CF | 522 | 464 | 72 | 114 | 22 | 5 | 13 | 65 | 48 | 110 | 11 | 3 |
| Luis Torrens | R | 30 | C | 271 | 249 | 24 | 62 | 12 | 1 | 6 | 30 | 17 | 60 | 1 | 1 |
| Ji Hwan Bae | L | 26 | CF | 399 | 358 | 63 | 91 | 17 | 4 | 4 | 42 | 35 | 93 | 20 | 6 |
| Chris Suero | R | 22 | C | 487 | 422 | 62 | 86 | 14 | 1 | 13 | 60 | 47 | 150 | 14 | 6 |
| Jared Young | L | 30 | LF | 407 | 359 | 51 | 87 | 16 | 2 | 15 | 57 | 38 | 96 | 5 | 2 |
| Ryan Clifford | L | 22 | 1B | 587 | 511 | 63 | 109 | 22 | 1 | 25 | 79 | 66 | 174 | 4 | 2 |
| Jackson Cluff | L | 29 | SS | 365 | 319 | 44 | 65 | 13 | 2 | 8 | 40 | 35 | 118 | 11 | 2 |
| David Villar | R | 29 | 1B | 401 | 354 | 48 | 78 | 15 | 0 | 13 | 49 | 39 | 114 | 2 | 1 |
| Jesse Winker | L | 32 | DH | 364 | 307 | 39 | 72 | 13 | 1 | 9 | 39 | 49 | 77 | 4 | 1 |
| Tyrone Taylor | R | 32 | CF | 339 | 312 | 41 | 72 | 18 | 2 | 7 | 33 | 16 | 76 | 9 | 2 |
| Wyatt Young | L | 26 | 2B | 439 | 386 | 48 | 89 | 11 | 1 | 3 | 34 | 43 | 99 | 7 | 3 |
| Yonny Hernández | B | 28 | 2B | 400 | 353 | 47 | 85 | 10 | 2 | 2 | 32 | 33 | 61 | 9 | 6 |
| A.J. Ewing | L | 21 | CF | 592 | 537 | 81 | 135 | 23 | 8 | 4 | 57 | 47 | 127 | 36 | 8 |
| Chris Williams | R | 29 | C | 321 | 283 | 35 | 55 | 11 | 0 | 11 | 37 | 32 | 116 | 1 | 0 |
| Kevin Parada | R | 24 | C | 440 | 399 | 41 | 87 | 18 | 1 | 12 | 51 | 30 | 140 | 2 | 1 |
| Jose Rojas | L | 33 | DH | 434 | 389 | 48 | 85 | 20 | 2 | 18 | 60 | 39 | 106 | 5 | 1 |
| Gilberto Celestino | R | 27 | RF | 385 | 347 | 42 | 82 | 12 | 1 | 4 | 35 | 35 | 90 | 6 | 2 |
| Starling Marte | R | 37 | DH | 321 | 292 | 38 | 76 | 12 | 1 | 7 | 34 | 19 | 69 | 10 | 2 |
| Christian Arroyo | R | 31 | 1B | 236 | 219 | 26 | 54 | 11 | 0 | 5 | 24 | 12 | 53 | 2 | 1 |
| Luis De Los Santos | R | 28 | 3B | 365 | 337 | 38 | 73 | 12 | 1 | 7 | 35 | 21 | 103 | 2 | 1 |
| Rafael Ortega | L | 35 | RF | 326 | 285 | 36 | 60 | 12 | 1 | 6 | 30 | 35 | 75 | 10 | 5 |
| Nick Morabito | R | 23 | CF | 499 | 454 | 59 | 109 | 18 | 2 | 4 | 47 | 36 | 123 | 27 | 9 |
| Tsung-Che Cheng | L | 24 | SS | 482 | 427 | 52 | 91 | 16 | 3 | 6 | 45 | 40 | 126 | 13 | 7 |
| Cristian Pache | R | 27 | RF | 286 | 257 | 27 | 54 | 9 | 1 | 4 | 26 | 24 | 91 | 4 | 2 |
| Niko Goodrum | B | 34 | SS | 247 | 211 | 27 | 46 | 8 | 1 | 4 | 23 | 33 | 74 | 5 | 3 |
| Jose Ramos | R | 25 | RF | 467 | 425 | 51 | 91 | 14 | 2 | 15 | 50 | 34 | 175 | 3 | 4 |
| D’Andre Smith | R | 25 | LF | 369 | 344 | 39 | 84 | 15 | 2 | 6 | 41 | 17 | 85 | 12 | 2 |
| Hayden Senger | R | 29 | C | 268 | 244 | 26 | 50 | 8 | 1 | 4 | 24 | 14 | 82 | 1 | 1 |
| Travis Swaggerty | L | 28 | LF | 215 | 193 | 23 | 38 | 7 | 2 | 2 | 18 | 20 | 69 | 4 | 2 |
| JT Schwartz | L | 26 | 1B | 385 | 345 | 36 | 77 | 16 | 1 | 5 | 39 | 30 | 77 | 1 | 2 |
| Travis Jankowski | L | 35 | CF | 193 | 170 | 24 | 37 | 5 | 0 | 1 | 14 | 19 | 39 | 9 | 1 |
| Estarling Mercado | L | 23 | 1B | 207 | 186 | 21 | 36 | 6 | 1 | 6 | 24 | 16 | 65 | 2 | 1 |
| Nick Lorusso | R | 25 | 3B | 436 | 399 | 39 | 85 | 23 | 0 | 6 | 41 | 29 | 121 | 5 | 2 |
| Marco Vargas | L | 21 | 2B | 448 | 404 | 52 | 83 | 9 | 2 | 2 | 32 | 39 | 103 | 18 | 5 |
| Eli Serrano III | L | 23 | CF | 380 | 341 | 42 | 68 | 17 | 2 | 7 | 38 | 31 | 89 | 4 | 2 |
| Onix Vega | R | 27 | C | 203 | 183 | 18 | 37 | 5 | 1 | 1 | 16 | 16 | 45 | 1 | 2 |
| Troy Schreffler Jr. | R | 25 | LF | 218 | 199 | 27 | 39 | 5 | 2 | 4 | 21 | 13 | 78 | 6 | 2 |
| Omar De Los Santos | R | 26 | RF | 324 | 303 | 40 | 60 | 8 | 3 | 9 | 35 | 14 | 135 | 21 | 7 |
| Trace Willhoite | R | 25 | 1B | 428 | 381 | 55 | 71 | 13 | 1 | 14 | 52 | 31 | 136 | 7 | 1 |
| Yohairo Cuevas | L | 22 | RF | 424 | 376 | 40 | 74 | 19 | 1 | 2 | 33 | 39 | 121 | 10 | 3 |
| William Lugo | R | 24 | SS | 438 | 398 | 39 | 78 | 14 | 1 | 8 | 41 | 32 | 128 | 3 | 1 |
| Yonatan Henriquez | B | 21 | CF | 423 | 385 | 49 | 77 | 15 | 2 | 6 | 37 | 34 | 100 | 15 | 5 |
| Ronald Hernandez | B | 22 | C | 422 | 385 | 41 | 76 | 12 | 2 | 5 | 38 | 30 | 114 | 10 | 2 |
| Diego Mosquera | R | 22 | LF | 253 | 229 | 15 | 46 | 5 | 1 | 0 | 17 | 16 | 56 | 3 | 3 |
| Boston Baro | L | 21 | SS | 451 | 420 | 45 | 88 | 16 | 4 | 4 | 37 | 25 | 104 | 13 | 1 |
| Alex Ramirez | R | 23 | RF | 441 | 406 | 46 | 81 | 14 | 1 | 4 | 33 | 32 | 117 | 19 | 6 |
| Corey Collins | L | 24 | DH | 271 | 230 | 19 | 33 | 4 | 1 | 5 | 24 | 29 | 92 | 2 | 1 |
| Vincent Perozo | L | 23 | C | 313 | 283 | 29 | 53 | 11 | 1 | 3 | 29 | 19 | 98 | 2 | 2 |
| Colin Houck | R | 21 | 3B | 502 | 460 | 55 | 84 | 17 | 4 | 8 | 44 | 33 | 204 | 6 | 3 |
| Jefrey De Los Santos | L | 23 | RF | 308 | 281 | 26 | 52 | 10 | 3 | 4 | 26 | 20 | 104 | 4 | 2 |
| Nick Roselli | L | 23 | 2B | 344 | 312 | 33 | 56 | 13 | 1 | 7 | 34 | 21 | 117 | 2 | 1 |
| Player | PA | BA | OBP | SLG | OPS+ | ISO | BABIP | Def | WAR | wOBA | 3YOPS+ | RC |
|---|---|---|---|---|---|---|---|---|---|---|---|---|
| Juan Soto | 670 | .271 | .408 | .524 | 163 | .253 | .283 | -7 | 5.6 | .398 | 162 | 121 |
| Francisco Lindor | 672 | .263 | .338 | .453 | 123 | .190 | .290 | 6 | 5.4 | .342 | 116 | 98 |
| Bo Bichette | 598 | .294 | .339 | .445 | 121 | .151 | .331 | 5 | 3.8 | .339 | 118 | 87 |
| Marcus Semien | 581 | .244 | .315 | .390 | 100 | .146 | .268 | 8 | 2.8 | .309 | 93 | 67 |
| Brett Baty | 471 | .251 | .318 | .427 | 110 | .176 | .301 | 2 | 2.3 | .324 | 111 | 59 |
| Francisco Alvarez | 441 | .235 | .315 | .439 | 112 | .204 | .281 | -2 | 2.3 | .326 | 114 | 54 |
| Jorge Polanco | 473 | .253 | .327 | .446 | 118 | .193 | .279 | 6 | 2.1 | .334 | 112 | 63 |
| Luis Robert Jr. | 470 | .238 | .302 | .409 | 100 | .171 | .297 | 4 | 2.1 | .307 | 101 | 60 |
| Mark Vientos | 527 | .252 | .311 | .444 | 112 | .192 | .308 | -3 | 2.0 | .326 | 114 | 66 |
| Jacob Reimer | 518 | .234 | .313 | .403 | 102 | .169 | .288 | 1 | 1.9 | .312 | 105 | 60 |
| Ronny Mauricio | 460 | .242 | .291 | .394 | 93 | .152 | .300 | 8 | 1.8 | .296 | 95 | 53 |
| Jose Siri | 358 | .202 | .261 | .379 | 79 | .177 | .286 | 9 | 1.3 | .277 | 76 | 36 |
| Carson Benge | 522 | .246 | .326 | .399 | 105 | .153 | .296 | -9 | 1.2 | .317 | 109 | 64 |
| Luis Torrens | 271 | .249 | .300 | .378 | 92 | .129 | .306 | 4 | 1.2 | .296 | 91 | 29 |
| Ji Hwan Bae | 399 | .254 | .324 | .358 | 94 | .104 | .333 | -1 | 1.1 | .301 | 95 | 48 |
| Chris Suero | 487 | .204 | .304 | .334 | 82 | .130 | .282 | -3 | 1.0 | .287 | 89 | 48 |
| Jared Young | 407 | .242 | .325 | .423 | 111 | .181 | .290 | -3 | 0.9 | .327 | 106 | 51 |
| Ryan Clifford | 587 | .213 | .308 | .407 | 102 | .194 | .269 | 0 | 0.9 | .312 | 109 | 66 |
| Jackson Cluff | 365 | .204 | .289 | .332 | 77 | .129 | .295 | 2 | 0.8 | .277 | 75 | 34 |
| David Villar | 401 | .220 | .304 | .373 | 92 | .153 | .286 | 7 | 0.8 | .299 | 90 | 41 |
| Jesse Winker | 364 | .235 | .347 | .371 | 105 | .136 | .285 | 0 | 0.8 | .321 | 103 | 41 |
| Tyrone Taylor | 339 | .231 | .282 | .369 | 84 | .138 | .284 | 3 | 0.8 | .283 | 82 | 35 |
| Wyatt Young | 439 | .231 | .310 | .288 | 72 | .057 | .303 | 7 | 0.8 | .273 | 72 | 37 |
| Yonny Hernández | 400 | .241 | .316 | .297 | 76 | .056 | .286 | 5 | 0.7 | .278 | 76 | 37 |
| A.J. Ewing | 592 | .251 | .314 | .346 | 88 | .095 | .323 | -7 | 0.7 | .291 | 89 | 69 |
| Chris Williams | 321 | .194 | .280 | .350 | 78 | .156 | .282 | -1 | 0.5 | .279 | 75 | 28 |
| Kevin Parada | 440 | .218 | .280 | .358 | 81 | .140 | .304 | -4 | 0.5 | .280 | 85 | 41 |
| Jose Rojas | 434 | .219 | .293 | .419 | 100 | .201 | .253 | 0 | 0.5 | .307 | 94 | 49 |
| Gilberto Celestino | 385 | .236 | .312 | .311 | 79 | .075 | .308 | 6 | 0.4 | .282 | 79 | 36 |
| Starling Marte | 321 | .260 | .319 | .380 | 98 | .120 | .319 | 0 | 0.4 | .308 | 93 | 38 |
| Christian Arroyo | 236 | .247 | .292 | .365 | 86 | .119 | .304 | 5 | 0.4 | .288 | 82 | 24 |
| Luis De Los Santos | 365 | .217 | .269 | .320 | 67 | .103 | .291 | 6 | 0.3 | .261 | 67 | 30 |
| Rafael Ortega | 326 | .211 | .295 | .323 | 76 | .112 | .265 | 7 | 0.3 | .277 | 71 | 31 |
| Nick Morabito | 499 | .240 | .305 | .315 | 77 | .075 | .321 | -3 | 0.2 | .278 | 81 | 53 |
| Tsung-Che Cheng | 482 | .213 | .283 | .307 | 68 | .094 | .288 | 1 | 0.2 | .264 | 70 | 43 |
| Cristian Pache | 286 | .210 | .282 | .300 | 66 | .089 | .309 | 8 | 0.1 | .262 | 67 | 23 |
| Niko Goodrum | 247 | .218 | .328 | .322 | 87 | .104 | .316 | -6 | 0.1 | .296 | 81 | 25 |
| Jose Ramos | 467 | .214 | .276 | .362 | 80 | .148 | .323 | 6 | 0.1 | .280 | 85 | 45 |
| D’Andre Smith | 369 | .244 | .293 | .352 | 83 | .108 | .308 | 1 | 0.0 | .284 | 86 | 39 |
| Hayden Senger | 268 | .205 | .260 | .295 | 58 | .090 | .291 | 3 | 0.0 | .248 | 58 | 19 |
| Travis Swaggerty | 215 | .197 | .274 | .285 | 60 | .088 | .295 | 3 | -0.3 | .253 | 61 | 17 |
| JT Schwartz | 385 | .223 | .297 | .319 | 76 | .096 | .274 | 3 | -0.4 | .276 | 80 | 34 |
| Travis Jankowski | 193 | .218 | .302 | .265 | 64 | .047 | .277 | -3 | -0.4 | .262 | 62 | 16 |
| Estarling Mercado | 207 | .194 | .271 | .333 | 71 | .139 | .261 | 0 | -0.5 | .268 | 75 | 18 |
| Nick Lorusso | 436 | .213 | .268 | .316 | 66 | .103 | .290 | 0 | -0.5 | .258 | 69 | 36 |
| Marco Vargas | 448 | .205 | .277 | .252 | 53 | .047 | .271 | 3 | -0.5 | .243 | 57 | 34 |
| Eli Serrano III | 380 | .199 | .274 | .323 | 69 | .124 | .249 | -4 | -0.6 | .265 | 76 | 32 |
| Onix Vega | 203 | .202 | .271 | .257 | 52 | .055 | .263 | -3 | -0.6 | .241 | 59 | 14 |
| Troy Schreffler Jr. | 218 | .196 | .253 | .302 | 58 | .106 | .299 | 2 | -0.6 | .246 | 61 | 17 |
| Omar De Los Santos | 324 | .198 | .242 | .333 | 62 | .135 | .321 | 0 | -0.9 | .251 | 66 | 32 |
| Trace Willhoite | 428 | .186 | .266 | .336 | 70 | .150 | .247 | 1 | -0.9 | .266 | 75 | 36 |
| Yohairo Cuevas | 424 | .197 | .283 | .269 | 59 | .072 | .285 | 2 | -1.1 | .252 | 61 | 32 |
| William Lugo | 438 | .196 | .263 | .296 | 59 | .100 | .267 | -7 | -1.1 | .250 | 63 | 32 |
| Yonatan Henriquez | 423 | .200 | .268 | .296 | 61 | .096 | .254 | -6 | -1.2 | .253 | 67 | 36 |
| Ronald Hernandez | 422 | .197 | .263 | .278 | 55 | .081 | .267 | -8 | -1.2 | .244 | 61 | 31 |
| Diego Mosquera | 253 | .201 | .268 | .231 | 44 | .030 | .266 | 1 | -1.2 | .231 | 45 | 16 |
| Boston Baro | 451 | .210 | .255 | .295 | 56 | .086 | .269 | -8 | -1.4 | .242 | 61 | 35 |
| Alex Ramirez | 441 | .200 | .261 | .268 | 52 | .068 | .270 | 4 | -1.4 | .239 | 56 | 35 |
| Corey Collins | 271 | .143 | .262 | .235 | 43 | .092 | .211 | 0 | -1.4 | .235 | 46 | 15 |
| Vincent Perozo | 313 | .187 | .259 | .265 | 50 | .078 | .275 | -10 | -1.5 | .238 | 56 | 21 |
| Colin Houck | 502 | .183 | .243 | .289 | 51 | .106 | .306 | -2 | -1.7 | .237 | 60 | 35 |
| Jefrey De Los Santos | 308 | .185 | .245 | .285 | 51 | .100 | .277 | -3 | -1.8 | .235 | 57 | 21 |
| Nick Roselli | 344 | .179 | .245 | .295 | 53 | .116 | .261 | -13 | -2.1 | .241 | 59 | 23 |
| Player | Hit Comp 1 | Hit Comp 2 | Hit Comp 3 |
|---|---|---|---|
| Juan Soto | Rusty Staub | Carl Yastrzemski | Barry Bonds |
| Francisco Lindor | Marcus Semien | Charlie Gehringer | Carlos Guillén |
| Bo Bichette | Carney Lansford | Cecil Travis | Martín Prado |
| Marcus Semien | Eddie Mayo | Jimmy Rollins | Ian Kinsler |
| Brett Baty | Ryan Rua | Doug DeCinces | Ken Macha |
| Francisco Alvarez | Earl Williams | Todd Zeile | Derek Parks |
| Jorge Polanco | Greg Brock | Richie Hebner | Joe Collins |
| Luis Robert Jr. | Carl Everett | Bill Barrett | Jake Marisnick |
| Mark Vientos | Kevin Mitchell | Jeff Kent | Tony Perez |
| Jacob Reimer | Carlos Asuaje | Scott Romano | Bill Melton |
| Ronny Mauricio | Gene Freese | Tom Brookens | J.P. Roberge |
| Jose Siri | Billy Cowan | Corey Brown | Hiram Bocachica |
| Carson Benge | George Vukovich | Andrew McCutchen | Bernie Williams |
| Luis Torrens | Robert Machado | Tony Tornay | Shawn McGill |
| Ji Hwan Bae | Dave Collins | Mallex Smith | Joe Christopher |
| Chris Suero | Kurt Kingsolver | Jayson Werth | Ben Petrick |
| Jared Young | Armando Rios | Mike Yastrzemski | Jeffrey Hammonds |
| Ryan Clifford | Jon Singleton | Randy Schwartz | Cody Bellinger |
| Jackson Cluff | Anthony Granato | Joe Koppe | Jimmy Sexton |
| David Villar | Brad Nelson | Matt Skole | Mike Reddish |
| Jesse Winker | Norm Siebern | Lee Mazzilli | Steve Braun |
| Tyrone Taylor | Fehlandt Lentini | Jonny Kaplan | Joe Simpson |
| Wyatt Young | Derek Mann | Elio Chacon | Nick Shaw |
| Yonny Hernández | John Finn | Justin Henry | Christian Stringer |
| A.J. Ewing | Tyson Gillies | Lonnie Smith | Mallex Smith |
| Chris Williams | Jerry Goff | Arlo Brunsberg | Jayhawk Owens |
| Kevin Parada | Alfredo Torres | Bob Schmidt | Jack Fimple |
| Jose Rojas | Franklin Stubbs | Leon Durham | Chris Young |
| Gilberto Celestino | Trey Beamon | Neil Martin | L.J. Hoes |
| Starling Marte | Skeeter Barnes | George Metkovich | Bert Haas |
| Christian Arroyo | Ray Hamrick | Jay Ragni | Mark DeRosa |
| Luis De Los Santos | Dick Canan | Jim Gruber | Julio Cordido |
| Rafael Ortega | Cliff Heathcote | Sam Fuld | Willie Harris |
| Nick Morabito | Don White | Alejandro De Aza | Leo Sutherland |
| Tsung-Che Cheng | Hak-Ju Lee | Matt Smith | Juan Gonzalez |
| Cristian Pache | Mike Sullivan | Victor LaRose | Mark Doran |
| Niko Goodrum | Oscar Grimes | Anthony Seratelli | Drew Maggi |
| Jose Ramos | Marvin Stendel | Joe Gaetti | Bob Prentice |
| D’Andre Smith | D’Arby Myers | Hal Jeffcoat | Willie Romero |
| Hayden Senger | Otis Thornton | Tony DeFrancesco | Scott Knazek |
| Travis Swaggerty | Don Frailey | Zach Collier | Mark Thomas |
| JT Schwartz | Kevin Burford | Andy Barkett | Austin Davidson |
| Travis Jankowski | Jarrod Dyson | Jim Busby | Tack Wilson |
| Estarling Mercado | Daniel Berg | Jacob Julius | Ed Hartman |
| Nick Lorusso | Robert Mills | Sean Walsh | Bob Gergen |
| Marco Vargas | Elvis Pena | Larry Eckenrode | Forrest Wall |
| Eli Serrano III | Roger McSwain | Bob Wolenski | Jabari Henry |
| Onix Vega | Kevin Davidson | Jeremy Dowdy | Brent Mayne |
| Troy Schreffler Jr. | Kent Gerst | Brian Gump | Cristian Paulino |
| Omar De Los Santos | Dennis Hood | Tim Battle | Dorian Speed |
| Trace Willhoite | Garrick Haltiwanger | Curtis Suchan | Jim O’Rourke |
| Yohairo Cuevas | Adam Bonner | Michael Strickland | James Broughton |
| William Lugo | Ryan Stegall | Brett Elam | Jake Wald |
| Yonatan Henriquez | George Wright | Roberto Kelly | Jerry Bartee |
| Ronald Hernandez | Harry Billie | John Antonelli | Jim Lawrence |
| Diego Mosquera | Jerald Cain | Mark Miller | Earl Agnoly |
| Boston Baro | Ivan Castillo | Nick Allen | Gavin Lux |
| Alex Ramirez | Jay Johnson | Brandon Bridgers | Ossie Garcia |
| Corey Collins | Bill Brown | Samuel Antcliffe | De Jon Watson |
| Vincent Perozo | Parker Morin | Dallas Jones | Ray Bond |
| Colin Houck | Ron Dunn | Alex Liddi | Tony Taylor |
| Jefrey De Los Santos | Randy Black | Peter Fatse | Tim Curley |
| Nick Roselli | Chris Brown | Scott Clemo | Ryan Schimpf |
| Player | 80th BA | 80th OBP | 80th SLG | 80th OPS+ | 80th WAR | 20th BA | 20th OBP | 20th SLG | 20th OPS+ | 20th WAR |
|---|---|---|---|---|---|---|---|---|---|---|
| Juan Soto | .296 | .436 | .594 | 187 | 7.3 | .248 | .382 | .473 | 145 | 4.1 |
| Francisco Lindor | .286 | .361 | .507 | 143 | 7.0 | .240 | .314 | .409 | 102 | 3.8 |
| Bo Bichette | .319 | .366 | .499 | 142 | 5.2 | .263 | .310 | .405 | 101 | 2.3 |
| Marcus Semien | .268 | .338 | .432 | 117 | 4.0 | .219 | .286 | .343 | 79 | 1.3 |
| Brett Baty | .276 | .348 | .482 | 131 | 3.6 | .222 | .294 | .371 | 89 | 1.1 |
| Francisco Alvarez | .263 | .343 | .502 | 137 | 3.6 | .208 | .285 | .382 | 91 | 1.3 |
| Jorge Polanco | .280 | .354 | .494 | 138 | 3.2 | .225 | .300 | .399 | 99 | 1.0 |
| Luis Robert Jr. | .264 | .326 | .464 | 122 | 3.4 | .212 | .277 | .364 | 82 | 1.0 |
| Mark Vientos | .277 | .338 | .503 | 134 | 3.4 | .225 | .281 | .387 | 90 | 0.6 |
| Jacob Reimer | .263 | .337 | .458 | 124 | 3.2 | .212 | .288 | .355 | 84 | 0.8 |
| Ronny Mauricio | .267 | .319 | .446 | 114 | 3.1 | .216 | .265 | .350 | 75 | 0.8 |
| Jose Siri | .229 | .293 | .437 | 104 | 2.4 | .176 | .234 | .319 | 59 | 0.3 |
| Carson Benge | .273 | .351 | .456 | 127 | 2.6 | .219 | .300 | .344 | 85 | 0.0 |
| Luis Torrens | .282 | .336 | .434 | 115 | 2.0 | .221 | .276 | .333 | 74 | 0.6 |
| Ji Hwan Bae | .281 | .348 | .404 | 112 | 2.0 | .225 | .293 | .317 | 76 | 0.2 |
| Chris Suero | .236 | .328 | .392 | 103 | 2.2 | .176 | .275 | .284 | 62 | -0.2 |
| Jared Young | .267 | .349 | .473 | 131 | 1.8 | .216 | .299 | .370 | 92 | 0.0 |
| Ryan Clifford | .241 | .339 | .464 | 123 | 2.3 | .186 | .281 | .355 | 79 | -0.7 |
| Jackson Cluff | .232 | .320 | .389 | 100 | 1.8 | .176 | .261 | .291 | 58 | 0.0 |
| David Villar | .245 | .331 | .425 | 112 | 1.9 | .192 | .274 | .324 | 71 | -0.2 |
| Jesse Winker | .265 | .376 | .420 | 126 | 1.7 | .206 | .316 | .315 | 81 | -0.2 |
| Tyrone Taylor | .259 | .313 | .426 | 108 | 1.8 | .202 | .253 | .322 | 65 | 0.0 |
| Wyatt Young | .261 | .339 | .316 | 87 | 1.7 | .205 | .284 | .249 | 55 | -0.1 |
| Yonny Hernández | .269 | .341 | .332 | 93 | 1.5 | .216 | .289 | .265 | 60 | -0.1 |
| A.J. Ewing | .280 | .342 | .389 | 108 | 2.1 | .221 | .289 | .303 | 70 | -0.7 |
| Chris Williams | .225 | .308 | .412 | 100 | 1.4 | .170 | .253 | .299 | 58 | -0.3 |
| Kevin Parada | .244 | .304 | .406 | 98 | 1.4 | .190 | .251 | .313 | 59 | -0.7 |
| Jose Rojas | .242 | .315 | .476 | 120 | 1.5 | .196 | .269 | .375 | 83 | -0.5 |
| Gilberto Celestino | .262 | .341 | .354 | 97 | 1.2 | .208 | .282 | .272 | 60 | -0.5 |
| Starling Marte | .289 | .348 | .424 | 118 | 1.3 | .229 | .291 | .339 | 80 | -0.3 |
| Christian Arroyo | .277 | .326 | .416 | 107 | 1.0 | .218 | .266 | .320 | 65 | -0.2 |
| Luis De Los Santos | .243 | .299 | .368 | 89 | 1.2 | .191 | .242 | .280 | 49 | -0.5 |
| Rafael Ortega | .240 | .325 | .380 | 97 | 1.2 | .181 | .266 | .275 | 55 | -0.5 |
| Nick Morabito | .264 | .328 | .352 | 92 | 1.1 | .214 | .282 | .283 | 63 | -0.7 |
| Tsung-Che Cheng | .239 | .309 | .346 | 87 | 1.2 | .187 | .261 | .270 | 54 | -0.8 |
| Cristian Pache | .242 | .307 | .341 | 84 | 0.8 | .181 | .250 | .260 | 47 | -0.5 |
| Niko Goodrum | .250 | .355 | .372 | 109 | 0.7 | .190 | .294 | .271 | 68 | -0.5 |
| Jose Ramos | .240 | .303 | .410 | 99 | 1.1 | .186 | .249 | .308 | 59 | -1.2 |
| D’Andre Smith | .266 | .316 | .395 | 98 | 0.7 | .218 | .267 | .314 | 66 | -0.7 |
| Hayden Senger | .239 | .293 | .347 | 83 | 0.9 | .176 | .231 | .255 | 40 | -0.6 |
| Travis Swaggerty | .225 | .307 | .330 | 80 | 0.2 | .172 | .249 | .246 | 43 | -0.8 |
| JT Schwartz | .254 | .324 | .371 | 96 | 0.5 | .200 | .273 | .283 | 60 | -1.2 |
| Travis Jankowski | .253 | .332 | .302 | 83 | 0.1 | .190 | .275 | .228 | 49 | -0.7 |
| Estarling Mercado | .223 | .300 | .386 | 90 | 0.0 | .170 | .245 | .286 | 52 | -1.0 |
| Nick Lorusso | .240 | .292 | .351 | 81 | 0.4 | .192 | .242 | .284 | 49 | -1.4 |
| Marco Vargas | .236 | .305 | .290 | 71 | 0.5 | .179 | .252 | .221 | 39 | -1.3 |
| Eli Serrano III | .224 | .296 | .370 | 86 | 0.2 | .175 | .247 | .279 | 50 | -1.5 |
| Onix Vega | .234 | .304 | .299 | 73 | 0.0 | .170 | .241 | .220 | 32 | -1.1 |
| Troy Schreffler Jr. | .227 | .282 | .352 | 80 | 0.0 | .171 | .229 | .261 | 42 | -1.0 |
| Omar De Los Santos | .227 | .267 | .391 | 84 | 0.0 | .173 | .215 | .288 | 44 | -1.7 |
| Trace Willhoite | .211 | .292 | .393 | 89 | 0.1 | .159 | .240 | .291 | 50 | -2.0 |
| Yohairo Cuevas | .226 | .312 | .308 | 77 | -0.1 | .175 | .258 | .233 | 43 | -1.9 |
| William Lugo | .224 | .290 | .341 | 77 | -0.1 | .171 | .234 | .258 | 41 | -2.1 |
| Yonatan Henriquez | .226 | .298 | .339 | 78 | -0.2 | .172 | .242 | .258 | 42 | -2.1 |
| Ronald Hernandez | .230 | .293 | .326 | 76 | 0.0 | .165 | .232 | .239 | 38 | -2.1 |
| Diego Mosquera | .232 | .296 | .266 | 61 | -0.8 | .175 | .239 | .198 | 27 | -1.8 |
| Boston Baro | .239 | .285 | .351 | 79 | -0.1 | .188 | .232 | .263 | 40 | -2.4 |
| Alex Ramirez | .227 | .286 | .301 | 68 | -0.5 | .178 | .236 | .235 | 37 | -2.2 |
| Corey Collins | .169 | .289 | .278 | 60 | -0.8 | .123 | .240 | .198 | 28 | -1.9 |
| Vincent Perozo | .222 | .295 | .315 | 73 | -0.7 | .160 | .235 | .229 | 35 | -2.1 |
| Colin Houck | .212 | .271 | .330 | 70 | -0.6 | .155 | .215 | .246 | 32 | -2.9 |
| Jefrey De Los Santos | .209 | .272 | .325 | 68 | -1.1 | .161 | .220 | .241 | 33 | -2.4 |
| Nick Roselli | .209 | .269 | .350 | 75 | -1.2 | .157 | .219 | .257 | 36 | -2.8 |
| Player | BA vs. L | OBP vs. L | SLG vs. L | BA vs. R | OBP vs. R | SLG vs. R |
|---|---|---|---|---|---|---|
| Juan Soto | .260 | .383 | .468 | .277 | .420 | .551 |
| Francisco Lindor | .268 | .337 | .448 | .262 | .338 | .455 |
| Bo Bichette | .297 | .351 | .464 | .293 | .336 | .439 |
| Marcus Semien | .250 | .325 | .405 | .241 | .311 | .383 |
| Brett Baty | .240 | .303 | .395 | .256 | .325 | .441 |
| Francisco Alvarez | .239 | .331 | .451 | .232 | .306 | .432 |
| Jorge Polanco | .258 | .314 | .445 | .251 | .332 | .447 |
| Luis Robert Jr. | .254 | .323 | .430 | .232 | .294 | .401 |
| Mark Vientos | .266 | .323 | .468 | .244 | .305 | .430 |
| Jacob Reimer | .241 | .320 | .406 | .232 | .310 | .402 |
| Ronny Mauricio | .241 | .286 | .399 | .244 | .295 | .391 |
| Jose Siri | .206 | .271 | .393 | .200 | .255 | .373 |
| Carson Benge | .232 | .317 | .360 | .251 | .329 | .413 |
| Luis Torrens | .253 | .303 | .407 | .247 | .298 | .361 |
| Ji Hwan Bae | .246 | .308 | .331 | .258 | .332 | .371 |
| Chris Suero | .202 | .304 | .336 | .205 | .304 | .333 |
| Jared Young | .231 | .311 | .398 | .247 | .331 | .434 |
| Ryan Clifford | .203 | .293 | .366 | .216 | .313 | .420 |
| Jackson Cluff | .193 | .273 | .295 | .208 | .295 | .346 |
| David Villar | .226 | .316 | .383 | .217 | .297 | .367 |
| Jesse Winker | .219 | .337 | .342 | .239 | .350 | .380 |
| Tyrone Taylor | .233 | .286 | .369 | .230 | .280 | .368 |
| Wyatt Young | .226 | .303 | .283 | .232 | .313 | .289 |
| Yonny Hernández | .245 | .320 | .318 | .239 | .314 | .288 |
| A.J. Ewing | .247 | .306 | .329 | .253 | .317 | .353 |
| Chris Williams | .204 | .297 | .359 | .189 | .271 | .344 |
| Kevin Parada | .223 | .290 | .375 | .216 | .276 | .352 |
| Jose Rojas | .214 | .285 | .368 | .221 | .296 | .441 |
| Gilberto Celestino | .239 | .323 | .301 | .235 | .306 | .316 |
| Starling Marte | .266 | .322 | .380 | .258 | .318 | .380 |
| Christian Arroyo | .247 | .291 | .384 | .247 | .293 | .356 |
| Luis De Los Santos | .224 | .278 | .345 | .213 | .265 | .308 |
| Rafael Ortega | .200 | .274 | .277 | .214 | .302 | .336 |
| Nick Morabito | .228 | .294 | .293 | .245 | .309 | .323 |
| Tsung-Che Cheng | .211 | .274 | .293 | .214 | .287 | .313 |
| Cristian Pache | .224 | .303 | .318 | .200 | .267 | .287 |
| Niko Goodrum | .233 | .333 | .317 | .212 | .326 | .325 |
| Jose Ramos | .218 | .282 | .394 | .212 | .273 | .346 |
| D’Andre Smith | .245 | .294 | .373 | .244 | .292 | .343 |
| Hayden Senger | .203 | .256 | .278 | .206 | .263 | .303 |
| Travis Swaggerty | .194 | .260 | .299 | .198 | .282 | .278 |
| JT Schwartz | .212 | .288 | .283 | .228 | .300 | .333 |
| Travis Jankowski | .195 | .283 | .220 | .225 | .308 | .279 |
| Estarling Mercado | .184 | .259 | .265 | .197 | .275 | .358 |
| Nick Lorusso | .211 | .272 | .325 | .214 | .267 | .312 |
| Marco Vargas | .202 | .267 | .239 | .207 | .280 | .258 |
| Eli Serrano III | .188 | .255 | .313 | .204 | .281 | .327 |
| Onix Vega | .206 | .271 | .238 | .200 | .271 | .267 |
| Troy Schreffler Jr. | .203 | .273 | .322 | .193 | .245 | .293 |
| Omar De Los Santos | .194 | .240 | .337 | .200 | .243 | .332 |
| Trace Willhoite | .188 | .273 | .350 | .186 | .264 | .330 |
| Yohairo Cuevas | .186 | .270 | .235 | .201 | .288 | .281 |
| William Lugo | .200 | .268 | .304 | .194 | .260 | .293 |
| Yonatan Henriquez | .198 | .261 | .292 | .201 | .270 | .297 |
| Ronald Hernandez | .200 | .258 | .255 | .196 | .265 | .287 |
| Diego Mosquera | .194 | .260 | .224 | .204 | .271 | .235 |
| Boston Baro | .198 | .244 | .279 | .214 | .259 | .301 |
| Alex Ramirez | .206 | .273 | .260 | .196 | .255 | .273 |
| Corey Collins | .138 | .260 | .200 | .145 | .263 | .248 |
| Vincent Perozo | .184 | .259 | .263 | .188 | .259 | .266 |
| Colin Houck | .189 | .255 | .311 | .180 | .238 | .280 |
| Jefrey De Los Santos | .187 | .244 | .280 | .184 | .246 | .286 |
| Nick Roselli | .165 | .228 | .271 | .185 | .251 | .304 |
| Player | T | Age | W | L | ERA | G | GS | IP | H | ER | HR | BB | SO |
|---|---|---|---|---|---|---|---|---|---|---|---|---|---|
| Freddy Peralta | R | 30 | 12 | 9 | 3.87 | 30 | 30 | 160.7 | 133 | 69 | 21 | 61 | 174 |
| Clay Holmes | R | 33 | 10 | 8 | 3.90 | 28 | 24 | 136.0 | 137 | 59 | 11 | 47 | 109 |
| Nolan McLean | R | 24 | 10 | 8 | 3.94 | 28 | 26 | 144.0 | 128 | 63 | 15 | 56 | 142 |
| Kodai Senga | R | 33 | 8 | 7 | 3.82 | 25 | 25 | 127.3 | 110 | 54 | 15 | 58 | 125 |
| David Peterson | L | 30 | 7 | 7 | 4.07 | 28 | 27 | 146.0 | 140 | 66 | 13 | 58 | 133 |
| Jonah Tong | R | 23 | 9 | 8 | 4.07 | 26 | 25 | 117.3 | 103 | 53 | 15 | 48 | 132 |
| Tylor Megill | R | 30 | 6 | 6 | 4.00 | 21 | 21 | 96.0 | 87 | 45 | 11 | 41 | 105 |
| Devin Williams | R | 31 | 6 | 4 | 3.14 | 61 | 0 | 57.3 | 39 | 20 | 5 | 23 | 79 |
| Tobias Myers | R | 27 | 6 | 6 | 4.38 | 29 | 20 | 111.0 | 113 | 54 | 15 | 36 | 89 |
| Jonathan Pintaro | R | 28 | 4 | 3 | 4.10 | 26 | 15 | 74.7 | 70 | 34 | 8 | 30 | 71 |
| Jonathan Santucci | L | 23 | 6 | 6 | 4.70 | 24 | 22 | 105.3 | 103 | 55 | 15 | 39 | 91 |
| Jack Wenninger | R | 24 | 7 | 8 | 4.71 | 24 | 22 | 116.7 | 118 | 61 | 17 | 40 | 95 |
| Sean Manaea | L | 34 | 5 | 5 | 4.51 | 22 | 18 | 101.7 | 94 | 51 | 16 | 31 | 104 |
| Joander Suarez | R | 26 | 5 | 7 | 4.57 | 21 | 17 | 90.7 | 94 | 46 | 13 | 25 | 72 |
| Justin Hagenman | R | 29 | 3 | 4 | 4.46 | 30 | 12 | 84.7 | 85 | 42 | 13 | 20 | 74 |
| R.J. Gordon | R | 24 | 6 | 7 | 4.84 | 24 | 19 | 113.3 | 113 | 61 | 17 | 41 | 95 |
| Griffin Canning | R | 30 | 6 | 6 | 4.76 | 20 | 20 | 102.0 | 100 | 54 | 17 | 40 | 92 |
| A.J. Minter | L | 32 | 5 | 3 | 3.53 | 56 | 0 | 51.0 | 43 | 20 | 6 | 17 | 56 |
| Cooper Criswell | R | 29 | 4 | 5 | 4.67 | 24 | 16 | 90.7 | 92 | 47 | 12 | 29 | 71 |
| Brandon Waddell | L | 32 | 5 | 5 | 4.67 | 24 | 14 | 86.7 | 89 | 45 | 12 | 29 | 68 |
| Christian Scott | R | 27 | 3 | 3 | 4.55 | 14 | 14 | 63.3 | 62 | 32 | 9 | 18 | 55 |
| Luke Weaver | R | 32 | 4 | 4 | 4.30 | 47 | 5 | 69.0 | 64 | 33 | 10 | 24 | 76 |
| Zach Thornton | L | 24 | 4 | 5 | 4.65 | 16 | 15 | 69.7 | 71 | 36 | 9 | 22 | 53 |
| Felipe De La Cruz | L | 25 | 4 | 5 | 4.66 | 27 | 12 | 75.3 | 75 | 39 | 10 | 34 | 70 |
| Will Watson | R | 23 | 5 | 6 | 4.98 | 26 | 21 | 103.0 | 100 | 57 | 14 | 49 | 90 |
| Robert Stock | R | 36 | 3 | 5 | 4.86 | 18 | 13 | 70.3 | 70 | 38 | 10 | 31 | 64 |
| Brooks Raley | L | 38 | 2 | 2 | 3.79 | 41 | 1 | 35.7 | 30 | 15 | 3 | 12 | 35 |
| Carl Edwards Jr. | R | 34 | 2 | 3 | 4.44 | 25 | 6 | 52.7 | 52 | 26 | 7 | 23 | 45 |
| Kevin Herget | R | 35 | 2 | 2 | 4.28 | 35 | 4 | 54.7 | 56 | 26 | 7 | 15 | 44 |
| Joey Gerber | R | 29 | 1 | 1 | 4.43 | 32 | 8 | 42.7 | 41 | 21 | 6 | 14 | 40 |
| Huascar Brazobán | R | 36 | 3 | 3 | 4.26 | 50 | 2 | 61.3 | 56 | 29 | 6 | 29 | 58 |
| Luis García | R | 39 | 2 | 2 | 4.10 | 51 | 1 | 48.3 | 48 | 22 | 4 | 20 | 43 |
| Dylan Ross | R | 25 | 1 | 1 | 4.12 | 53 | 0 | 54.7 | 47 | 25 | 7 | 26 | 58 |
| Brendan Girton | R | 24 | 3 | 4 | 5.03 | 24 | 20 | 78.7 | 76 | 44 | 10 | 38 | 66 |
| Reed Garrett | R | 33 | 4 | 3 | 3.99 | 37 | 0 | 38.3 | 35 | 17 | 4 | 19 | 41 |
| Max Kranick | R | 28 | 2 | 1 | 4.46 | 26 | 4 | 40.3 | 41 | 20 | 6 | 11 | 31 |
| Richard Lovelady | L | 30 | 2 | 2 | 4.27 | 43 | 1 | 46.3 | 44 | 22 | 5 | 15 | 43 |
| Aaron Rozek | L | 30 | 3 | 4 | 5.05 | 26 | 11 | 92.7 | 100 | 52 | 14 | 30 | 66 |
| Adbert Alzolay | R | 31 | 2 | 3 | 4.25 | 31 | 1 | 36.0 | 34 | 17 | 5 | 11 | 32 |
| Luis Moreno | R | 27 | 5 | 7 | 5.08 | 31 | 12 | 85.0 | 88 | 48 | 11 | 40 | 64 |
| Jordan Geber | R | 26 | 3 | 3 | 4.97 | 20 | 8 | 54.3 | 59 | 30 | 8 | 20 | 35 |
| Dedniel Núñez | R | 30 | 2 | 2 | 4.17 | 28 | 0 | 36.7 | 34 | 17 | 5 | 15 | 38 |
| Austin Warren | R | 30 | 5 | 5 | 4.53 | 35 | 3 | 51.7 | 49 | 26 | 7 | 20 | 47 |
| Joe Jacques | L | 31 | 2 | 2 | 4.35 | 43 | 1 | 49.7 | 49 | 24 | 5 | 18 | 42 |
| Douglas Orellana | R | 24 | 2 | 3 | 4.82 | 32 | 6 | 52.3 | 50 | 28 | 8 | 28 | 51 |
| Colin Poche | L | 32 | 3 | 3 | 4.46 | 45 | 0 | 40.3 | 37 | 20 | 6 | 17 | 37 |
| Nate Lavender | L | 26 | 3 | 2 | 4.37 | 25 | 0 | 35.0 | 30 | 17 | 4 | 18 | 38 |
| José Castillo | L | 30 | 2 | 3 | 4.32 | 39 | 0 | 41.7 | 39 | 20 | 5 | 18 | 43 |
| Brian Metoyer | R | 29 | 1 | 1 | 4.50 | 33 | 0 | 36.0 | 31 | 18 | 4 | 19 | 40 |
| Ryan Lambert | R | 23 | 1 | 2 | 4.53 | 47 | 0 | 47.7 | 41 | 24 | 6 | 25 | 53 |
| Nick Burdi | R | 33 | 2 | 1 | 4.50 | 33 | 0 | 36.0 | 31 | 18 | 4 | 19 | 39 |
| Alex Carrillo | R | 29 | 3 | 4 | 4.57 | 37 | 0 | 43.3 | 39 | 22 | 6 | 20 | 45 |
| Saul Garcia | R | 23 | 3 | 5 | 5.12 | 31 | 4 | 51.0 | 47 | 29 | 7 | 29 | 51 |
| Frankie Montas | R | 33 | 4 | 7 | 5.44 | 18 | 17 | 86.0 | 90 | 52 | 14 | 38 | 71 |
| Carlos Guzman | R | 28 | 3 | 5 | 5.07 | 34 | 4 | 55.0 | 55 | 31 | 8 | 25 | 46 |
| Jefry Yan | L | 29 | 2 | 3 | 4.75 | 29 | 1 | 36.0 | 31 | 19 | 4 | 23 | 40 |
| Drew Smith | R | 32 | 2 | 3 | 4.79 | 37 | 0 | 35.7 | 34 | 19 | 6 | 17 | 36 |
| Matt Turner | L | 26 | 1 | 2 | 5.08 | 36 | 3 | 51.3 | 51 | 29 | 7 | 25 | 42 |
| Hunter Parsons | R | 29 | 2 | 3 | 4.98 | 24 | 0 | 34.3 | 32 | 19 | 5 | 17 | 34 |
| Joshua Cornielly | R | 25 | 3 | 4 | 4.97 | 34 | 1 | 50.7 | 50 | 28 | 8 | 20 | 44 |
| Robinson Martínez | R | 28 | 1 | 1 | 4.94 | 26 | 0 | 31.0 | 30 | 17 | 4 | 17 | 29 |
| Zach Peek | R | 28 | 5 | 6 | 4.85 | 35 | 1 | 55.7 | 56 | 30 | 8 | 26 | 48 |
| Trey McGough | L | 28 | 2 | 3 | 5.02 | 24 | 1 | 43.0 | 43 | 24 | 6 | 22 | 35 |
| Ben Simon | R | 24 | 2 | 4 | 4.96 | 33 | 0 | 45.3 | 46 | 25 | 6 | 17 | 35 |
| Daniel Juarez | L | 25 | 2 | 2 | 5.05 | 27 | 0 | 35.7 | 36 | 20 | 5 | 17 | 28 |
| Justin Garza | R | 32 | 2 | 4 | 5.40 | 38 | 1 | 43.3 | 46 | 26 | 7 | 17 | 34 |
| Player | IP | K/9 | BB/9 | HR/9 | BB% | K% | BABIP | ERA+ | 3ERA+ | FIP | ERA- | WAR |
|---|---|---|---|---|---|---|---|---|---|---|---|---|
| Freddy Peralta | 160.7 | 9.7 | 3.4 | 1.2 | 9.1% | 25.9% | .273 | 108 | 106 | 3.97 | 93 | 2.5 |
| Clay Holmes | 136.0 | 7.2 | 3.1 | 0.7 | 8.0% | 18.5% | .304 | 107 | 103 | 3.83 | 94 | 2.4 |
| Nolan McLean | 144.0 | 8.9 | 3.5 | 0.9 | 9.2% | 23.2% | .288 | 106 | 107 | 3.98 | 94 | 2.3 |
| Kodai Senga | 127.3 | 8.8 | 4.1 | 1.1 | 10.5% | 22.7% | .277 | 109 | 105 | 4.19 | 92 | 2.1 |
| David Peterson | 146.0 | 8.2 | 3.6 | 0.8 | 9.2% | 21.1% | .301 | 103 | 100 | 3.83 | 97 | 2.0 |
| Jonah Tong | 117.3 | 10.1 | 3.7 | 1.2 | 9.6% | 26.3% | .293 | 103 | 107 | 3.85 | 97 | 1.7 |
| Tylor Megill | 96.0 | 9.8 | 3.8 | 1.0 | 9.9% | 25.3% | .300 | 99 | 97 | 3.93 | 101 | 1.2 |
| Devin Williams | 57.3 | 12.4 | 3.6 | 0.8 | 9.8% | 33.8% | .274 | 133 | 126 | 2.90 | 75 | 1.1 |
| Tobias Myers | 111.0 | 7.2 | 2.9 | 1.2 | 7.5% | 18.6% | .293 | 95 | 97 | 4.40 | 105 | 1.0 |
| Jonathan Pintaro | 74.7 | 8.6 | 3.6 | 1.0 | 9.3% | 22.0% | .295 | 102 | 101 | 4.14 | 98 | 0.9 |
| Jonathan Santucci | 105.3 | 7.8 | 3.3 | 1.3 | 8.5% | 19.9% | .289 | 89 | 94 | 4.48 | 112 | 0.8 |
| Jack Wenninger | 116.7 | 7.3 | 3.1 | 1.3 | 7.8% | 18.6% | .291 | 89 | 94 | 4.59 | 112 | 0.8 |
| Sean Manaea | 101.7 | 9.2 | 2.7 | 1.4 | 7.3% | 24.5% | .287 | 92 | 86 | 4.26 | 109 | 0.8 |
| Joander Suarez | 90.7 | 7.1 | 2.5 | 1.3 | 6.4% | 18.6% | .296 | 91 | 95 | 4.40 | 110 | 0.8 |
| Justin Hagenman | 84.7 | 7.9 | 2.1 | 1.4 | 5.6% | 20.9% | .293 | 93 | 94 | 4.23 | 108 | 0.7 |
| R.J. Gordon | 113.3 | 7.5 | 3.3 | 1.4 | 8.4% | 19.3% | .288 | 86 | 91 | 4.60 | 116 | 0.6 |
| Griffin Canning | 102.0 | 8.1 | 3.5 | 1.5 | 9.0% | 20.8% | .286 | 88 | 87 | 4.79 | 114 | 0.6 |
| A.J. Minter | 51.0 | 9.9 | 3.0 | 1.1 | 8.0% | 26.4% | .282 | 118 | 112 | 3.56 | 85 | 0.6 |
| Cooper Criswell | 90.7 | 7.0 | 2.9 | 1.2 | 7.5% | 18.3% | .292 | 89 | 89 | 4.54 | 112 | 0.6 |
| Brandon Waddell | 86.7 | 7.1 | 3.0 | 1.2 | 7.8% | 18.2% | .294 | 89 | 86 | 4.67 | 112 | 0.5 |
| Christian Scott | 63.3 | 7.8 | 2.6 | 1.3 | 6.8% | 20.8% | .290 | 92 | 94 | 4.32 | 109 | 0.5 |
| Luke Weaver | 69.0 | 9.9 | 3.1 | 1.3 | 8.2% | 25.9% | .298 | 97 | 94 | 3.98 | 103 | 0.5 |
| Zach Thornton | 69.7 | 6.8 | 2.8 | 1.2 | 7.4% | 17.7% | .291 | 90 | 95 | 4.48 | 111 | 0.5 |
| Felipe De La Cruz | 75.3 | 8.4 | 4.1 | 1.2 | 10.1% | 20.8% | .301 | 90 | 93 | 4.54 | 112 | 0.4 |
| Will Watson | 103.0 | 7.9 | 4.3 | 1.2 | 10.7% | 19.7% | .289 | 84 | 90 | 4.76 | 119 | 0.4 |
| Robert Stock | 70.3 | 8.2 | 4.0 | 1.3 | 10.0% | 20.6% | .297 | 86 | 78 | 4.90 | 117 | 0.3 |
| Brooks Raley | 35.7 | 8.8 | 3.0 | 0.8 | 8.2% | 23.8% | .278 | 110 | 97 | 3.64 | 91 | 0.3 |
| Carl Edwards Jr. | 52.7 | 7.7 | 3.9 | 1.2 | 10.0% | 19.5% | .292 | 94 | 87 | 4.55 | 107 | 0.3 |
| Kevin Herget | 54.7 | 7.2 | 2.5 | 1.2 | 6.4% | 18.9% | .297 | 97 | 90 | 4.15 | 103 | 0.3 |
| Joey Gerber | 42.7 | 8.4 | 3.0 | 1.3 | 7.7% | 21.9% | .292 | 94 | 95 | 4.24 | 106 | 0.3 |
| Huascar Brazobán | 61.3 | 8.5 | 4.3 | 0.9 | 10.7% | 21.5% | .291 | 98 | 89 | 4.16 | 102 | 0.3 |
| Luis García | 48.3 | 8.0 | 3.7 | 0.7 | 9.3% | 20.0% | .308 | 102 | 98 | 3.89 | 98 | 0.3 |
| Dylan Ross | 54.7 | 9.5 | 4.3 | 1.2 | 10.9% | 24.4% | .282 | 101 | 108 | 4.19 | 99 | 0.2 |
| Brendan Girton | 78.7 | 7.5 | 4.3 | 1.1 | 10.9% | 19.0% | .287 | 83 | 87 | 4.85 | 120 | 0.2 |
| Reed Garrett | 38.3 | 9.6 | 4.5 | 0.9 | 11.2% | 24.3% | .304 | 105 | 97 | 3.95 | 95 | 0.2 |
| Max Kranick | 40.3 | 6.9 | 2.5 | 1.3 | 6.4% | 18.1% | .287 | 93 | 94 | 4.45 | 107 | 0.2 |
| Richard Lovelady | 46.3 | 8.4 | 2.9 | 1.0 | 7.7% | 21.9% | .295 | 98 | 98 | 4.01 | 102 | 0.2 |
| Aaron Rozek | 92.7 | 6.4 | 2.9 | 1.4 | 7.4% | 16.3% | .296 | 83 | 82 | 4.84 | 121 | 0.1 |
| Adbert Alzolay | 36.0 | 8.0 | 2.8 | 1.3 | 7.3% | 21.2% | .284 | 98 | 95 | 4.36 | 102 | 0.1 |
| Luis Moreno | 85.0 | 6.8 | 4.2 | 1.2 | 10.4% | 16.7% | .294 | 82 | 84 | 4.96 | 122 | 0.1 |
| Jordan Geber | 54.3 | 5.8 | 3.3 | 1.3 | 8.3% | 14.5% | .291 | 84 | 87 | 5.00 | 119 | 0.1 |
| Dedniel Núñez | 36.7 | 9.3 | 3.7 | 1.2 | 9.4% | 23.9% | .293 | 100 | 100 | 4.09 | 100 | 0.1 |
| Austin Warren | 51.7 | 8.2 | 3.5 | 1.2 | 9.0% | 21.2% | .288 | 92 | 92 | 4.50 | 109 | 0.1 |
| Joe Jacques | 49.7 | 7.6 | 3.3 | 0.9 | 8.4% | 19.5% | .299 | 96 | 92 | 4.23 | 104 | 0.1 |
| Douglas Orellana | 52.3 | 8.8 | 4.8 | 1.4 | 11.9% | 21.6% | .292 | 87 | 93 | 4.92 | 115 | 0.1 |
| Colin Poche | 40.3 | 8.3 | 3.8 | 1.3 | 9.8% | 21.3% | .277 | 93 | 92 | 4.53 | 107 | 0.0 |
| Nate Lavender | 35.0 | 9.8 | 4.6 | 1.0 | 11.8% | 24.8% | .286 | 95 | 98 | 4.28 | 105 | 0.0 |
| José Castillo | 41.7 | 9.3 | 3.9 | 1.1 | 10.0% | 23.9% | .301 | 97 | 93 | 4.24 | 103 | 0.0 |
| Brian Metoyer | 36.0 | 10.0 | 4.8 | 1.0 | 11.6% | 24.4% | .290 | 93 | 93 | 4.39 | 108 | 0.0 |
| Ryan Lambert | 47.7 | 10.0 | 4.7 | 1.1 | 11.8% | 25.1% | .287 | 92 | 100 | 4.34 | 109 | 0.0 |
| Nick Burdi | 36.0 | 9.8 | 4.8 | 1.0 | 11.8% | 24.2% | .287 | 93 | 88 | 4.36 | 108 | 0.0 |
| Alex Carrillo | 43.3 | 9.3 | 4.2 | 1.2 | 10.4% | 23.3% | .287 | 91 | 90 | 4.48 | 110 | -0.1 |
| Saul Garcia | 51.0 | 9.0 | 5.1 | 1.2 | 12.6% | 22.1% | .288 | 82 | 88 | 4.95 | 122 | -0.1 |
| Frankie Montas | 86.0 | 7.4 | 4.0 | 1.5 | 9.9% | 18.5% | .296 | 77 | 73 | 5.09 | 130 | -0.1 |
| Carlos Guzman | 55.0 | 7.5 | 4.1 | 1.3 | 10.2% | 18.8% | .290 | 82 | 84 | 4.96 | 122 | -0.1 |
| Jefry Yan | 36.0 | 10.0 | 5.8 | 1.0 | 13.7% | 23.8% | .290 | 88 | 86 | 4.64 | 114 | -0.1 |
| Drew Smith | 35.7 | 9.1 | 4.3 | 1.5 | 10.8% | 22.8% | .289 | 87 | 85 | 4.85 | 115 | -0.1 |
| Matt Turner | 51.3 | 7.4 | 4.4 | 1.2 | 10.9% | 18.3% | .289 | 82 | 86 | 5.05 | 122 | -0.2 |
| Hunter Parsons | 34.3 | 8.9 | 4.5 | 1.3 | 11.1% | 22.2% | .287 | 84 | 85 | 4.82 | 119 | -0.2 |
| Joshua Cornielly | 50.7 | 7.8 | 3.6 | 1.4 | 9.0% | 19.7% | .288 | 84 | 90 | 4.96 | 119 | -0.2 |
| Robinson Martínez | 31.0 | 8.4 | 4.9 | 1.2 | 12.1% | 20.7% | .295 | 85 | 84 | 4.91 | 118 | -0.2 |
| Zach Peek | 55.7 | 7.8 | 4.2 | 1.3 | 10.4% | 19.1% | .294 | 86 | 87 | 4.87 | 116 | -0.2 |
| Trey McGough | 43.0 | 7.3 | 4.6 | 1.3 | 11.4% | 18.1% | .289 | 83 | 84 | 4.88 | 120 | -0.2 |
| Ben Simon | 45.3 | 7.0 | 3.4 | 1.2 | 8.5% | 17.5% | .292 | 84 | 88 | 4.80 | 119 | -0.3 |
| Daniel Juarez | 35.7 | 7.1 | 4.3 | 1.3 | 10.7% | 17.6% | .290 | 83 | 87 | 5.10 | 120 | -0.3 |
| Justin Garza | 43.3 | 7.1 | 3.5 | 1.5 | 8.8% | 17.5% | .295 | 77 | 75 | 5.01 | 130 | -0.4 |
| Player | BA vs. L | OBP vs. L | SLG vs. L | BA vs. R | OBP vs. R | SLG vs. R | 80th WAR | 20th WAR | 80th ERA | 20th ERA |
|---|---|---|---|---|---|---|---|---|---|---|
| Freddy Peralta | .216 | .306 | .353 | .227 | .292 | .406 | 3.6 | 1.3 | 3.32 | 4.50 |
| Clay Holmes | .262 | .339 | .403 | .248 | .306 | .355 | 3.3 | 1.5 | 3.47 | 4.46 |
| Nolan McLean | .243 | .335 | .393 | .221 | .294 | .349 | 3.1 | 1.0 | 3.51 | 4.64 |
| Kodai Senga | .233 | .330 | .377 | .226 | .301 | .379 | 2.9 | 1.3 | 3.33 | 4.42 |
| David Peterson | .226 | .288 | .329 | .252 | .331 | .388 | 3.1 | 0.8 | 3.44 | 4.82 |
| Jonah Tong | .214 | .292 | .405 | .241 | .313 | .363 | 2.7 | 0.7 | 3.43 | 4.80 |
| Tylor Megill | .243 | .340 | .403 | .226 | .297 | .363 | 1.8 | 0.3 | 3.63 | 4.99 |
| Devin Williams | .194 | .301 | .337 | .187 | .261 | .280 | 1.9 | 0.1 | 2.28 | 4.64 |
| Tobias Myers | .259 | .326 | .412 | .256 | .309 | .430 | 1.8 | 0.2 | 3.82 | 4.97 |
| Jonathan Pintaro | .268 | .354 | .391 | .214 | .295 | .364 | 1.5 | 0.4 | 3.57 | 4.72 |
| Jonathan Santucci | .255 | .331 | .391 | .247 | .310 | .428 | 1.5 | 0.0 | 4.14 | 5.34 |
| Jack Wenninger | .241 | .314 | .398 | .267 | .322 | .449 | 1.5 | 0.0 | 4.18 | 5.29 |
| Sean Manaea | .216 | .271 | .352 | .248 | .313 | .442 | 1.5 | -0.1 | 3.90 | 5.49 |
| Joander Suarez | .284 | .340 | .481 | .236 | .285 | .382 | 1.4 | 0.1 | 4.03 | 5.28 |
| Justin Hagenman | .255 | .307 | .451 | .256 | .295 | .422 | 1.3 | 0.0 | 3.79 | 5.24 |
| R.J. Gordon | .235 | .307 | .417 | .266 | .325 | .434 | 1.3 | -0.2 | 4.38 | 5.51 |
| Griffin Canning | .253 | .336 | .454 | .252 | .311 | .431 | 1.3 | -0.2 | 4.20 | 5.51 |
| A.J. Minter | .206 | .265 | .286 | .236 | .305 | .417 | 1.1 | 0.0 | 2.77 | 4.55 |
| Cooper Criswell | .266 | .342 | .456 | .249 | .308 | .392 | 1.1 | 0.0 | 4.13 | 5.35 |
| Brandon Waddell | .273 | .341 | .400 | .253 | .323 | .442 | 1.1 | -0.1 | 4.13 | 5.32 |
| Christian Scott | .246 | .301 | .434 | .256 | .319 | .408 | 1.1 | 0.1 | 3.88 | 5.19 |
| Luke Weaver | .240 | .313 | .403 | .237 | .296 | .410 | 1.3 | -0.2 | 3.42 | 5.34 |
| Zach Thornton | .232 | .297 | .305 | .267 | .330 | .462 | 1.0 | 0.0 | 4.09 | 5.27 |
| Felipe De La Cruz | .253 | .330 | .407 | .250 | .335 | .418 | 1.1 | -0.2 | 4.02 | 5.34 |
| Will Watson | .238 | .335 | .386 | .256 | .333 | .437 | 1.1 | -0.4 | 4.53 | 5.65 |
| Robert Stock | .271 | .362 | .450 | .236 | .329 | .392 | 0.8 | -0.2 | 4.24 | 5.68 |
| Brooks Raley | .195 | .267 | .293 | .244 | .330 | .389 | 0.7 | -0.2 | 2.85 | 5.07 |
| Carl Edwards Jr. | .264 | .340 | .396 | .243 | .318 | .435 | 0.7 | -0.1 | 3.85 | 5.29 |
| Kevin Herget | .253 | .308 | .421 | .264 | .313 | .413 | 0.7 | -0.2 | 3.59 | 5.30 |
| Joey Gerber | .244 | .319 | .402 | .244 | .298 | .419 | 0.7 | -0.1 | 3.66 | 5.37 |
| Huascar Brazobán | .248 | .344 | .381 | .231 | .318 | .362 | 0.9 | -0.5 | 3.46 | 5.41 |
| Luis García | .277 | .362 | .410 | .231 | .306 | .352 | 0.7 | -0.2 | 3.30 | 5.26 |
| Dylan Ross | .238 | .330 | .386 | .217 | .300 | .377 | 0.8 | -0.4 | 3.43 | 5.11 |
| Brendan Girton | .258 | .351 | .437 | .237 | .333 | .385 | 0.7 | -0.3 | 4.55 | 5.64 |
| Reed Garrett | .239 | .338 | .403 | .229 | .309 | .349 | 0.6 | -0.3 | 3.24 | 4.97 |
| Max Kranick | .273 | .325 | .468 | .241 | .289 | .398 | 0.5 | -0.2 | 3.87 | 5.30 |
| Richard Lovelady | .219 | .306 | .313 | .256 | .323 | .427 | 0.6 | -0.3 | 3.44 | 5.15 |
| Aaron Rozek | .239 | .302 | .359 | .281 | .340 | .488 | 0.7 | -0.6 | 4.52 | 5.80 |
| Adbert Alzolay | .273 | .342 | .470 | .222 | .288 | .375 | 0.5 | -0.3 | 3.55 | 5.25 |
| Luis Moreno | .275 | .364 | .438 | .249 | .332 | .411 | 0.7 | -0.5 | 4.55 | 5.75 |
| Jordan Geber | .262 | .333 | .458 | .274 | .331 | .425 | 0.4 | -0.3 | 4.45 | 5.51 |
| Dedniel Núñez | .262 | .342 | .446 | .224 | .286 | .382 | 0.5 | -0.2 | 3.32 | 5.17 |
| Austin Warren | .225 | .314 | .393 | .264 | .333 | .427 | 0.5 | -0.4 | 3.87 | 5.45 |
| Joe Jacques | .221 | .299 | .309 | .266 | .345 | .430 | 0.5 | -0.4 | 3.62 | 5.12 |
| Douglas Orellana | .253 | .342 | .414 | .236 | .333 | .425 | 0.5 | -0.4 | 4.17 | 5.57 |
| Colin Poche | .229 | .315 | .438 | .250 | .319 | .413 | 0.5 | -0.4 | 3.68 | 5.47 |
| Nate Lavender | .250 | .365 | .386 | .213 | .311 | .371 | 0.4 | -0.3 | 3.58 | 5.29 |
| José Castillo | .231 | .333 | .327 | .241 | .323 | .420 | 0.4 | -0.4 | 3.61 | 5.34 |
| Brian Metoyer | .222 | .347 | .397 | .233 | .337 | .356 | 0.4 | -0.4 | 3.69 | 5.42 |
| Ryan Lambert | .244 | .350 | .453 | .208 | .306 | .313 | 0.4 | -0.5 | 3.89 | 5.36 |
| Nick Burdi | .234 | .355 | .406 | .222 | .321 | .347 | 0.3 | -0.5 | 3.64 | 5.80 |
| Alex Carrillo | .250 | .348 | .475 | .218 | .303 | .333 | 0.3 | -0.6 | 3.85 | 5.73 |
| Saul Garcia | .240 | .354 | .417 | .233 | .339 | .388 | 0.3 | -0.6 | 4.46 | 5.96 |
| Frankie Montas | .279 | .365 | .497 | .246 | .315 | .408 | 0.4 | -0.7 | 4.89 | 6.12 |
| Carlos Guzman | .263 | .357 | .455 | .248 | .326 | .402 | 0.3 | -0.6 | 4.39 | 6.00 |
| Jefry Yan | .200 | .345 | .289 | .239 | .355 | .413 | 0.3 | -0.6 | 3.93 | 5.95 |
| Drew Smith | .250 | .348 | .450 | .244 | .318 | .436 | 0.2 | -0.6 | 4.03 | 6.01 |
| Matt Turner | .234 | .333 | .375 | .261 | .352 | .442 | 0.3 | -0.6 | 4.42 | 5.82 |
| Hunter Parsons | .263 | .373 | .439 | .227 | .314 | .413 | 0.1 | -0.6 | 4.28 | 5.99 |
| Joshua Cornielly | .260 | .345 | .458 | .243 | .319 | .408 | 0.2 | -0.5 | 4.26 | 5.55 |
| Robinson Martínez | .232 | .348 | .411 | .262 | .355 | .415 | 0.0 | -0.5 | 4.31 | 5.78 |
| Zach Peek | .240 | .333 | .423 | .267 | .344 | .431 | 0.3 | -0.8 | 4.19 | 5.70 |
| Trey McGough | .241 | .323 | .328 | .261 | .346 | .477 | 0.1 | -0.6 | 4.42 | 5.82 |
| Ben Simon | .256 | .337 | .427 | .253 | .330 | .414 | 0.0 | -0.7 | 4.42 | 5.62 |
| Daniel Juarez | .240 | .333 | .400 | .267 | .356 | .444 | 0.0 | -0.5 | 4.45 | 5.55 |
| Justin Garza | .270 | .357 | .473 | .260 | .318 | .440 | 0.0 | -0.8 | 4.70 | 6.42 |
Players are listed with their most recent teams wherever possible. This includes players who are unsigned or have retired, players who will miss 2026 due to injury, and players who were released in 2025. So yes, if you see Joe Schmoe, who quit baseball back in August to form a Ambient Math-Rock Trip-Hop Yacht Metal band that only performs in abandoned malls, he’s still listed here intentionally. ZiPS is assuming a league with an ERA of 4.16.
Hitters are ranked by zWAR, which is to say, WAR values as calculated by me, Dan Szymborski, whose surname is spelled with a z. WAR values might differ slightly from those that appear in the full release of ZiPS. Finally, I will advise anyone against — and might karate chop anyone guilty of — merely adding up WAR totals on a depth chart to produce projected team WAR. It is important to remember that ZiPS is agnostic about playing time, and has no information about, for example, how quickly a team will call up a prospect or what veteran has fallen into disfavor.
As always, incorrect projections are either caused by misinformation, a non-pragmatic reality, or by the skillful sabotage of our friend and former editor. You can, however, still get mad at me on Twitter or on Bluesky. This last is, however, not an actual requirement.